








Introduction
Colorectal cancers (CRCs) confined to the submucosa (pT1) are found in approximately 5%–13% of overall CRC patients. [1,2] Although curative resection anticipates good clinical outcomes in T1 CRC, non-surgical treatment is of interest due to reduced additional burden. Accurate prediction of lymph node metastasis (LNM) after endoscopic resection or local excision is essential for deciding if additional curative resection is needed. Japanese Society for Cancer of the Colon and Rectum (JSCCR) guidelines (“Japanese criteria”) recommends an additional surgical resection if one or more of the following is applicable: (1) positive vertical resection margin; (2) depth of submucosa invasion ≥ 1,000 μm; (3) lymphovascular invasion (LVI) positive; (4) poorly differentiated adenocarcinoma, signet ring cell carcinoma, or mucinous carcinoma; or (5) grade 2/3 budding at the site of deepest invasion [3]. This criterion is based mainly on pathologic features of the obtained specimens. In fact, most of the patients who underwent such additional surgeries harbor no metastatic lymph nodes [4–6], resulting in overtreatment. The probability of LNM is known to increase with more risk factors [7], but these additional risks do not seem to be taken into account because the current guidelines only make all-or-nothing decisions based on each included variable. Given the lack of a reliable tool that can predict LNM, additional biomarkers have been investigated to raise the predictability using different approaches [8,9].
Tumor-infiltrating lymphocytes (TILs) mediate local host anti-tumor immunity of human malignancies and are known to be important prognostic factors in various cancers [10,11]. TILs are composed of various regulatory subtypes. CD8+ T lymphocytes are critical effectors of anti-tumor immunity and CD4+ T lymphocytes help induce, maintain, and memorize CD8+ T cells [12]. A subset of T cells, called regulatory T lymphocytes, inhibit anti-tumor immune reaction and are considered a key factor in immune escape in cancer patients. The transcription factor forkhead box P3 (FOXP3) functions as a master regulator of the development and function of regulatory T cells and is an important developmental factor for CD4+CD25+ T regulatory cells that distinguishes “regulatory cells” from conventional “helper cells” among the CD4+ helper T cells [13,14]. Previous studies have demonstrated that immunoscores (defined as summation of specific number imposed according to the densities of CD3+ or CD8+ positive cells in tumor center [TC] and invasive margin [IM]) are better at estimating patient’s prognosis compared to the TNM stage system in colon and rectal cancers, respectively [15]. Nevertheless, the respective prognostic role of spatial distribution of CD3+ and CD8+ in stage II and stage III CRC showed different results [16,17]. Moreover, the role of TILs in predicting LNM in T1 CRC has not been investigated sufficiently.
Machine learning–based algorithms have been widely used in clinical decision making [18]. Of them, the least absolute shrinkage and selection operator (LASSO) is one of the most commonly used algorithms and its clinical efficacy has been demonstrated previously [17,19]. Such situations could yield many insights for the adoption of machine learning algorithms in predicting LNM in T1 CRC.
The aim of the present study was to investigate the predictive value of immunohistochemistry (IHC) results of TILs in addition to routinely reported pathologic parameters. In addition, we hypothesized that a machine learning–based algorithm that incorporated TILs and conventional histopathologic parameters could be used to improve the predictive accuracy of detecting LNM in T1 CRC patients undergoing curative resection.
Materials and Methods
1. Patients and samples
Patients were identified from a prospectively collected database of CRC resections in a tertiary referral center. This retrospective, single center based study initially considered a total of 381 patients who had undergone potentially curative resection of pathologic T1 CRC between April 2004 and December 2011. In case of CRCs treated with endoscopic procedures such as endoscopic mucosal resection or endoscopic submucosal dissection, surgeons usually recommended additional curative surgical resection with lymph node dissection to the patients when invasion to submucosa or deeper was suspected, resection margin was either vertical or lateral involvement was detected, LVI was noted, or poorly differentiated or mucinous/signet ring cell carcinoma were reported. In this study, we included surgically resected specimens only, which allowed us to evaluate the correct pathologic LNM status.
The inclusion criteria for this study was the availability of formalin-fixed, paraffin-embedded tissue. Exclusion criteria were as follows: those who underwent neoadjuvant therapy, such as preoperative chemoradiotherapy for rectal cancer or neoadjuvant chemotherapy for colon cancer; those who underwent emergency operations; those who had a history of hereditary nonpolyposis CRC, ulcerative colitis or Crohn’s disease; those who was diagnosed as stage IV; and patients with missing data i.e., total retrieved lymph node numbers.
Finally, 316 patients met the inclusion criteria and constitute the study cohort. This study conforms to the TRIPOD (Transparent Reporting of a Multivariable Prediction Model for Individual Prognosis or Diagnosis) statement for studies developing a prediction model.
2. Pathologic evaluation
For this retrospective study, the examinations of pathologic features, including depth of gross morphology, histologic grade, depth of submucosa invasion, LVI, tumor budding, presence of background adenoma (BGA), and immunochemical examinations were conducted by a single experienced pathologist (Y.J.C.) who did not know the patient’s clinical outcomes or LNM status.
Level 2 of Haggitt’s classification for pedunculated type and muscularis mucosae in other non-pedunculated type, such as sessile and superficial cancers, were used as baseline. The vertical distance from baseline to the deepest invasive lesion was used as the depth of invasion in our study [4]. Tumors were classified histologically as: well, moderately, and poorly differentiated adenocarcinomas or as mucinous or signet ring cell type, based on the most predominant histologic feature [8]. Tumor budding is a cancer cell cluster composed of fewer than five cancer or undifferentiated cells, isolated from large cancer portions without forming a unique structure [20]. After selecting the area where budding foci was most intense, the number of budding foci were counted using a magnification of ×200 in hematoxylin and eosin stained (H&E) slides. Tumor budding was defined as high in case of presence of more than five tumor budding, otherwise it was defined as low [21]. LVI was evaluated using H&E slides.
3. IHC and evaluation of IHC results using image analysis software
Representative sections of primary tumors were processed for additional immunohistochemical staining with antibodies against mismatch repair (MMR) status (MLH1 [1:400, clone ES05, Leica Biosystems, Newcastle upon Tyne, UK] and MSH2 [1:800, clone G219-1129, Cell Marque, Rocklin, CA]) and TILs such as CD3 (1:200, clone F7.2.38, Dako, Glostrup, Denmark), CD8 (1:100, clone C8/144B, Dako), and FOXP3 (1:150, clone 236A/E7, Abcam, Cambridge, UK) using a BOND-MAX automatic stainer (Leica Biosystems, Melbourne, Australia) with Bond Polymer Refine Detection (Leica Biosystems, Newcastle upon Tyne, UK) kit.
To evaluate the MMR status, adjacent normal colon tissue served as an internal control for positive staining and a negative control staining was carried out without the primary antibody. Expression was reported as either MMR proficient (tumor cell nuclear expression with positive immune cell expression) or MMR deficient (tumor nuclear expression absent with normal immune cell expression).
An automated imaging software program (Image Pro Plus ver. 7.0, Media Cybernetics, Rockville, MD) was used to evaluate the percentage of each TILs subtype among the detected cells. The density of TILs was expressed by measuring the area occupied by mononuclear cells over the stromal area captured by NIS-Element F (ver. 4.30, Nikon, Tokyo, Japan) under ×400 magnification. Immunoreactivity was measured at two points: in the center of the tumor (TC) and in the IM (S1 Fig.). Spatial location of TC and IM was selected by the pathologist. The mean percentage of the three areas occupied by TILs in TC and IM per section was reported as the density of TILs.
4. Development of LASSO-derived prediction model in the training set
A total of 316 patients were allocated to the training and validation sets using computer-generated random sampling at a fixed ratio; 70% of the patients were assigned to the training set and the remaining 30% were assigned to the validation set.
Using clinicopathologic variables, including TILs information dichotomized into high and low subgroups according to the spatial distributions, LASSO regression was used to generate the predictive model in the training set. LASSO regression is known to be able to remove unimportant variables via the regression coefficients penalizing the size of the parameters. Applying the LASSO regression method, feature selection and predictive signature building was done. LASSO regression shrinks the coefficient estimates toward zero, with the degree of shrinkage dependent on an additional parameter, λ. To determine the optimal values for λ, a 10-time cross-validation was used, and we chose λ via the minimum criteria. The LASSO model was designed to predict the presence of LNM in patients with T1 CRC and is the linear predictor of the binary model built on the training set with selected variables via LASSO algorithm.
5. Validation of LASSO model using area under the receiver operating characteristic, net reclassification improvement, integrated discrimination improvement, and decision curve analysis in the validation set
The performance of the LASSO model, in comparison to Japanese criteria, was measured via area under the receiver operating characteristic (AUROC) analysis, net reclassification improvement (NRI), integrated discrimination improvement (IDI) calculation, and decision curve analysis (DCA) in the validation set. NRI quantifies the net proportion of patients with and without event of interest who are reclassified as higher and lower risk, respectively.
6. Statistical analysis
The clinicopathologic characteristics were analyzed using a variance test where appropriate. The chi-square test or Fisher exact test was used for comparison of categorical variables. Continuous variables were analyzed via Student t test or Mann-Whitney U test. The cutoff values for all immunohistochemical markers were determined at the maximum of Youden’s index and the maximum of accuracy. A univariable analysis was performed to calculate the odds ratio of the single variables in the logistic regression (LR) model after entering one of the variables under investigation. Univariable analysis denoted the association between LNM and the parameter through a 1:1 matching.
A two-sided p-value less than 0.05 was considered statistically significant. All statistical analyses were performed using SPSS software ver. 23.0 (IBM Corp., Armonk, NY) and R ver. 3.5.1 (R-project, Institute for Statistics and Mathematics, Vienna, Austria).
Results
1. Patient characteristics
Three hundred and sixteen patients were included in our analysis. Our initial cohort was categorized into 221 patients in the training set and the remaining 95 patients in the validation set. LNM was detected in 29 (13.1%) and 12 (12.6%) patients after a curative resection in the training and validation sets, respectively.
Table 1 demonstrates the characteristics of the training and the validation set. No significant differences were observed with respect to sex, age, tumor location, depth of invasion, LVI, tumor budding, BGA, LNM, and the rate of MMR between the two groups. In contrast, proportion of more than five of carcinoembryonic antigen (CEA); proportion of G2, G3, and mucinous type; and proportion of pedunculated morphology were significantly higher in the validation set (all p < 0.05).
2. Distribution of TILs and defining cut-off value of TILs in the training set
Distribution of TILs according to LNM based on the anatomical location are illustrated in S2 Fig. We found no significant difference in the mean numbers between the LNM status. Receiver operating characteristic curve analysis to predict LNM based on each TILs subtype’s densities and AUROC values are shown in S3 Fig. and S4 Table. Area under the curve (AUC) values are 0.55, 0.50, 0.50, 0.59, 0.52, and 0.53 in CD3_invasive margin (CD3_IM), CD3_tumor center (CD3_TC), CD8_invasive margin (CD8_IM), CD8_ tumor center (CD8_TC), FOXP3_invasive margin (FOXP3_IM), and FOXP3_tumor center (FOXP3_TC), respectively. We calculated the cut-off value of each TILs subtype using Youden’s index to be 11.3, 9.2, 28.2, 18.5, 15.1, and 20.3 in CD3_IM, CD3_TC, CD8_IM, CD8_TC, FOXP3_IM, and FOXP3_TC, respectively (S4 Table). Each TILs subtype was categorized as high or low according to these cutoff values.
3. Univariable analysis using clinicopathologic parameters and TILs for predicting LNM in the training set
There was no difference in incidence of LNM due to sex, age, CEA level, tumor location, depth of invasion, and gross morphology (pedunculated versus others). Mean depth of invasion did not differ according to LNM (2,947 μm in lymph node [LN]–positive group vs. 2,550 μm in LN-negative group, p=0.099). Among clinicopathologic parameters, histologic grade (grade 1 vs. grade 2, grade 3 and etc., p=0.040), LVI (positive vs. negative, p=0.001), tumor budding (presence vs. absence, p=0.003), and BGA (absence vs. presence, p=0.024) were associated with LNM in the training set. With respect to TILs, CD8 densities in TC dichotomized as 18.5 were identified as a significant parameter for predicting LNM in the training set (p=0.011) (Table 2).
4. Generating LASSO model to predict LNM in the training set
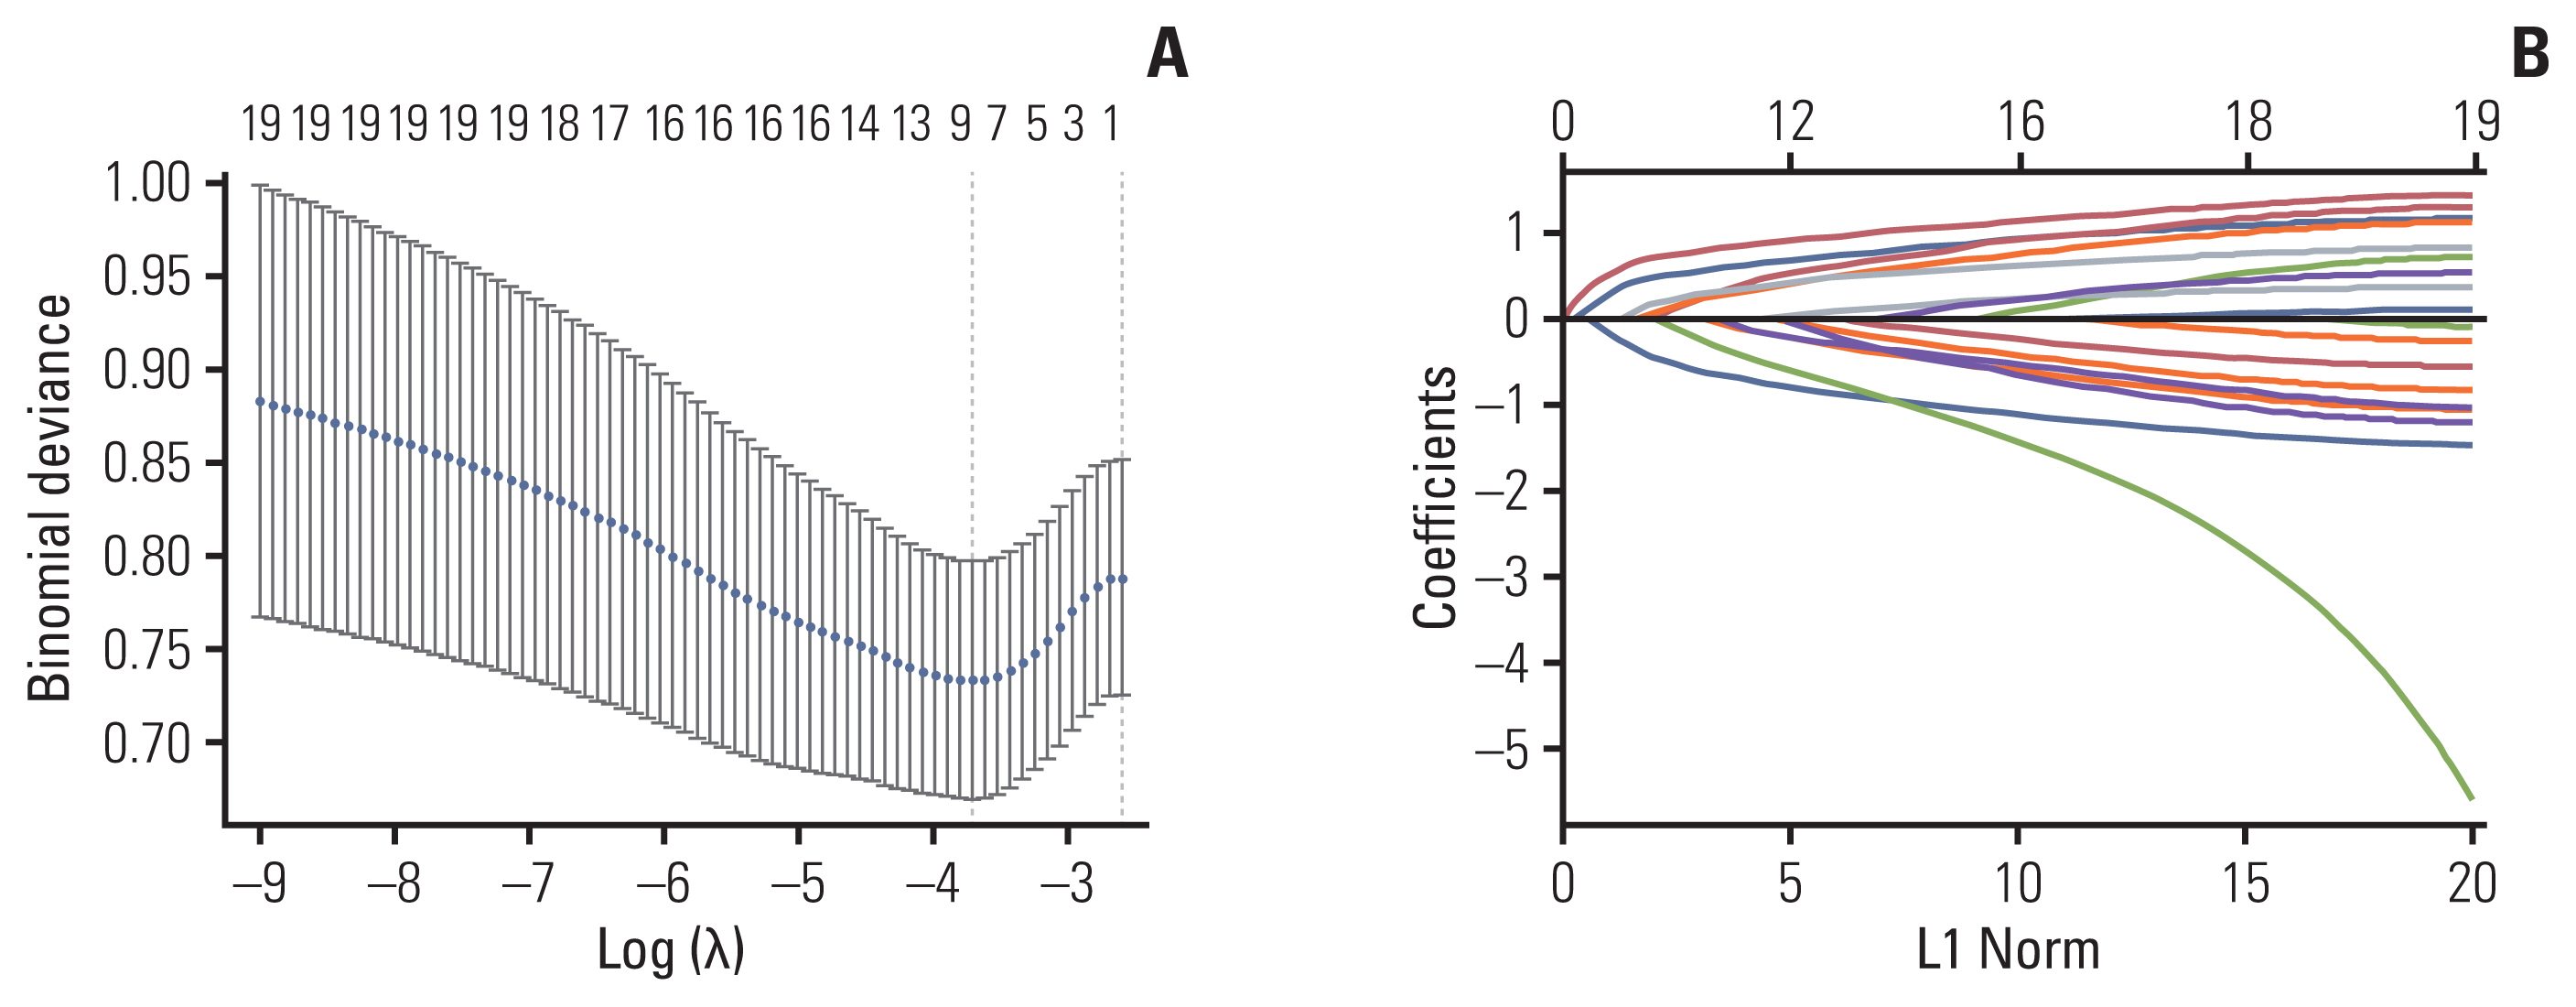
The binomial deviance curve was plotted versus log (λ), where λ is a tuning hyperparameter. Solid vertical lines represent binomial deviance±standard error (SE). The dotted vertical lines are drawn at optimal values by using the minimum criteria and 1-SE criteria. An optimal λ value was selected for the LASSO model by using 10-fold cross-validation via minimum criteria (Fig. 1A). A value of λ=0.02469015 with log (λ)=–3.701351 was chosen. A coefficient profile plot was produced against the log (λ) sequence (Fig. 1B). Training the optimized model with the training set resulted in nine non-zero coefficients for histology grade (grade 1 vs. others), LVI (absence vs. presence), tumor budding (absence vs. presence), BGA (presence vs. absence), CD3_IM (high vs. low), CD3_TC (high vs. low), CD8_IM (high vs. low), CD8_TC (high vs. low), and FOXP3_TC (high vs. low) with coefficients 0.28665580, 0.84002838, 0.60610111, 0.33894896, −0.07225639, 0.34769731, −0.35012378, −0.66414982, and −0.03525056, respectively. The linear predictor was defined as (–2.51312270)+histology grade (grade 1 vs. others)×(0.28665580)+LVI (absence vs. presence)×(0.84002838)+tumor budding (absence vs. presence)×(0.60610111)+BGA (presence vs. absence)×(0.3389–4896)+CD3_IM (high vs. low)×(–0.07225639)+CD3_TC (high vs. low)×(0.34769731)+CD8_IM (high vs. low)×(−0.35012378)+ CD8_TC (high vs. low)×(–0.66414982)+FOXP3_TC (high vs. low)×(–0.03525056).
5. Performance of the LASSO model in the validation set
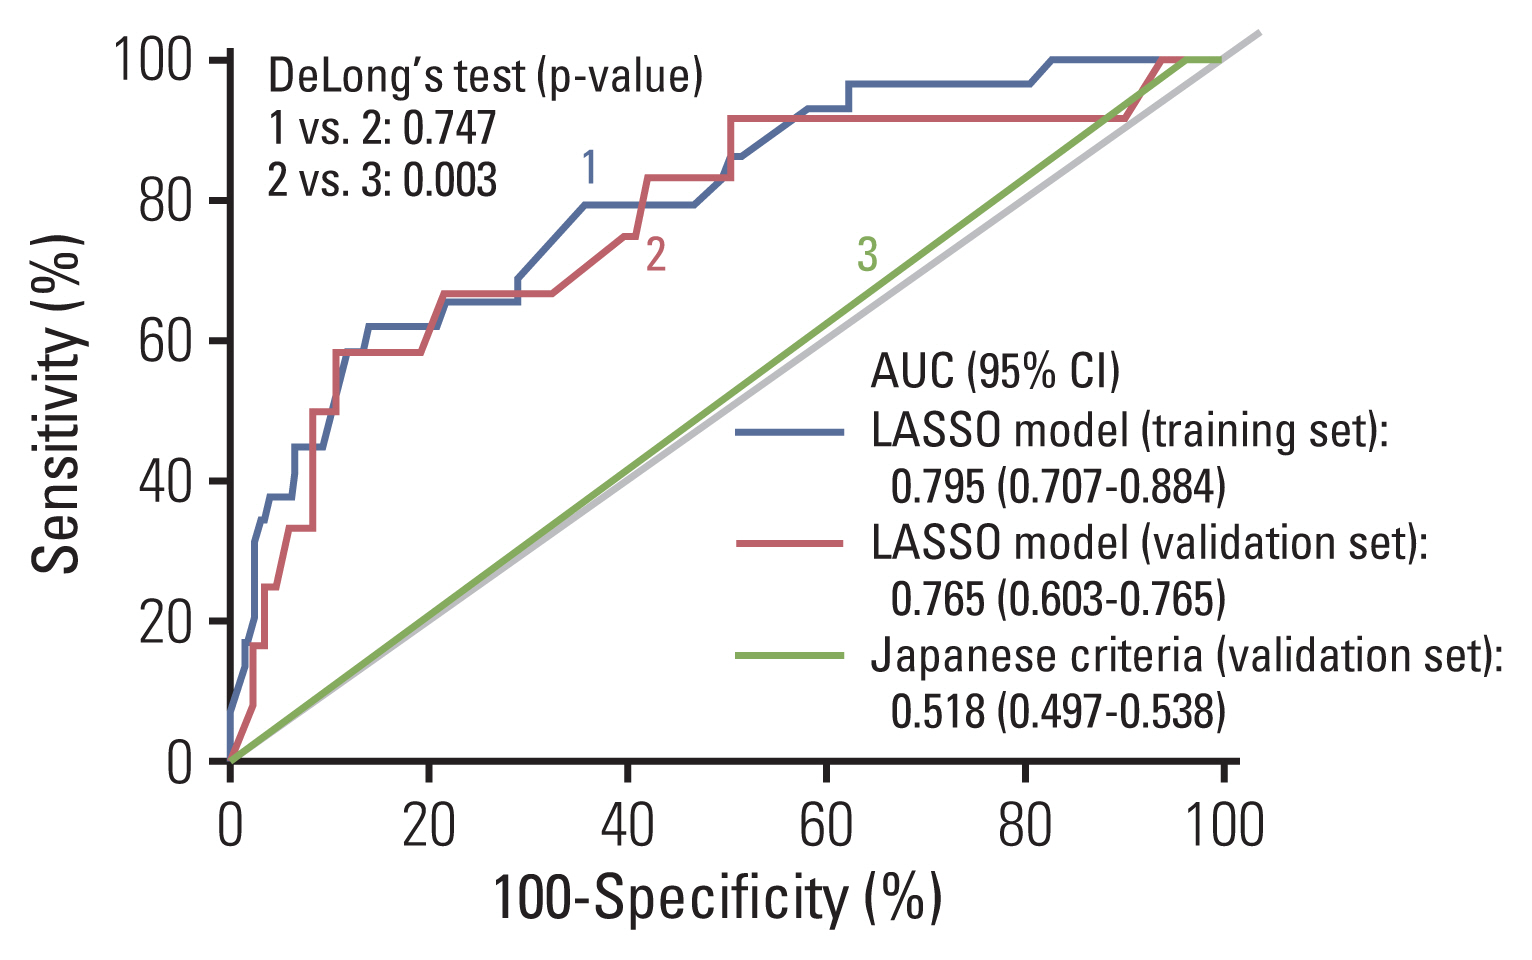
AUROC comparison of the LASSO model in the training and validation sets showed similar results. (AUROC, 0.795 vs. 0.765; p=0.747) (Fig. 2). In Japanese criteria, patients with either one of the following results were classified as positive for the surgery group (coded as 1) and other patients were denoted as negative for the surgery group (coded as 0): positive vertical resection margin, depth of submucosa invasion ≥ 1,000 μm, LVI positive, poorly differentiated adenocarcinoma, signet ring cell carcinoma, or mucinous carcinoma or grade 2/3 budding at the site of deepest invasion.
In the validation set, AUROC demonstrated better predictive accuracy of LASSO model compared to Japanese criteria (0.765 in the LASSO model vs. 0.518 in the Japanese criteria, p=0.003) (Fig. 2). In addition, the LASSO model showed significantly improved prediction for LNM compared to Japanese criteria, as measured by NRI (0.447, p=0.039) and IDI (0.121, p=0.034) (Table 3). DCA showed positive net benefit in using LASSO model in the training set and validation set, respectively (Fig. 3). Sensitivity, specificity, positive predictive value, and negative predictive value using the LASSO model at each cut-off point in overall set are illustrated in S5 Table.
Discussion
Previous studies investigating predictors of LNM in T1 CRC mainly focused on histopathologic parameters [4,22]. Although we expect the combination of pathologic risk factors could help in discriminating the risk of LNM in most patients with T1 CRC, more than 80% of the patients who were candidates for additional surgery were node-negative in final pathologic examinations. This study demonstrated that a machine learning–based algorithm that incorporated clinicopathologic parameters and TILs showed high predictive accuracy of LNM in T1 CRC and had superior discriminatory performance when compared with the conventional Japanese criteria.
Although prognostic value of the inflammatory cell reaction on survival in CRC has been thoroughly studied, the role of lymphocytic infiltration on LNM in early CRC has not been studied as extensively. A previous study considering peritumoral lymphocytic infiltration (PLI) as one of the candidates to predict LNM did not reveal any difference of PLI rate between the node-positive and node-negative groups. [20] Although statistically insignificant, the rate of PLI was conspicuous—at 8.3% in the node-positive group and 22.6% in the node-negative group (p=0.1). Considering the relatively low number of enrolled patients (n=111), the lack of association might be due to a type-II error [20]. Compared to the H&E slide–based evaluation of PLI in the previous study, we evaluated the role of IHC-stained TILs at different anatomical subsites, such as IM and TC. Univariable analysis demonstrated that lower densities of CD8+ T cells in TC were significantly correlated with higher rate of LNM in T1 CRC. In the equation that formed the linear predictor of LASSO model, the absolute value of CD8_TC (0.66414982) was larger than that of other IHC values. This result indicates that CD8_TC acted as one of the most obvious factors in predicting LNM, which was predictable from the results of univariable analysis.
A recent meta-analysis reported that the clinical significance of various TILs in CRC showed definite differences according to anatomical subsites [23]. High densities of CD3+ T cells indicated poor disease-free survival (DFS) in the invasive margin, whereas high densities of CD8+ T cells were a favorable prognosticator with respect to DFS in tumor center. Furthermore, several studies demonstrated that the significance of specific TILs according to spatial distribution might be different depending on the stage. One study revealed that both CD3+ T cells in both TC and IM are favorable prognosticators in stage III colon cancer, whereas another study observed the same trends only in stage II colon cancer but not in stage III colon cancer [16,17]. As far as we know, the clinical significance of spatial distribution of TILs as a predictor of LNM in T1 CRC has not been investigated sufficiently. When applying LR-based univariable or multivariable analysis, only CD8_TC would be left as an independent factor. In contrast, using LASSO model, we can estimate the relative role of each spatial TILs subtype using the coefficients imposed on respective variables. Along with CD8_TC, CD3_TC, and CD8_IM are thought to have a certain role in predicting LNM, although the direction of CD3_TC and CD8_IM would be different. Considering the different roles of each TILs subtype depending on the anatomical subsites or stages in non-metastatic CRC patients, it appears that our LASSO model is more reflective of the complex interactions of each TILs subtype. Further research is required to confirm our hypothesis.
Several recent studies have introduced machine learning algorithms for predicting LNM in T1 CRC [18,24,25]. It was reported that an artificial intelligence model using support vector machine (SVM) showed better discrimination than the LR-based model (AUC; 0.821 in SVM vs. 0.789 in LR, p=not stated) among 100 validation sets out of 690 T1 CRC patients [18]. The other study developed a random forest classifier–based prediction model using cytokeratin immunostaining images of resected whole slide images and reported similar predictive ability (AUC, p=0.1) and fewer false-negative cases compared to the LR-based clinical model [24]. However, one should bear in mind that the LR-based clinical models that were used to compare with the aforementioned machine learning algorithms (SVM and random forest classifier) were not the same as the Japanese criteria–based decision model. The risk assessment LR-based model generated in the prior two studies constructed prediction probabilities by combining each conventional histopathologic risk factor, whereas the Japanese criteria classified patients solely into “surgery” or “no surgery” subgroups without considering the imposed risk of each clinicopathologic variable. It is in this context that we developed a LASSO model and compared it with the Japanese criteria used in current clinical practice. The LASSO-based prediction model is a classifier that can accumulate relative risks of meaningful variables and maximize its predictive power. This fundamental characteristic might be one possible reason for the better diagnostic accuracy of the LASSO model. In a similar way, a recent Dutch T1 CRC working group demonstrated that a LASSO-derived prediction model (AUC, 0.83; 95% confidence interval [CI], 0.76 to 0.90) showed better AUC value than the conventional prediction models suggested by American Society for Gastrointestinal Endoscopy/European Society of Gastrointestinal Endoscopy (AUC, 0.67; 95% CI, 0.60 to 0.74; p=0.002) and JSCCR guidelines (AUC, 0.64; 95% CI, 0.58 to 0.70; p < 0.001), respectively, in 708 T1 pedunculated colorectal carcinoma [25].
Previously, the depth of invasion of T1 CRC was classified as SM1 (submucosa 1), SM2, and SM3, respectively [26]. The rate of LNM according to this definition was reported as 0%–3% in SM1, 8%–10% in SM2, and 23%–25% in SM3 [27,28], and SM3 was regarded as a strong indicator for an additional surgery. To clarify the depth of invasion using SM categories, the whole submucosa layer should be evaluated, which is not always possible after endoscopic treatment. In a large retrospective study, it was recommended that a 1,000 μm depth of invasion could be used as a cut-off value for predicting LNM [4]. In our study, however, there was no difference of LNM rate according to depth of invasion dichotomized as 1,000 μm and, therefore, depth of invasion was not selected as a parameter in the LASSO model. Although it is very difficult to explain why depth of invasion did not predict LNM in our cohort, there are several other studies that also reported no association between depth of invasion with LNM [8,22,29]. Selection bias might be one possible reason for this dissociation [29]. In addition, long-span retrospective studies undergoing histopathologic examinations by various pathologists inevitably showed some heterogeneities of dealing with pathologic slides. In our study, depth of invasion as well as other histopathologic parameters were re-evaluated for this study by one pathologist, which is a merit of this study. Large scale prospective studies are required to reveal the discrepancy of the role of depth of invasion on LNM in T1 CRC.
The main limitation of our study is that it was based on a single center, retrospective data collection. Our hospital is one of the largest referral centers in our nation, which skews cases toward more advanced stage patients. The accuracy of Japanese criteria measured by AUC in this study was around 0.52, which is approximately the same probability as tossing a coin. Such a situation would be very embarrassing given its firm status as a predictive model. Although this might reflect the real situation, some unmeasurable biases, such as inclusion of only patients who underwent surgeries, might have acted in reducing the overall performance. Nevertheless, it is impossible to identify the actual incidence of LNM among those patients who did not undergo surgeries, and such a situation would be the main dilemma in dealing with this issue. Also, IHC on paraffin sections might be semiquantitative although we applied image analyzer–based measurements. Artificial intelligence–guided whole slide image analysis has been actively adopted in medicine [17]. It would be an interesting issue that computer-aided detection could minimize the subjectivity of measuring TILs using pathologic manual estimation or image analyzer–based measurements [30]. Despite the internal validation, a larger prospective external validation is required before the LASSO model can be used as a clinical decision maker. It is expected that endoscopic resection will be performed more frequently as the incidence of early CRC increases. Therefore, it is considered to be very important clinically whether the predictive power can be increased through such TILs measurement and machine learning adoption in the specimen after endoscopic procedure. Our study has a limitation in that it cannot provide a direct answer to such a point because it is not a study using a tissue from endoscopic procedure. However, if the center and IM of the tumor can be identified pathologically even in specimens using endoscopic resection, the model developed by us can be used when the density of each location can be measured after IHC. Additional research is needed to confirm the possibility in practical application.
In conclusion, we developed a LASSO-based prediction model for predicting LNM in patients with T1 CRC, and it outperformed the current Japanese guidelines. This finding suggests that machine learning can potentially improve the accuracy of prediction, thereby minimizing unnecessary surgical resections. As the rate of CRCs detected early is growing, incidence of endoscopic treatments for early stage CRC may also be increasing. Evaluation of TILs after endoscopic treatments and application of a new prediction model might be beneficial in deciding for a subsequent radical surgery in T1 CRC.



 PDF Links
 PubReader
 ePub Link
 XML Download
 Full text via DOI
 Download Citation
  Supplement1
 Print
Print