Skip Navigation
Skip to contents

Cancer Res Treat : Cancer Research and Treatment

OPEN ACCESS

Articles

Page Path
HOME > Cancer Res Treat > Volume 54(2); 2022 > Article
Original Article
Gastrointestinal cancer
Machine Learning Model for Predicting Postoperative Survival of Patients with Colorectal Cancer
Mohamed Hosny Osman1, Reham Hosny Mohamed1, Hossam Mohamed Sarhan2, Eun Jung Park3, Seung Hyuk Baik3, Kang Young Lee4, Jeonghyun Kang3
Cancer Research and Treatment : Official Journal of Korean Cancer Association 2022;54(2):517-524.
DOI: https://doi.org/10.4143/crt.2021.206
Published online: June 15, 2021

1Faculty of Medicine, Zagazig University, Zagazig, Egypt

2Faculty of Pharmacy, British University in Egypt (BUE), El Shorouk, Egypt

3Department of Surgery, Gangnam Severance Hospital, Yonsei University College of Medicine, Seoul, Korea

4Department of Surgery, Severance Hospital, Yonsei University College of Medicine, Seoul, Korea

Correspondence: Jeonghyun Kang, Department of Surgery, Gangnam Severance Hospital, Yonsei University College of Medicine, 211 Eonju-ro, Gangnam-gu, Seoul 06273, Korea,
Tel: 82-2-2019-3372, Fax: 82-2-3462-5994, E-mail: ravic@naver.com
• Received: February 10, 2021   • Accepted: June 13, 2021

Copyright © 2022 by the Korean Cancer Association

This is an Open-Access article distributed under the terms of the Creative Commons Attribution Non-Commercial License (http://creativecommons.org/licenses/by-nc/4.0/) which permits unrestricted non-commercial use, distribution, and reproduction in any medium, provided the original work is properly cited.

  • 9,611 Views
  • 333 Download
  • 13 Web of Science
  • 16 Crossref
  • 17 Scopus
prev next
  • Purpose
    Machine learning (ML) is a strong candidate for making accurate predictions, as we can use large amount of data with powerful computational algorithms. We developed a ML based model to predict survival of patients with colorectal cancer (CRC) using data from two independent datasets.
  • Materials and Methods
    A total of 364,316 and 1,572 CRC patients were included from the Surveillance, Epidemiology, and End Results (SEER) and a Korean dataset, respectively. As SEER combines data from 18 cancer registries, internal validation was done using 18-Fold-Cross-Validation then external validation was performed by testing the trained model on the Korean dataset. Performance was evaluated using area under the receiver operating characteristic curve (AUROC), sensitivity and positive predictive values.
  • Results
    Clinicopathological characteristics were significantly different between the two datasets and the SEER showed a significant lower 5-year survival rate compared to the Korean dataset (60.1% vs. 75.3%, p < 0.001). The ML-based model using the Light gradient boosting algorithm achieved a better performance in predicting 5-year-survival compared to American Joint Committee on Cancer stage (AUROC, 0.804 vs. 0.736; p < 0.001). The most important features which influenced model performance were age, number of examined lymph nodes, and tumor size. Sensitivity and positive predictive values of predicting 5-year-survival for classes including dead or alive were reported as 68.14%, 77.51% and 49.88%, 88.1% respectively in the validation set. Survival probability can be checked using the web-based survival predictor (http://colorectalcancer.pythonanywhere.com).
  • Conclusion
    ML-based model achieved a much better performance compared to staging in individualized estimation of survival of patients with CRC.
Colorectal cancer (CRC) is one of the most common causes of mortality worldwide [1,2]. CRC treatment is based on multimodal approaches that are composed of surgery, chemotherapy, and radiation therapies [3]. When patients are diagnosed with CRC, treatment strategies are decided by clinical staging, which is based on radiologic examinations. In case of stage IV patients with unresectable metastases, chemotherapy is usually followed, whereas surgery is the preferred initial approach in patients with resectable tumors and postoperative pathologic stage is a single most important determinant to decide further adjuvant therapy. American Joint Committee on Cancer (AJCC) stage is an independent predictor for distinguishing patients based on survival outcomes and has been used as a standard treatment guideline, as it is easy to implement in clinical practice [4]. However, previous studies demonstrated that sometimes there is a difference in survival between patients even who have the same characters such as stage. In CRC, it hasn’t always been clear the prognostic difference between stage II and stage III [5,6]. Molecular, pathologic and radiologic biomarkers have been suggested as alternative parameters for more detailed stratification of survival [79]. Nevertheless, there are still difficulties in incorporating these biomarkers in clinical decision-making due to time and cost consuming characteristics.
Machine learning (ML) has been exploited in different areas of clinical research [6,10,11]. Nevertheless, there are several gaps that still need to be investigated. Lack of high-quality datasets for algorithm training and development and proper validation are regarded as major drawbacks in addition to lack of randomized controlled trials comparing newly developed algorithms to current clinical practices [10]. ML techniques have been introduced as useful tools to predict mortality in different diseases, but its clinical usefulness has not been widely studied with proper external validation in patients with CRC [12].
In this study, we developed a survival prediction ML-based model using data from The Surveillance, Epidemiology, and End Results (SEER) Database of the National Cancer Institute [13]. Moreover, we externally validated the model using an independent dataset of: Gangnam Severance Hospital, Yonsei University College of Medicine (Korean) dataset.
1. Data collection and patient characteristics
This is a retrospective study. The SEER database of the National Cancer Institute collects cancer incidence and survival data from 18 cancer registries, encompassing approximately 27.8% of the United States population [13]. SEER-Stat software (ver. 8.3.5) was used to identify patients diagnosed between 2004 and 2015. Since tumor characteristics such as tumor size, extension, and metastasis at diagnosis were started to be recorded in SEER registry after 2004, data collected before 2004 wasn’t included. Patients with CRC diagnosed and treated from 2003 and 2012 in Gangnam Severance Hospital, Yonsei University College of Medicine (Seoul, Republic of Korea) were included in the present study and allocated as a Korean dataset. All procedures performed in studies involving human participants were in accordance with the ethical standards of the institutional and/or national research committee and with the 1964 Helsinki declaration and its later amendments or comparable ethical standards.
Patients aged over 18 years old with primary CRC who underwent surgery were identified by defining the primary tumor location to include: C18.0-Cecum, C18.2-Ascending colon, C18.3-Hepatic flexure of colon, C18.4-Transverse colon, C18.5-Splenic flexure of colon, C18.6-Descending colon, C18.7-Sigmoid colon, C18.8-Overlapping lesion of colon, C18.9-Colon, NOS, C19.9-Rectosigmoid junction, C20.9-Rectum, NOS. Patients with unknown age or unknown survival months were excluded.
Patient characteristics were extracted including age at diagnosis in years, sex, tumor location, histology, grade, AJCC stage, tumor size in millimeters, number of examined lymph nodes (LN), number of positive LNs, radiation, chemotherapy, and carcinoembryonic antigen level.
In order not to lose cases with missing data, missing values were imputed using the most frequent for categorical variables and mean for continuous variables when training these algorithms: logistic regression, decision tree and, random forest. Light gradient boosting (LightGBM) didn’t need this as it can handle missing data internally. To shrink the range of continuous data with wide ranges (age and tumor size), age in years was converted into age in century (age in years/100) and tumor size in mm was converted to (tumor size in mm/100). To evaluate survival probability at different time intervals, only cases that had been adequately followed up for this time period were included. Then, survival months were binarized to either cases that survived or cases that hadn’t survived this period of time.
2. Selection of proper machine learning algorithms
Different machine learning algorithms were trained on part of the SEER registry called the “training set” then the trained model is tested on the remaining data called the “testing set” to predict outcome and then the prediction performance is evaluated. Tested algorithms included: Logistic Regression, Decision Tree, Random Forest, and LightGBM [14]. All used models were trained, tuned, and tested using the same methods (S1 Fig.).
3. Internal and external validation of machine learning algorithm
For hyperparameter tuning, Bayesian optimization was chosen which uses the information collected at each iteration for performing the next one. It provides better optimization performance than other methods such as random search and grid search (S2 Fig.) [15].
In terms of internal validation using the SEER dataset, an internal cross-validation approach using 18-fold-cross-validation was chosen for evaluating performance. Since the SEER dataset collects data from 18 cancer registries, dataset is partitioned into 18 splits; a split for each registry. One split is used as the testing set and the others are combined to form the training set in which each algorithm is trained with hyperparameter tuning. This procedure is conducted repeatedly, with each of the split being used once as the test set, to generate 18 models. Then the performance of the 18 corresponding results is averaged to evaluate model performance [16]. In terms of external validation, the algorithm was trained on the SEER registry then validated on the Korean dataset.
To assess model performance, different metrics were calculated including area under the receiver operating characteristic curve (AUROC) and accuracy at each survival period. Also, positive predictive value, sensitivity, and F1 score for each class were calculated. AUROC is a performance index that is independent of any particular threshold and its values range between 0.5 and 1.0, with 0.5 indicating random chance and 1.0 indicates perfect classification [17].
4. Web-based survival prediction
We developed survival prediction web-based application on the result of this work. The web-based survival predictor (http://colorectalcancer.pythonanywhere.com) was deployed using Flask (ver. 1.0). This site is a web-based program freely available online.
5. Statistical analysis
Differences in the distribution of categorical variables were compared using the chi-square test. Non-parametric Mann-Whitney was used to compare the differences between continuous variable [18]. Univariate survival analysis was estimated using the Kaplan-Meier method and log-rank test was used to compare survival of different subgroups. Significant differences between the two AUROC curves were calculated using the method of Hanley and McNeil [17].
Most of the analyses were performed using Python 3.7. Data preprocessing was done using pandas 0.24. Bayesian optimization was performed using scikit-optimize package. Machine learning algorithms were trained and tested using Scikit-learn 0.20 library except LightGBM in which LightGBM 2.2 package was used. Survival analysis was done using lifelines 0.22. Chi-square test and Mann-Whitney tests were calculated using SPSS software ver. 20.0 (IBM Corp., Armonk, NY). A two-sided p < 0.05 was considered statistically significant.
The number of identified patients was 364,316 in the SEER registry and 1,572 in the Korean dataset with median age at diagnosis of 68 and 62 years, respectively. Among 12 variables included in this study, all parameters except histology showed significant difference between the SEER and the Korean datasets (Table 1).
There were about 0%–48% and 0.1%–7.4% of missing values in the SEER and the Korean dataset respectively. Missing rate was different according to the respective variables between the two datasets (S3 Fig.). The SEER showed significantly lower overall survival rate than that of the Korean dataset (Fig. 1, S4 Table). When comparing survival of each stage respectively, the SEER had lower overall survival rate compared to the Korean dataset in all stages (all p < 0.05) (S5 Fig.). Kaplan-Meier analysis showed significant differences between subgroup of each features in both the SEER and Korean datasets (S6 Fig.).
In order to find the highest-performing algorithm, they were trained and tested on SEER dataset to predict survival using 5-fold-cross-validation. The differences in performance between the four algorithms (logistic regression, Decision Tree, Random Forest, and LightGBM) was small in terms of AUROC with a maximum difference of 2.1% (S7 Table). The difference between LightGBM and logistic regression which is commonly used in statistics ranged from 1.3% to 1.5%. A previous study comparing different algorithms revealed LightGBM as the best among other algorithms in terms of accuracy, precision, and AUROC [19]. Taking these into consideration, LightGBM was used as the algorithm of choice for creating the model and for the internal and external validation.
To evaluate the prognostic value of each feature alone, a univariate modeling in the SEER registry was constructed in which each feature alone is used to predict survival at different time periods. When evaluating each feature using internal validation, age at diagnosis had the highest performance when predicting 1-year survival with AUROC of 0.689 (95% confidential interval [CI], 0.673 to 0.705). When predicting all other survival periods, stage had the highest AUROC among all other features with 0.696 (95% CI, 0.683 to 0.709) and 0.667 (95% CI, 0.652 to 0.682) for 5- and 10-year survival, respectively (S8 Table). In external validation using the Korean dataset, stage had the highest prediction performance in all survival periods with AUROC of 0.751 for 1-year survival and 0.702 for 10-year surival (S9 Table).
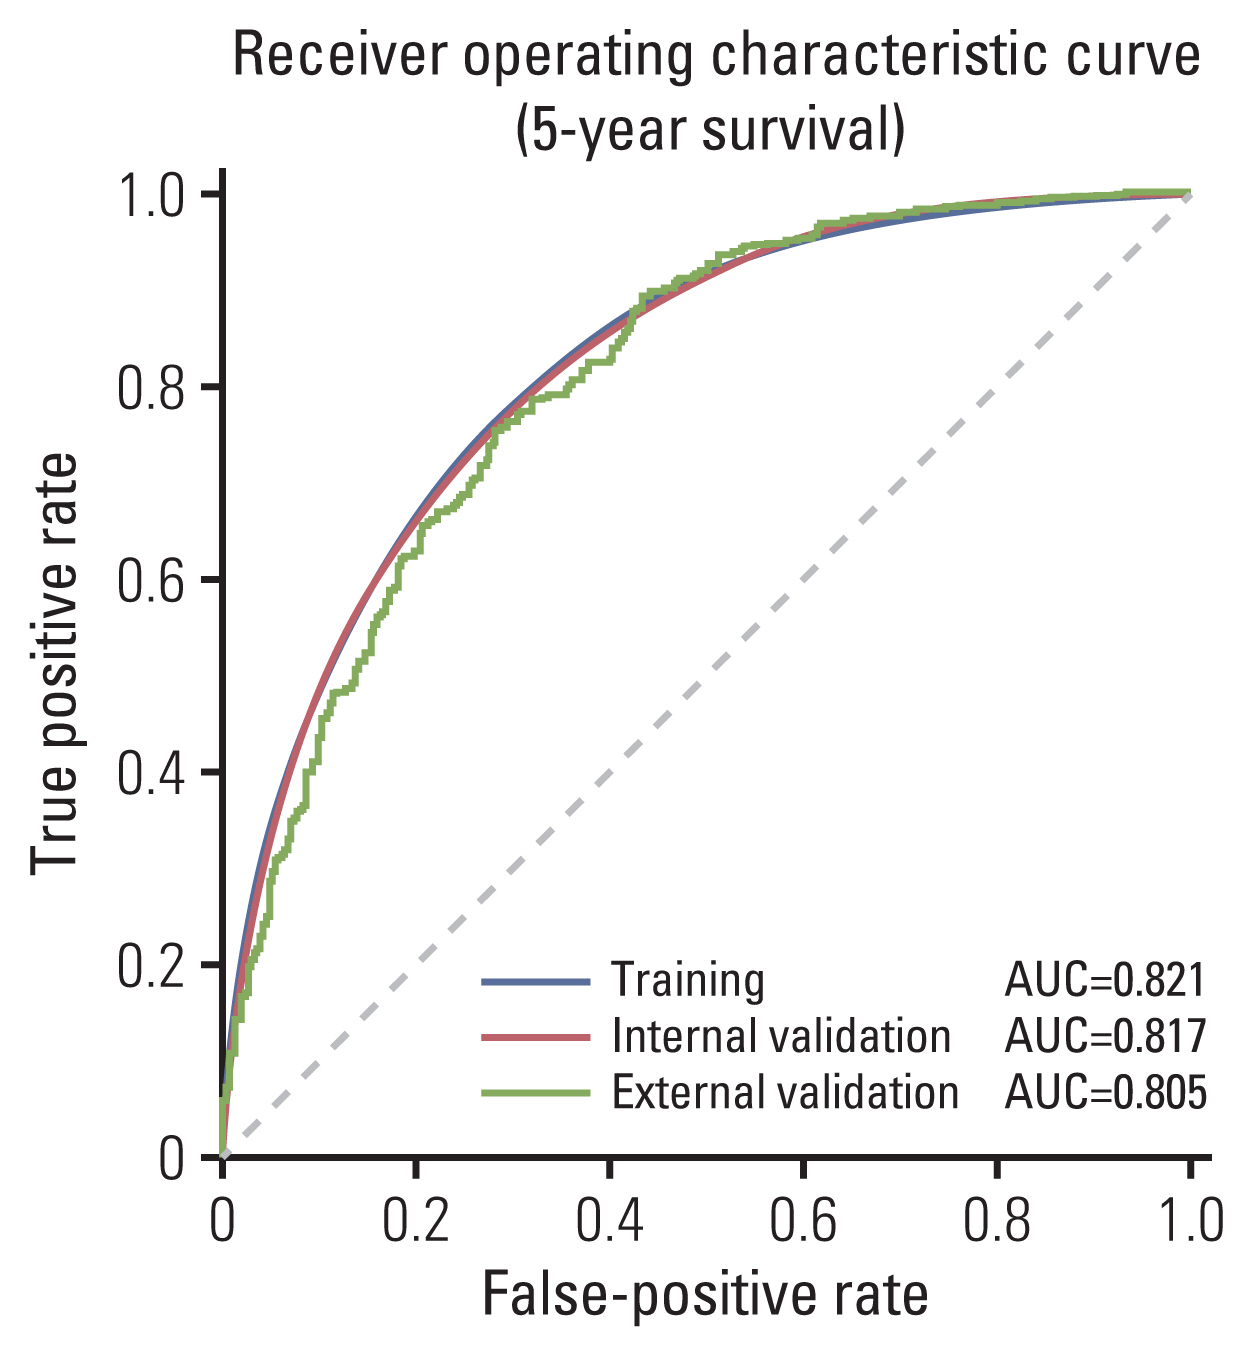
In terms of internal validation, the model achieved average AUROC of 0.817 (95% CI, 0.803 to 0.831) and 0.828 (95% CI, 0.816 to 0.840) for predicting 5- and 10-year survival respectively. The average accuracy of predicting 1-year survival and 5-year survival was 0.763 (95% CI, 0.734 to 0.792) and 0.744 (95% CI, 0.728 to 0.760), respectively. In terms of external validation, the model trained on the SEER registry and validated on the Korean dataset achieved AUROC of 0.825 and 0.804 and accuracy of 0.800 and 0.750 when predicting 1 and 5-year survival respectively (Table 2, Fig. 2). Aside from 2-year survival in which AUROC of external validation was higher than internal validation (0.824 vs. 0.836), the difference in performance between internal and external validation in terms of AUROC ranged from 0.71% to 5.1% and was the highest in 10-year survival and the lowest in 1-year survival (Table 2).
The most important features which influenced model performance in predicting survival were age at diagnosis, the number of examined LNs, and tumor size (Fig. 3).
The model showed a significant higher performance in predicting survival compared to the stage with p < 0.05 in all time periods. Especially, in predicting 5-year survival, the model achieved better AUROC than the stage (0.804 vs. 0.736, p < 0.001) (Table 3).
The model was able to maintain a good class balance when predicting 5-year-survival with sensitivity for both classes such as dead or alive of 69.28% and 77.78% in internal validation and 68.14% and 77.51% in external validation (S10 Table). Positive predictive value for both classes were 67.0% and 79.67% in internal validation and 49.88% and 88.1% in external validation when predicting 5-year-survival (S10 Table).
Our study demonstrated that ML-based model using LightGBM developed using clinical data from SEER database can produce robust predictive model of survival in patients with CRC, and that this model was shown to outperform significantly the current gold standard in the form of AJCC stage. Thus, we believe that ML model have the potential to significantly improve individualized estimation of survival.
A previous study demonstrated that machine-learned Bayesian belief network accurately estimated overall survival with AUROC of 0.85 in colon cancer patients based on clinical data from 146,248 patients from the SEER registry [12]. However, these models were validated using only internal cross-validation, without independent external validation. It is an important issue to demonstrate generalizability of ML model. In our study, the two cohort used for development and validation of algorithm showed markedly differences in terms of ethnicity, clinicopathological variables and especially overall survival rates. Although we cannot explain the exact reason of survival gap, the fact that Korean dataset was derived from a tertiary referral center specialized for treatment of patients with CRC could be one of the reasons. However, the reason might be multifactorial, and differences in mortality by race are also seen in data analyzed within the United States, that mortality rate of CRC from 2013 to 2017 were 19.0%, 13.8%, and 9.5% for non-Hispanic black, non-Hispanic white and Asian/Pacific Islander, respectively [20]. In general, huge difference for survival outcomes can be a disadvantage when comparing two groups in a conventional clinical study. In contrast, a consistent performance of our new ML model when applying to datasets with such different baseline characteristics could be an evidence of the robustness and generalizability of our model.
Analysis using large scale clinical dataset has been regarded as a good way to reduce a selection bias. Nevertheless, a lot of missing data can occur in reporting and collecting systems based databases. In our analysis, the SEER registry had a higher percentage of missing values in different features. If we wanted to undergo conventional linear regression based multivariable analysis, these missing values had better be omitted before entering into a statistical analysis. Excluding cases with missing data would reduce included number of patients and could be an important source of selection bias. On the other hand, there are different methods for imputing missing values in order not to lose valuable information [21].
In terms of feature importance, age, number of examined LNs, and tumor size were the most important prognostic features for survival prediction than the AJCC stage. It is undeniable that several reports have proven that age, and examined number of LNs are meaningful as prognostic predictors in CRC [22,23]. With respect to tumor size, although a recent study demonstrated that tumor size had a high prognostic value of survival in T1 colon cancer, this discriminatory power did not last with more advanced T stages [24], and tumor size wasn’t found to be a significant factor to predict survival outcomes in other studies [25,26]. Although it is impossible to rule out the possibility that these three variables play certain roles in predicting survival outcomes in patients with CRC, the evidence published to date does not support the use of these parameters in the AJCC stage or current clinical practice [3,4]. Interestingly, the LightGBM didn’t consider stage as one of the most important factors when it comes to feature importance despite the stage showed higher AUROC values in the univariate analysis depicted in S8 and S9 Tables compared to other variables. One of the distinguishing characteristics of ML or artificial intelligence approaches is that we cannot inspect or explain how the algorithm works [10].
Several limitations should be acknowledged as this study is retrospective and selection bias cannot be completely avoided. We included 12 elementary clinicopathological variables to develop and validate a new ML model. Clinical significance of lymphovascular invasion, perineural invasion, or circumferential resection margin status in colon and rectal cancer respectively have been investigated already in various studies [2628]. However, we couldn’t include those information in our prediction model as they weren’t reported in the SEER database. Moreover, many researchers tried to incorporate radiologic and molecular information in estimating survival outcomes [29,30]. Incorporating these additional features could improve performance of predictive models which should be investigated in the future. On the other hand, technical requirements when it comes to genomic and transcriptomic data demand additional cost and time. In this regard, our model had its own clinical benefit because of using only relatively easy-to-get clinicopathological data. Moreover, including more than 360,000 patients along with an external validation using a different registry and using Bayesian optimization when tuning parameters can build a robust model. Also, a web-based prediction platform was developed to provide easy access to help patients and physicians to benefit from this model in clinical practice.
In conclusion, a ML-based prediction model was developed for predicting survival of CRC patient. The model achieved a significant better performance that the AJCC stage. Clinical usefulness of further detailed stratification should be evaluated using data from prospective studies.
Supplementary materials are available at Cancer Research and Treatment website (https://www.e-crt.org).

Ethical Statement

This study was approved by the institutional review board of Gangnam Severance Hospital, Yonsei University College of Medicine (Seoul, Republic of Korea) (Approval number: 3-2020-0018). The need to obtain informed consent was waived for this retrospective study.

Author Contributions

Conceived and designed the analysis: Osman MH, Kang J.

Collected the data: Mohamed RH, Sarhan HM, Park EJ, Baik SH, Lee KY, Kang J.

Contributed data or analysis tools: Mohamed RH, Lee KY, Kang J.

Performed the analysis: Osman MH, Kang J.

Wrote the paper: Osman MH, Kang J.

Conflict of interest

Conflict of interest relevant to this article was not reported.

Fig. 1
Comparison of 5-year overall survival between Surveillance, Epidemiology, and End Results (SEER) dataset and Korean dataset.
crt-2021-206f1.jpg
Fig. 2
Comparison of receiver operating characteristic curve using 5-year survival in the training, internal validation and external validation. AUC, area under the curve.
crt-2021-206f2.jpg
Fig. 3
Feature importance selection in respective survival time periods. CEA, carcinoembryonic antigen; LN, lymph node.
crt-2021-206f3.jpg
Table 1
Characteristics of included patients
SEER dataset (n=364,316) Korean dataset (n=1,572) p-value
Years of diagnosis 2004–2015 2003–2012
Last follow up date 2016 2019
Age (yr) 67.0±13.7 61.6±11.9 < 0.001
Sex
 Male 188,549 (51.8) 965 (61.4) < 0.001
 Female 175,767 (48.2) 607 (38.6)
Tumor location
 Colon 264,288 (72.5) 939 (59.7) < 0.001
 Rectum 100,028 (27.5) 618 (39.3)
 Missing 15 (1.0)
Histology
 Adenocarcinoma 326,628 (89.7) 1,383 (88.0) 0.308
 Other histology 37,688 (10.3) 146 (9.3)
 Missing 43 (2.7)
Stage
 Stage I 90,647 (24.9) 318 (20.2) < 0.001
 Stage II 96,337 (26.4) 443 (28.2)
 Stage III 100,478 (27.6) 535 (34.0)
 Stage IV 44,161 (12.1) 180 (11.5)
 Missing 32,693 (9.0) 96 (6.1)
Gradea)
 Grade I 34,608 (9.5) 237 (15.1) < 0.001
 Grade II 230,595 (63.3) 1,101 (70.0)
 Grade III 56,079 (15.4) 45 (2.9)
 Grade IV 8,150 (2.2) 73 (4.6)
 Missing 34,884 (9.6) 116 (7.4)
Tumor size (mm) 44.9±34.4 43.8±23.4 < 0.001
No. of examined LNs 15.0±11.0 21.0±17.9 < 0.001
 < 12 127,245 (35.4) 397 (25.4) < 0.001
 ≥ 12 226,543 (63.1) 1,167 (74.5)
 Unknown 5,218 (1.5) 2 (0.1)
No. of positive LNs 1.6±3.6 1.8±4.0 < 0.001
CEAb)
 Low 109,429 (30.0) 987 (62.8) < 0.001
 High 80,015 (22.0) 507 (32.3)
 Missing 174,872 (48.0) 78 (5.0)
Radiation
 Yes 43,087 (11.8) 280 (17.8) < 0.001
 No/Unknown 321,229 (88.2) 1,292 (82.2)
Chemotherapy
 Yes 124,894 (34.3) 983 (62.5) < 0.001
 No/Unknown 239,422 (65.7) 589 (37.5)

Values are presented as mean±SD or number (%). CEA, carcinoembryonic Antigen; LN, lymph node; SD, standard deviation; SEER, Surveillance, Epidemiology, and End Results.

a) Histologic grade: G1, well differentiated; G2, moderately differentiated; G3, poorly differentiated; G4, undifferentiated,

b) High: CEA ≥ 5, low: CEA < 5.

Table 2
Comparing AUROC and accuracy of light gradient boosting algorithm with Bayesian optimization using SEER dataset and Korean dataset
Survival periods Internal validation using 18-fold CV on SEER dataset External validation using Korean dataset


Accuracy (average±SD) AUC (average±SD) Accuracy AUC
1 76.33±2.89 83.26±1.46 80.08 82.55

2 75.63±1.89 82.45±1.12 78.16 83.62

3 75.37±1.79 81.98±1.17 77.69 81.02

4 74.87±1.42 81.83±1.22 76.41 80.52

5 74.45±1.56 81.71±1.36 75.20 80.46

6 74.08±1.28 81.59±1.17 74.57 78.75

8 73.99±1.59 81.91±1.42 73.67 78.76

10 74.26±1.41 82.82±1.20 74.21 77.72

AUC, area under ther curve; AUROC, area under the receiver operating characteristics; CV, cross validation; SD, standard deviation; SEER, Surveillance, Epidemiology, and End Results.

Table 3
Comparing area under the receiver operating characteristics between light gradient boosting algorithm with Bayesian optimization and AJCC staging using validation Korean dataset
Survival periods AJCC stage LGB algorithm p-value
1 75.13 82.55 0.002
2 76.66 83.62 < 0.001
3 75.14 81.02 < 0.001
4 75.15 80.52 0.001
5 73.67 80.46 < 0.001
6 72.46 78.75 0.001
8 71.54 78.76 0.002
10 70.28 77.72 0.017

AJCC, American Joint Committee on Cancer; LGB algorithm, light gradient boosting algorithm.

  • 1. Siegel RL, Miller KD, Jemal A. Cancer statistics, 2019. CA Cancer J Clin. 2019;69:7–34. ArticlePubMed
  • 2. Jung KW, Won YJ, Kong HJ, Lee ES. Cancer statistics in Korea: incidence, mortality, survival, and prevalence in 2016. Cancer Res Treat. 2019;51:417–30. ArticlePubMedPMC
  • 3. NCCN guidelines [Internet]. Plymouth Meeting, PA: National Comprehensive Cancer Network; 2019. [cited 2020 Mar 3]. Available from: https://www.nccn.org/professionals/physician_gls/default.aspx
  • 4. Edge SB, Compton CC. The American Joint Committee on Cancer: the 7th edition of the AJCC cancer staging manual and the future of TNM. Ann Surg Oncol. 2010;17:1471–4. ArticlePubMed
  • 5. Li J, Guo BC, Sun LR, Wang JW, Fu XH, Zhang SZ, et al. TNM staging of colorectal cancer should be reconsidered by T stage weighting. World J Gastroenterol. 2014;20:5104–12. ArticlePubMedPMC
  • 6. Skrede OJ, De Raedt S, Kleppe A, Hveem TS, Liestol K, Maddison J, et al. Deep learning for prediction of colorectal cancer outcome: a discovery and validation study. Lancet. 2020;395:350–60. ArticlePubMed
  • 7. Zhang JX, Song W, Chen ZH, Wei JH, Liao YJ, Lei J, et al. Prognostic and predictive value of a microRNA signature in stage II colon cancer: a microRNA expression analysis. Lancet Oncol. 2013;14:1295–306. ArticlePubMed
  • 8. Haruki K, Kosumi K, Li P, Arima K, Vayrynen JP, Lau MC, et al. An integrated analysis of lymphocytic reaction, tumour molecular characteristics and patient survival in colorectal cancer. Br J Cancer. 2020;122:1367–77. ArticlePubMedPMC
  • 9. Dercle L, Lu L, Schwartz LH, Qian M, Tejpar S, Eggleton P, et al. Radiomics response signature for identification of metastatic colorectal cancer sensitive to therapies targeting EGFR pathway. J Natl Cancer Inst. 2020;112:902–12. ArticlePubMedPMC
  • 10. Le Berre C, Sandborn WJ, Aridhi S, Devignes MD, Fournier L, Smail-Tabbone M, et al. Application of artificial intelligence to gastroenterology and hepatology. Gastroenterology. 2020;158:76–94. ArticlePubMed
  • 11. Reichling C, Taieb J, Derangere V, Klopfenstein Q, Le Malicot K, Gornet JM, et al. Artificial intelligence-guided tissue analysis combined with immune infiltrate assessment predicts stage III colon cancer outcomes in PETACC08 study. Gut. 2020;69:681–90. ArticlePubMed
  • 12. Stojadinovic A, Bilchik A, Smith D, Eberhardt JS, Ward EB, Nissan A, et al. Clinical decision support and individualized prediction of survival in colon cancer: Bayesian belief network model. Ann Surg Oncol. 2013;20:161–74. ArticlePubMed
  • 13. SEER Cancer Statistics Review, 1975–2016 [Internet]. Bethesda, MD: National Cancer Institute; 2019. [cited 2021 Jul 8]. Available from: https://seer.cancer.gov/csr/1975_2016/
  • 14. Deist TM, Dankers F, Valdes G, Wijsman R, Hsu IC, Oberije C, et al. Machine learning algorithms for outcome prediction in (chemo)radiotherapy: an empirical comparison of classifiers. Med Phys. 2018;45:3449–59. ArticlePubMedPMC
  • 15. Czarnecki WM, Podlewska S, Bojarski AJ. Robust optimization of SVM hyperparameters in the classification of bioactive compounds. J Cheminform. 2015;7:38.ArticlePubMedPMC
  • 16. Steyerberg EW, Harrell FE Jr. Prediction models need appropriate internal, internal-external, and external validation. J Clin Epidemiol. 2016;69:245–7. ArticlePubMed
  • 17. Hanley JA, McNeil BJ. The meaning and use of the area under a receiver operating characteristic (ROC) curve. Radiology. 1982;143:29–36. ArticlePubMed
  • 18. Elsebaie MA, Amgad M, Elkashash A, Elgebaly AS, Ashal G, Shash E, et al. Management of low and intermediate risk adult rhabdomyosarcoma: a pooled survival analysis of 553 patients. Sci Rep. 2018;8:9337.ArticlePubMedPMC
  • 19. Lei L, Wang Y, Xue Q, Tong J, Zhou CM, Yang JJ. A comparative study of machine learning algorithms for predicting acute kidney injury after liver cancer resection. PeerJ. 2020;8:e8583.ArticlePubMedPMC
  • 20. Siegel RL, Miller KD, Goding Sauer A, Fedewa SA, Butterly LF, Anderson JC, et al. Colorectal cancer statistics, 2020. CA Cancer J Clin. 2020;70:145–64. ArticlePubMed
  • 21. Schwender H. Imputing missing genotypes with weighted k nearest neighbors. J Toxicol Environ Health A. 2012;75:438–46. ArticlePubMed
  • 22. Chang GJ, Rodriguez-Bigas MA, Skibber JM, Moyer VA. Lymph node evaluation and survival after curative resection of colon cancer: systematic review. J Natl Cancer Inst. 2007;99:433–41. ArticlePubMed
  • 23. Kelder W, Inberg B, Schaapveld M, Karrenbeld A, Grond J, Wiggers T, et al. Impact of the number of histologically exa-mined lymph nodes on prognosis in colon cancer: a population-based study in the Netherlands. Dis Colon Rectum. 2009;52:260–7. PubMed
  • 24. Dai W, Mo S, Xiang W, Han L, Li Q, Wang R, et al. The critical role of tumor size in predicting prognosis for T1 colon cancer. Oncologist. 2020;25:244–51. ArticlePubMed
  • 25. Cha YJ, Park EJ, Baik SH, Lee KY, Kang J. Clinical significance of tumor-infiltrating lymphocytes and neutrophil-to-lymphocyte ratio in patients with stage III colon cancer who underwent surgery followed by FOLFOX chemotherapy. Sci Rep. 2019;9:11617.ArticlePubMedPMC
  • 26. Kang J, Kim H, Hur H, Min BS, Baik SH, Lee KY, et al. Circumferential resection margin involvement in stage III rectal cancer patients treated with curative resection followed by chemoradiotherapy: a surrogate marker for local recurrence? Yonsei Med J. 2013;54:131–8. ArticlePubMed
  • 27. Hwang MR, Park JW, Park S, Yoon H, Kim DY, Chang HJ, et al. Prognostic impact of circumferential resection margin in rectal cancer treated with preoperative chemoradiotherapy. Ann Surg Oncol. 2014;21:1345–51. ArticlePubMed
  • 28. Lee JM, Chung T, Kim KM, Simon NS, Han YD, Cho MS, et al. Significance of radial margin in patients undergoing complete mesocolic excision for colon cancer. Dis Colon Rectum. 2020;63:488–96. ArticlePubMed
  • 29. Badic B, Hatt M, Durand S, Jossic-Corcos CL, Simon B, Visvikis D, et al. Radiogenomics-based cancer prognosis in colorectal cancer. Sci Rep. 2019;9:9743.ArticlePubMedPMC
  • 30. Dienstmann R, Vermeulen L, Guinney J, Kopetz S, Tejpar S, Tabernero J. Consensus molecular subtypes and the evolution of precision medicine in colorectal cancer. Nat Rev Cancer. 2017;17:79–92. ArticlePubMed

Figure & Data

REFERENCES

    Citations

    Citations to this article as recorded by  
    • Development and validation of a biomarker-based prediction model for metastasis in patients with colorectal cancer: Application of machine learning algorithms
      Erfan Ayubi, Sajjad Farashi, Leili Tapak, Saeid Afshar
      Heliyon.2025; 11(1): e41443.     CrossRef
    • Predicting Factors Affecting Survival Rate in Patients Undergoing On‐Pump Coronary Artery Bypass Graft Surgery Using Machine Learning Methods: A Systematic Review
      Alireza Jafarkhani, Behzad Imani, Soheila Saeedi, Amir Shams
      Health Science Reports.2025;[Epub]     CrossRef
    • Externally validated and clinically useful machine learning algorithms to support patient-related decision-making in oncology: a scoping review
      Catarina Sousa Santos, Mário Amorim-Lopes
      BMC Medical Research Methodology.2025;[Epub]     CrossRef
    • New perspectives on cancer clinical research in the era of big data and machine learning
      Shujun Li, Hang Yi, Qihao Leng, You Wu, Yousheng Mao
      Surgical Oncology.2024; 52: 102009.     CrossRef
    • SAGL: A self-attention-based graph learning framework for predicting survival of colorectal cancer patients
      Ping Yang, Hang Qiu, Xulin Yang, Liya Wang, Xiaodong Wang
      Computer Methods and Programs in Biomedicine.2024; 249: 108159.     CrossRef
    • The development and validation of automated machine learning models for predicting lymph node metastasis in Siewert type II T1 adenocarcinoma of the esophagogastric junction
      Chenghao Lu, Lu Liu, Minyue Yin, Jiaxi Lin, Shiqi Zhu, Jingwen Gao, Shuting Qu, Guoting Xu, Lihe Liu, Jinzhou Zhu, Chunfang Xu
      Frontiers in Medicine.2024;[Epub]     CrossRef
    • Machine learning for predicting colon cancer recurrence
      Erkan Kayikcioglu, Arif Hakan Onder, Burcu Bacak, Tekin Ahmet Serel
      Surgical Oncology.2024; 54: 102079.     CrossRef
    • Precision prognosis of colorectal cancer: a multi-tiered model integrating microsatellite instability genes and clinical parameters
      Yonghong Wang, Ke Liu, Wanbin He, Jie Dan, Mingjie Zhu, Lei Chen, Wenjie Zhou, Ming Li, Jiangpeng Li
      Frontiers in Oncology.2024;[Epub]     CrossRef
    • Light gradient boost tree classifier predictions on appendicitis with periodontal disease from biochemical and clinical parameters
      Pradeep Kumar Yadalam, Prathiksha Vedhavalli Thirukkumaran, Prabhu Manickam Natarajan, Carlos M. Ardila
      Frontiers in Oral Health.2024;[Epub]     CrossRef
    • Enhanced prediction of preoperative mesenteric lymph node metastasis in colorectal cancer using machine learning with CT‐based data
      Lanni Zhou, Lizhu Ouyang, Baoliang Guo, Xiyi Huang, Shaomin Yang, Jialing Pan, Liwen Wang, Ming Chen, Fan Xie, Yunjing Li, Yongxing Du, Xinjie Chen, Qiugen Hu, Fusheng Ouyang
      MedComm – Future Medicine.2024;[Epub]     CrossRef
    • An interactive web-based tool for predicting and exploring brain cancer survivability
      Gopal Nath, Austin Coursey, Yang Li, Srikanth Prabhu, Harish Garg, Shaymal C. Halder, Saptarshi Sengupta
      Healthcare Analytics.2023; 3: 100132.     CrossRef
    • Statistical and machine learning approaches to predict the necessity for computed tomography in children with mild traumatic brain injury
      Tadashi Miyagawa, Marina Saga, Minami Sasaki, Miyuki Shimizu, Akira Yamaura, Alvan Ukachukwu
      PLOS ONE.2023; 18(1): e0278562.     CrossRef
    • Machine learning for prediction of in-hospital mortality in lung cancer patients admitted to intensive care unit
      Tianzhi Huang, Dejin Le, Lili Yuan, Shoujia Xu, Xiulan Peng, Samuele Ceruti
      PLOS ONE.2023; 18(1): e0280606.     CrossRef
    • Application of Artificial Intelligence in Gastrointestinal Cancer
      洪铭 崔
      Advances in Clinical Medicine.2023; 13(03): 3942.     CrossRef
    • Clinicopathologic and prognostic factors of patients with T3/T4 colorectal signet ring cell carcinoma: a population-based study
      Fan Zhang, Boqi Xu, Yao Peng, Zhongqi Mao
      Journal of Cancer Research and Clinical Oncology.2023; 149(12): 9747.     CrossRef
    • Using machine learning algorithms to predict 28-day mortality in critically ill elderly patients with colorectal cancer
      Chunxia Guo, Jun Pan, Shan Tian, Yuanjun Gao
      Journal of International Medical Research.2023;[Epub]     CrossRef

    • PubReader PubReader
    • ePub LinkePub Link
    • Cite
      CITE
      export Copy Download
      Close
      Download Citation
      Download a citation file in RIS format that can be imported by all major citation management software, including EndNote, ProCite, RefWorks, and Reference Manager.

      Format:
      • RIS — For EndNote, ProCite, RefWorks, and most other reference management software
      • BibTeX — For JabRef, BibDesk, and other BibTeX-specific software
      Include:
      • Citation for the content below
      Machine Learning Model for Predicting Postoperative Survival of Patients with Colorectal Cancer
      Cancer Res Treat. 2022;54(2):517-524.   Published online June 15, 2021
      Close
    • XML DownloadXML Download
    Machine Learning Model for Predicting Postoperative Survival of Patients with Colorectal Cancer
    Image Image Image
    Fig. 1 Comparison of 5-year overall survival between Surveillance, Epidemiology, and End Results (SEER) dataset and Korean dataset.
    Fig. 2 Comparison of receiver operating characteristic curve using 5-year survival in the training, internal validation and external validation. AUC, area under the curve.
    Fig. 3 Feature importance selection in respective survival time periods. CEA, carcinoembryonic antigen; LN, lymph node.
    Machine Learning Model for Predicting Postoperative Survival of Patients with Colorectal Cancer

    Characteristics of included patients

    SEER dataset (n=364,316) Korean dataset (n=1,572) p-value
    Years of diagnosis 2004–2015 2003–2012
    Last follow up date 2016 2019
    Age (yr) 67.0±13.7 61.6±11.9 < 0.001
    Sex
     Male 188,549 (51.8) 965 (61.4) < 0.001
     Female 175,767 (48.2) 607 (38.6)
    Tumor location
     Colon 264,288 (72.5) 939 (59.7) < 0.001
     Rectum 100,028 (27.5) 618 (39.3)
     Missing 15 (1.0)
    Histology
     Adenocarcinoma 326,628 (89.7) 1,383 (88.0) 0.308
     Other histology 37,688 (10.3) 146 (9.3)
     Missing 43 (2.7)
    Stage
     Stage I 90,647 (24.9) 318 (20.2) < 0.001
     Stage II 96,337 (26.4) 443 (28.2)
     Stage III 100,478 (27.6) 535 (34.0)
     Stage IV 44,161 (12.1) 180 (11.5)
     Missing 32,693 (9.0) 96 (6.1)
    Gradea)
     Grade I 34,608 (9.5) 237 (15.1) < 0.001
     Grade II 230,595 (63.3) 1,101 (70.0)
     Grade III 56,079 (15.4) 45 (2.9)
     Grade IV 8,150 (2.2) 73 (4.6)
     Missing 34,884 (9.6) 116 (7.4)
    Tumor size (mm) 44.9±34.4 43.8±23.4 < 0.001
    No. of examined LNs 15.0±11.0 21.0±17.9 < 0.001
     < 12 127,245 (35.4) 397 (25.4) < 0.001
     ≥ 12 226,543 (63.1) 1,167 (74.5)
     Unknown 5,218 (1.5) 2 (0.1)
    No. of positive LNs 1.6±3.6 1.8±4.0 < 0.001
    CEAb)
     Low 109,429 (30.0) 987 (62.8) < 0.001
     High 80,015 (22.0) 507 (32.3)
     Missing 174,872 (48.0) 78 (5.0)
    Radiation
     Yes 43,087 (11.8) 280 (17.8) < 0.001
     No/Unknown 321,229 (88.2) 1,292 (82.2)
    Chemotherapy
     Yes 124,894 (34.3) 983 (62.5) < 0.001
     No/Unknown 239,422 (65.7) 589 (37.5)

    Values are presented as mean±SD or number (%). CEA, carcinoembryonic Antigen; LN, lymph node; SD, standard deviation; SEER, Surveillance, Epidemiology, and End Results.

    a)Histologic grade: G1, well differentiated; G2, moderately differentiated; G3, poorly differentiated; G4, undifferentiated,

    b)High: CEA ≥ 5, low: CEA < 5.

    Comparing AUROC and accuracy of light gradient boosting algorithm with Bayesian optimization using SEER dataset and Korean dataset

    Survival periods Internal validation using 18-fold CV on SEER dataset External validation using Korean dataset


    Accuracy (average±SD) AUC (average±SD) Accuracy AUC
    1 76.33±2.89 83.26±1.46 80.08 82.55

    2 75.63±1.89 82.45±1.12 78.16 83.62

    3 75.37±1.79 81.98±1.17 77.69 81.02

    4 74.87±1.42 81.83±1.22 76.41 80.52

    5 74.45±1.56 81.71±1.36 75.20 80.46

    6 74.08±1.28 81.59±1.17 74.57 78.75

    8 73.99±1.59 81.91±1.42 73.67 78.76

    10 74.26±1.41 82.82±1.20 74.21 77.72

    AUC, area under ther curve; AUROC, area under the receiver operating characteristics; CV, cross validation; SD, standard deviation; SEER, Surveillance, Epidemiology, and End Results.

    Comparing area under the receiver operating characteristics between light gradient boosting algorithm with Bayesian optimization and AJCC staging using validation Korean dataset

    Survival periods AJCC stage LGB algorithm p-value
    1 75.13 82.55 0.002
    2 76.66 83.62 < 0.001
    3 75.14 81.02 < 0.001
    4 75.15 80.52 0.001
    5 73.67 80.46 < 0.001
    6 72.46 78.75 0.001
    8 71.54 78.76 0.002
    10 70.28 77.72 0.017

    AJCC, American Joint Committee on Cancer; LGB algorithm, light gradient boosting algorithm.

    Table 1 Characteristics of included patients

    Values are presented as mean±SD or number (%). CEA, carcinoembryonic Antigen; LN, lymph node; SD, standard deviation; SEER, Surveillance, Epidemiology, and End Results.

    Histologic grade: G1, well differentiated; G2, moderately differentiated; G3, poorly differentiated; G4, undifferentiated,

    High: CEA ≥ 5, low: CEA < 5.

    Table 2 Comparing AUROC and accuracy of light gradient boosting algorithm with Bayesian optimization using SEER dataset and Korean dataset

    AUC, area under ther curve; AUROC, area under the receiver operating characteristics; CV, cross validation; SD, standard deviation; SEER, Surveillance, Epidemiology, and End Results.

    Table 3 Comparing area under the receiver operating characteristics between light gradient boosting algorithm with Bayesian optimization and AJCC staging using validation Korean dataset

    AJCC, American Joint Committee on Cancer; LGB algorithm, light gradient boosting algorithm.


    Cancer Res Treat : Cancer Research and Treatment
    Close layer
    TOP