Introduction
Although the global incidence of early-onset colorectal cancer (EoCRC) is increasing [1], its associated risk factors need further verification [2]. Both late-onset CRC (LoCRC) and EoCRC share similar risk factors, such as metabolic syndrome and prolonged sedentary behavior [1]. However, there is a lack of research on whether these conventional risk factors actually have a greater effect on EoCRC than on LoCRC. With the worldwide increase in obesity and dyslipidemia rates, especially in younger generations, revealing the connections between these risk factors and coincident EoCRC is essential to reducing the incidence of EoCRC.
Triglyceride (TG), a sensitive surrogate marker of obesity, is an important link between obesity and EoCRC. Hypertriglyceridemia (HTG), the hallmark of dyslipidemia in obesity, leads to metabolic syndrome by inducing insulin resistance [3]. Although high TG levels are associated with increased cardiovascular risk [4], and active prospective trials to lower TG levels have been conducted, the importance of HTG in EoCRC has not been considered in depth. Previous studies on TG and CRC mostly focused on CRC at all ages [5], and their results were inconsistent due to cross-sectional or casecontrol designs, short follow-up durations, limited sample size, and lack of confounding factor adjustments [5-7].
South Korea has confronted EoCRC at a rapid pace in recent decades. According to cancer registration data covering the period between 2008 and 2012 for 42 countries, South Korea had the highest occurrence of colorectal cancer at an earlier age [8]. We conducted a large nationwide population-based cohort study in South Korea to identify a direct association between TG levels and EoCRC. The secondary aim was to evaluate whether the HTG-associated risk of EoCRC differs according to tumor subsites and serum TG levels.
Materials and Methods
1. Study design
This was a retrospective study of data collected from the National Healthcare Insurance Service (NHIS) of South Korean young adults (20-49 years old) who underwent health check-ups between 2009 and 2011. Based on serum TG status, we tracked these participants until 2019 to observe whether they newly developed CRCs before age 50.
2. Data source
The Ministry of Health and Welfare of the Republic of Korea manages the NHIS. The NHIS has provided free health examinations at least biennially to all the employee-insured subscribers aged ≥ 20 years. The checkup program data included demographic information, socioeconomic status, anthropometric measurements, health-related questionnaires, and laboratory tests.
3. Study population
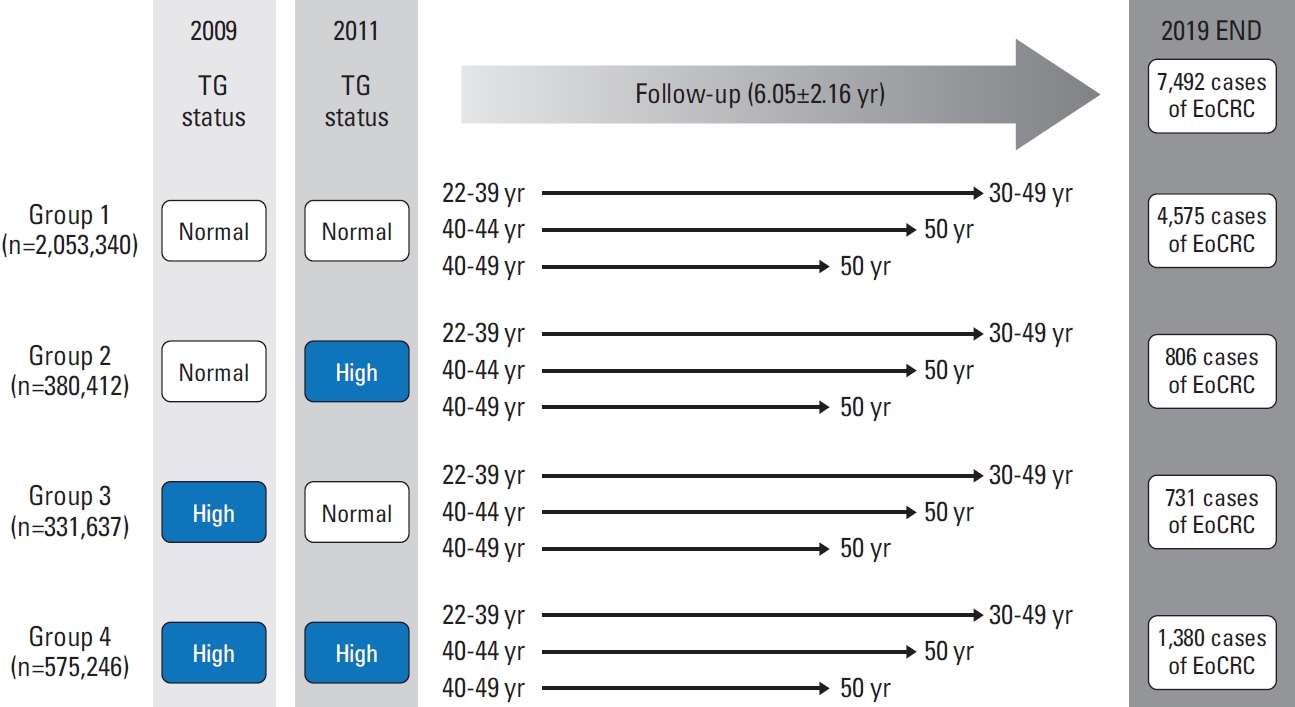
The entire enrollment process for the study cohort is shown in Fig. 1. We initially included 10,628,070 Korean citizens who had undergone health checkups in 2009. In total, 6,902,420 individuals underwent health checkups between 2009 and 2011. When we excluded participants aged > 50 years in 2011 (the index year for enrollment), the remaining population was 3,600,560. We excluded 221,944 participants with incomplete health check-up data. In total, 35,223 participants who were previously diagnosed with malignancy before 2011 were excluded. To avoid including people with pre-existing CRC, 2,758 individuals who developed CRC after 1 year of enrollment in 2011 were excluded. Finally, 3,340,635 participants were included in the analysis and followed up until 2019. Fig. 2 shows the follow-up process for each participant according to TG status. When the participants reached age 50, they were censored from the main analysis.
4. Data collection
Anthropometric measurements included height, weight, waist circumference (WC), and blood pressure. Laboratory tests included serum fasting glucose (FBS), total cholesterol (TC), TG, high-density lipoprotein cholesterol (HDL-C), and low-density lipoprotein cholesterol (LDL-C). Blood tests were performed after an overnight fasting for at least 8 hours. Standardized self-reported questionnaires were used to evaluate health behaviors, including demographic information (age, sex, and income status), smoking status, alcohol consumption, and regular exercise. The NHIS claims data were used to identify comorbidities (hypertension [HTN], diabetes mellitus [DM], and anti-dyslipidemia medications).
5. Definitions of HTG and other covariates
We defined HTG as fasting serum TG level ≥ 150 mg/dL, according to a scientific statement from the American Heart Association [9]. The 1st exam was conducted in 2009. The 2nd exam was conducted in 2011. Our index date was 2011, and all baseline characteristics and covariates were based on the index year. We divided the enrolled participants into four groups based on TG status in 2009 and 2011: the “persistent normotriglyceridemia (NTG)” group (serum TG < 150 mg/dL at both the 1st and the 2nd exams, group (1), “NTG to HTG” group (serum TG < 150 mg/dL at the 1st exam and TG ≥ 150 mg/dL at the 2nd exam, group (2) and “HTG to NTG” group (serum TG ≥ 150 mg/dL at the 1st exam and TG < 150 mg/dL at the 2nd exam, group (3) “persistent HTG” group (serum TG ≥ 150 mg/dL at both the 1st and 2nd exams, group (4) [10]. We hypothesized that group 3 would result in a decreased risk of EoCRC compared to group 4, while group 4 would result in an increased risk compared to group 1. Based on TG levels derived from 2011, we stratified TG levels into quartiles (Q1: < 71 mg/dL, Q2: 71-104 mg/dL, Q3: 105-160 mg/dL, Q4: ≥ 161 mg/dL). To minimize confounding by sex, subgroup analyses were performed by applying sex-specific TG quartile cut-off values (male Q1: < 71 mg/dL, Q2: 71-104 mg/dL, Q3: 105-160 mg/dL, Q4: ≥ 161 mg/dL; female Q1: < 56 mg/dL, Q2: 57-76 mg/dL, Q3: 77-107 mg/dL, Q4: ≥ 108 mg/dL). Individuals were classified as current smokers if they responded as smokers in the survey conducted in 2011. We categorized alcohol consumption as either none or heavy drinkers who consumed > 30 g of alcohol per day. Regular exercise was defined as moderate-intensity physical activity for more than 5 days per week or vigorous exercise for more than 3 days per week. Income levels were classified into four groups according to income quartiles. The first quartile (Q1) was a group that received medical aid and was included in the bottom 25% of income. Since the definition of obesity varies by ethnicity and our study focuses on South Koreans, we followed the American Association of Clinical Endocrinologists/American College of Endocrinology comprehensive clinical practice guidelines and defined a body mass index (BMI) ≥ 25 kg/m2 as obese [11]. The presence of abdominal obesity was defined as a WC ≥ 90 cm for males and ≥ 85 cm for females [12]. Comorbidities were defined using ICD-10-CM (International Statistical Classification of Diseases and Related Health Problems, Tenth Revision Clinical Modification) codes because all diagnoses and prescription codes are gathered according to ICD-10-CM codes by the NHIS. DM was defined based on codes E11-14 with antidiabetic medications or FBS levels above 126 mg/dL. HTN was defined based on ICD-10-CM codes I10-13 and I15 with antihypertensive medications or blood pressure ≥ 140/90 mmHg. Anti-dyslipidemia medications were defined as claims for prescriptions of dyslipidemia medications, including statin, ezetimibe, and fibrate.
6. Study outcomes
The primary outcome was the incidence of newly diagnosed EoCRC after the second health examination in 2011, during the follow-up period until 2019. EoCRC was defined according to the ICD-10-CM codes. Each specific code is as follows: C18.0-18.4 for proximal colon cancer; C18.5-18.7, C19.0 for distal colon cancer; and C20.0 for rectal cancer. The secondary outcome was the incidence of EoCRC according to tumor subsites.
7. Statistical analysis
Continuous variables are presented as mean±standard deviation, and categorical variables as numbers and percentages. An independent t-test or analysis of variance (ANOVA) was used to compare continuous variables. The chi-square test was used to analyze categorical variables. The incidence of EoCRC was calculated as the number of events per 1000 person-years. We used multivariable Cox proportional hazards regression models to calculate the hazard ratios and the corresponding 95% confidence intervals (CIs). Adjustments for covariates were performed for sex, age, smoking status, alcohol consumption, regular exercise, low income, obesity, WC, DM, HTN, and anti-dyslipidemia medications. Model 1 was unadjusted; Model 2 was adjusted for sex and age; Model 3 was adjusted for sex, age, smoking status, alcohol consumption, regular exercise, and low-income status; Model 4 was adjusted for sex, age, smoking status, alcohol consumption, regular exercise, low-income status, obesity (BMI ≥ 25 kg/m2), DM, HTN, and anti-dyslipidemia medications. Model 4* was adjusted for age, smoking status, alcohol consumption, regular exercise, low-income status, WC, DM, and HTN. To present the cumulative events of EoCRC according to TG status, Kaplan-Meier curves were used and compared using the log-rank test. We performed subgroup analysis using covariates to evaluate the effect of TG status change on the incidence of EoCRC. An interaction p analysis for each covariate subgroup was performed. Furthermore, to evaluate the effect of stratified TG levels on the incidence of EoCRC, we performed subgroup analysis with stratified TG levels. Two-sided p-values < 0.05 were considered statistically significant. All statistical analyses were performed using SAS ver. 9.3 (SAS Institute Inc., Cary, NC) and R ver. 3.2.3 (The R Foundation for Statistical Computing, Vienna, Austria).
Results
1. Baseline characteristics of the study population
The baseline characteristics of the enrolled participants are shown in Table 1, S1 and S2 Tables. Of the 3,340,635 eligible study participants, 2,053,340, 380,412, 331,637, and 575,246 individuals were classified as groups 1, 2, 3, and 4, respectively. Group 1 participants had healthier indices: the lowest percentage of smokers (23.83%), drinkers (5.78%), obesity (20.50%), DM (1.98%), HTN (8.40%), and anti-dyslipidemia medications (1.50%). However, regarding socioeconomic status, group 1 had the highest percentage of participants in the lowest income quartile (14.53%). The prevalence of LDLC above 130 mg/dL and 160 mg/dL was highest in group 3 (36.62% and 11.12%, respectively). In group 4, the proportion of males was high (91.33%). Poorer health indices were mainly observed in group 4; the proportion of smokers (52.04%), drinkers (15.54%), and obese participants (58.34%) was higher in group 4 than in the other three groups; the highest proportion of the participants taking medication for DM (9.14%), HTN (23.32%), and dyslipidemia (7.16%) was observed in group 4; individuals in group 4 had the highest levels of body weight, BMI, WC, serum FBS and TC; and the proportion of low HDL-C was the lowest in group 4.
2. EoCRC risk according to the change in TG status by anatomic sites
Of the 3,340,635 participants, 7,492 EoCRC cases were reported during a mean follow-up of 6.05 years (Fig. 2, S1 Table). Kaplan-Meier curve showed that EoCRC risk was the highest in group 4 (Fig. 3). When the Kaplan-Meier analyses were conducted with stratification based on the tumor location, groups 3 and 4 had the higher risk for rectum and proximal colon cancers while group 1 showed an increased risk for overall colon and unspecified colon cancers (S3-S7 Figs.). In Cox regression analysis (Table 2), group 4 had the highest risk of the overall EoCRC development (model 4: aHR [95% CI], 1.097 [1.025 to 1.174]); the risk of rectal cancer was increased in both groups 3 and 4 (model 4: 1.236 [1.076 to 1.419] and 1.175 [1.042 to 1.325], respectively). However, there were no significant results in proximal, distal, and unspecified colon cancers in the models adjusted for confounding variables. Even after excluding patients taking lipid-lowering agents in 2009 or 2011, group 4 had the highest risk of EoCRC development (aHR [95% CI], 1.094 [1.019 to 1.174]); the risk of rectal cancer increased in both groups 3 and 4 after adjusting for confounding variables (1.203 [1.042 to 1.389] and 1.172 [1.036 to 1.327], respectively) (S8 Table). Thus, no significant difference in the risk of EoCRC development was noted regardless of the exclusion of the participants taking anti-dyslipidemic medications. Also, after additionally adjusting for WC instead of obesity (BMI ≥ 25 kg/m2) in model 4 (model 4*), the results were not substantially different (S9 Table). In contrast, there were no significant results according to the change in TG status in proximal, distal, and unspecified colon cancers (Table 2).
3. EoCRC risk according to TG quartiles by anatomic sites
Table 3 shows the association between serum TG levels derived from 2011 and the risk of developing EoCRC at different anatomical sites. Higher serum TG levels are associated with a higher risk of developing EoCRC. Under four-level stratification with TG status (Q1: < 71 mg/dL, Q2: 71-104 mg/dL, Q3: 105-160 mg/dL, Q4: ≥ 161 mg/dL), individuals in the higher TG quartile showed an increased risk for EoCRC compared with those in the lower TG quartile groups. After adjusting for confounding variables, individuals with the highest TG status (belonging to the Q4 group) had a 14.5% increased risk of EoCRC (1.145 [1.064 to 1.233]) compared with the reference Q1 group (p for trend=0.0002). In terms of tumor site, participants in the highest TG quartile (Q4) showed the highest risk of EoCRC for colon and distal colon cancers (1.144 [1.048 to 1.248] and 1.224 [1.020 to 1.469], respectively). When applying different criteria for TG quartiles depending on sex or performing analyses stratified by sex, individuals in the groups of the higher TG quartiles showed an increased risk for EoCRC (S10-S12 Tables).
4. EoCRC risk according to the change in TG status by subgroups
Table 4 presents subgroup analysis according to sex, age, smoking status, alcohol consumption, regular exercise, low income, obesity, DM, HTN, and anti-dyslipidemia medications. The participants were censored from the analysis if the incidence of CRC was above age 50. The adjusted hazard ratios and p for interaction were calculated for each subgroup to evaluate the effect of persistent HTG on the risk of EoCRC. The risks of EoCRC were higher in group 4 participants who were male, 30-39 years old, non-smokers, non-drinkers, non-regular exercisers, had low-income status, non-obese, without abdominal obesity, with DM, with HTN, and without anti-dyslipidemia medications. With the age-censored data, the association between the change in TG status and EoCRC risk was not significant according to the above-mentioned clinical factors (Table 4, all subgroups, pinteraction > 0.05).
By analyzing the subgroups with non-age-censored data, we found that the association between the change in TG status and the risk of EoCRC differed between males and females with DM (pinteraction=0.025 and 0.013, respectively) (S13 Table). Male individuals and those with DM from group 4 had higher risks of EoCRC (1.149 [1.082 to 1.221] and 1.409 [1.169 to 1.699], respectively). The anti-dyslipidemia subgroup showed a marginally significant p interaction (pinteraction=0.060) (S13 Table) while taking anti-dyslipidemia medications increased the risk of EoCRC in both groups 3 and 4 (1.434 [1.105 to 1.861] and 1.341 [1.073 to 1.677], respectively). Although LDL-C levels above 130 mg/dL and ≤ 160 mg/dL increased the risks of EoCRC (1.104 [1.007 to 1.210] and 1.122 [1.060 to 1.187], respectively), the association between changes in TG status and EoCRC risk did not differ significantly according to TC, LDL-C, and HDL-C levels.
Discussion
Our findings suggest the possibility of using persistent HTG as a serial biochemical marker for predicting the risk of EoCRC. A recent meta-analysis of the previous 13 studies conducted from 1997 to 2019 revealed that HTG is associated with a high incidence and risk of CRC [5,6,13-25]. However, most studies included in the meta-analysis evaluated the association between HTG and colorectal cancer risk as a secondary outcome, and studies on the effect of HTG on EoCRC risk were rate (S14 Table). One study by Jung et al. [26] identified elevated TG levels as a risk factor for both overall and advanced colorectal neoplasia in the younger population. Recently, Jin et al. [8] found an increased risk of EoCRC in patients with HTG. However, TG was not the primary interest of all these studies, and only a single-point evaluation of TG was performed before the diagnosis of EoCRC. Our study overcame these limitations, further adjusted for obesity indicators, and eventually found a 10% risk increase in EoCRC in individuals with HTG persistence long before the diagnosis of CRC. Therefore, our findings confirmed that HTG alone increases the risk of EoCRC, as suggested by previous observational studies.
In line with the high incidence of EoCRC in the rectum, our study found that persistent HTG develops EoCRC more frequently in overall colorectal sites, especially the rectum [7]. Previous studies on EoCRC have found strong associations between the primary risk factors of EoCRC and rectal cancers. Therefore, the interaction between TG and rectal carcinogenesis should be evaluated further in future studies. Interestingly, group 3 and group 4 had a higher risk of EoCRC in the rectum. A plausible explanation for the higher EoCRC risk shown in group 3 might be that individuals from group 3 may have undergone lifestyle modifications or TG-lowering medications after learning their HTG status in 2009.
Increasing serum TG levels were associated with a higher risk of EoCRC. Borena et al. found a positive association between TG levels and CRC incidence in men [6]. Our observations underscore the need for biological investigation of the interaction between TG and EoCRC carcinogenesis in the distal colon and rectum in the context of molecular histopathologic profiles.
In our non-age-censored data, we found significant interactions between HTG persistence and EoCRC risk in males and individuals with diabetes. Although the male sex is a well-known risk factor for both overall CRC and EoCRC, the mechanism of carcinogenesis remains unclear. Since HTG is closely related to visceral obesity, variations in visceral fat distribution between males and females could explain the differing risks of EoCRC. However, this association persists even after adjusting for WC, a proxy for visceral obesity Therefore, HTG may be associated with EoCRC risk independently of its association with visceral obesity. Furthermore, the protective effect of estrogen and progesterone may be attributed to the lower risk of EoCRC in females [27]. Regarding diabetes, a prior meta-analysis demonstrated a 1.3-fold increase in CRC risk in patients with diabetes [28]. However, a direct relationship between DM and EoCRC has not been widely reported. Due to the age-specific nature of diabetic incidence, possibly a significant interaction was only observed in non-age-censored data. Further research is required to validate the mechanism by which TG interacts with DM to increase the risk of EoCRC.
The biological mechanism by which TG induces EoCRC remains unclear. Lipid metabolism, intestinal microbiota, and cellular stress responses may be involved in the development of EoCRC [1,29]. Most importantly, CRC requires lipids for proliferation. Ecker et al. [30] quantified the comprehensive lipidome of CRC tissues and showed that a high TG signature has prognostic value in patients with CRC. Several mechanisms may explain the association between dyslipidemia and CRC development. Since cancer cells require lipids for proliferation, higher ingestion of exogenous lipids may induce a constant supply of free fatty acids to CRC cells. Furthermore, chronic HTG can induce hyperinsulinemia and insulin resistance, which subsequently stimulate the production of reactive oxygen species and contribute to carcinogenesis by damaging cellular DNA [26]. Additionally, there are studies investigating the role of the intestinal microbiota in regulating lipid metabolism [27]; they speculate that some intestinal microorganisms such as Fusobacterium nucleatum, Bacteroides fragilis, and Bifidobacterium species might contribute to EoCRC tumorigenesis through interaction with excess TG. However, the causal relationship between HTG and EoCRC through intestinal microorganisms is elusive and needs further studies.
To the best of our knowledge, this is the first study to consider the implementation of HTG investigations in association with EoCRCs. The chronic effects of lipotoxicity induced by HTG have not been previously investigated in detail. Nevertheless, this study had several limitations. First, we gathered retrospective nationwide data only from South Koreans. However, since we evaluated the effect of HTG persistence in ethnicities experiencing a rapid increase in dyslipidemia, this study’s design can be applied to other ethnicities and be used to evaluate the causality between HTG and EoCRC. Second, we could not exclude all individuals who have an IBD. Third, we could not identify individuals with a family history of CRC, which is also an important risk factor for EoCRC. Fourth, secondary causes of HTG were not fully excluded from the claims data. Fifth, we could not identify hereditary colon cancers in our claims data. Sixth, analyzing EoCRC based on the genetic and epigenetic profiles of EoCRC tumors may be needed to further categorize sub-populations with a higher risk of developing EoCRC. Recent evidence shows that MSI-high accounts for 10%-30% of EoCRCs compared to 15% of all CRCs [1]. Seventh, since we did not know which stage of each EoCRC patient was diagnosed, sub-analysis according to the EoCRC stage was impossible. Eighth, information on host genetic factors or early-life exposures, such as diet during the prenatal period and childhood, was lacking. It would have been valuable to evaluate the differences in EoCRC incidences according to these factors since studies on the effect of early life exposures on EoCRC are still lacking [1]. Ninth, had gut microbial specimens from each participant been collected, further evaluation of the association between gut microbiota and HTG on the risk of EoCRC would have been possible. Tenth, our analysis only covered the participants who received the national health checkups in both 2009 and 2011. Considering that people who do not receive regular checkups may have unhealthy lifestyle patterns, those who were not enrolled in the study may have had a higher risk of developing EoCRC. Lastly, the evolution of triglycerides during the follow-up period has not been considered.
In conclusion, our study demonstrated that the persistence of HTG is associated with a higher risk of EoCRC. Individuals in the HTG-persisted group who were male and had DM showed a higher risk of developing EoCRC. As the incidence of EoCRC increases, it is essential to focus on detecting modifiable risk factors for EoCRC. Among the many lipid components, TG has the potential to be a suitable screening marker for EoCRC. Based on our nationwide cohort study, we suggest cautious CRC screening for a younger population with persistent HTG to detect the incidence of EoCRC early.