Introduction
Periampullary cancer consists of carcinoma of the pancreatic head, distal common bile duct, ampulla of Vater (AoV), and duodenum [1]. The incidence rates per 100,000 of each tumor type vary from 0.01 to 11.7, of which the incidence rate of AoV carcinoma is 0.49 per 100,000, accounting for 6% to 20% of periampullary cancers and 0.6% of gastrointestinal cancers [2–4]. AoV carcinoma has a better prognosis than other types of periampullary cancer [5]. Most cases are treated by curative resection, because AoV carcinoma is usually diagnosed at an early stage due to an initial clinical presentation with jaundice. However, the 5-year survival rate after resection is still 37% to 51% [6,7] and an issue regarding use of adjuvant treatment has been raised to prevent recurrence and improve survival. Unfortunately, there are no globally accepted clinical guidelines for the management of resected AoV carcinoma.
There have been only few studies assessing the role of adjuvant treatment for patients with resected AoV carcinoma. Most previous retrospective studies evaluated the role of adjuvant concurrent chemoradiation therapy (CCRT) in various periampullary carcinomas [1,8–14]. However, the survival benefit of adjuvant CCRT is still controversial and may be limited to patients with advanced T3/4 stage cancer or lymph node involvement [8–10,13–16]. For adjuvant chemotherapy, the ESPAC-3 periampullary cancer randomized trial compared adjuvant chemotherapy (fluorouracil/folinic acid or gemcitabine) with observation in 428 patients with resected periampullary adenocarcinoma [4]. In the primary analysis, adjuvant chemotherapy with fluorouracil/folinic acid or gemcitabine did not improve survival compared with observation [4]. However, further evidence from a homogeneous group of patients with AoV carcinoma is required, since the ESPAC-3 trial included a heterogeneous study population in which 31% of patients had cancer types other than AoV carcinoma. Therefore, we aimed to retrospectively evaluate the efficacy of adjuvant chemotherapy in 646 patients with resected AoV carcinoma.
Materials and Methods
1. Patients and data collection
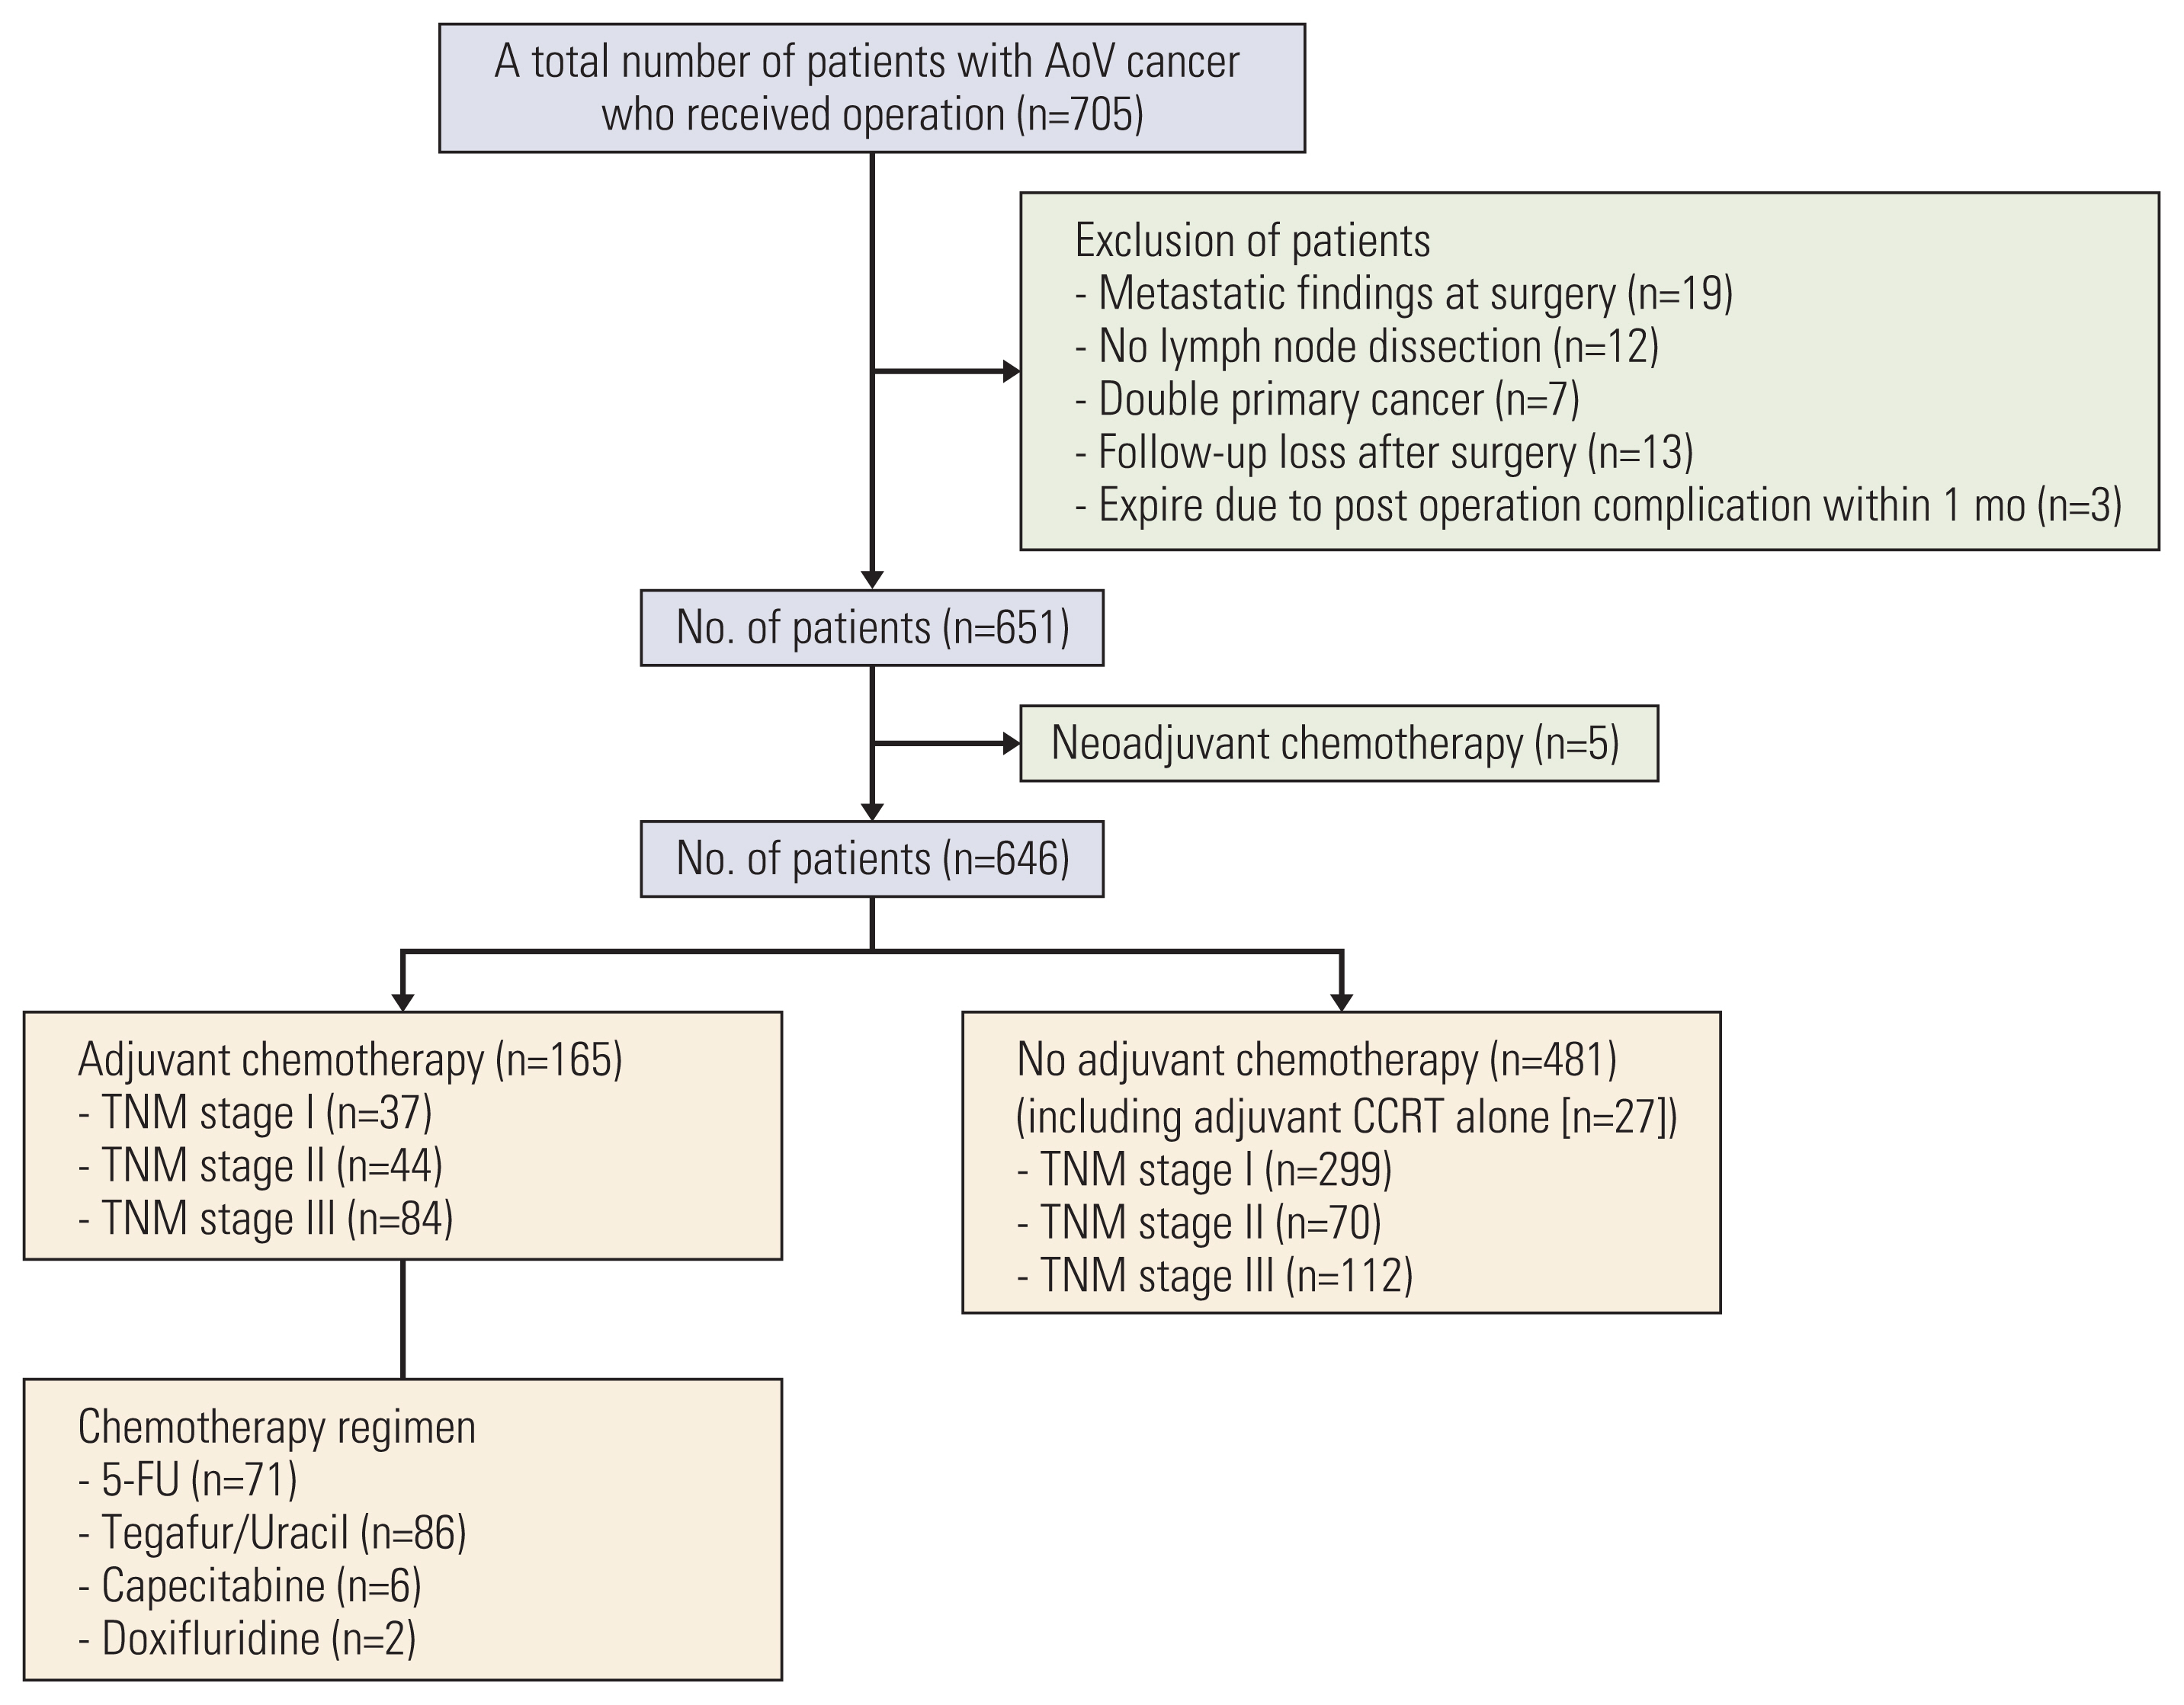
This is a single-center retrospective analysis. A total of 705 patients with AoV carcinoma underwent surgical resection at Asan Medical Center (Seoul, Korea) between January 2000 and December 2017. Among them, 59 patients were excluded from the analysis because of distant metastasis (M1) at the time of surgery (n=19), substandard surgery including no lymph node dissection (n=12), double primary malignancies (n=7), prior neoadjuvant chemotherapy (n=5), postoperative mortality within 30 days after surgery (n=3), and loss of follow-up after surgery (n=13). A total of 646 patients were included in this analysis (Fig. 1). Baseline characteristics, pathologic findings including American Joint Committee on Cancer (AJCC) staging 8th edition, type of surgery, adjuvant therapy, and survival outcomes were obtained from the prospectively collected database and analyzed retrospectively.
2. Surgery and adjuvant chemotherapy
Pylorus-preserving pancreatoduodenectomy with standard lymph node dissection was performed at the discretion of the surgeon, depending on clinical situation. After resection, adjuvant treatment was conducted at the discretion of the physician. Fluoropyrimidine-based monotherapy was used as adjuvant chemotherapy, and patients treated with chemoradiotherapy received radiotherapy with a dose of 40 to 50 Gy, depending on the clinical situation.
3. Surveillance
Patients were followed once a month for the first 3 months and every 3 months for the next 2 years. Blood tests, including tumor markers (carcinoembryonic antigen [CEA] and carbohydrate antigen 19-9 [CA 19-9]), were regularly performed before surgery and every 3 months for 2 years. Abdominal pelvis computed tomography (APCT) was regularly performed before surgery and every 6 months for 2 years, and whenever there was suspicion of tumor recurrence. From 2 to 5 years, blood tests and APCT were regularly performed every 6 months.
4. Statistical analysis
Categorical and quantitative data were compared using the chi-square or Fisher exact test and the Mann-Whitney U-test, respectively. Overall survival (OS) was defined as the time from surgery to the date of death from any cause. Recurrence-free survival (RFS) was defined as the time from surgery to the date of recurrence or death, whichever occurred first. Survival curves were estimated by the Kaplan-Meier method and compared by log-rank tests. Cox proportional hazards models were used for univariate and multivariate analyses, and multivariate analysis included the potential variables (p < 0.1) in the univariate analyses, using a backward likelihood method. The values of CEA and CA 19-9 before surgery was included in univariate and multivariate analyses. Propensity score matching was used with 1:1 greedy nearest neighbor algorithm within specified caliper widths in subgroup analysis of stage II/III patients. Univariate Cox regression model was used with robust variance estimation to account for clustering by matched pairs. Propensity score matching was performed using SAS version 9.4 (SAS Institute Inc., Cary, NC). A p-value less than 0.05 was considered statistically significant. Statistical analyses were performed using the Statistical Package for the Social Sciences ver. 25.0 (IBM Corp., Armonk, NY), and all tests were two-sided, with 5% defined as the level of significance.
Results
1. Patient characteristics
Baseline patient characteristics are summarized in Table 1. The median age was 62 years (range, 35 to 87 years), and 54.2% of patients were male. According to the AJCC 8th edition, 52.0% of patients were stage I, 17.6% were stage II, and 30.3% were stage III. No patient had R2 resection, and 13 patients (2.0%) had R1 resection. Pylorus-preserving pancreaticoduodenectomy was performed in 99.5% of patients, and total pancreatectomy was performed in three patients (0.5%). Baseline serum CEA and CA 19-9 levels were elevated in 58 patients (9.0%) and 191 patients (29.6%), respectively.
Patients were classified into adjuvant chemotherapy group (n=165, 25.5%) and no adjuvant chemotherapy group (n=481, 74.5%). CCRT was administered to 27 patients (4.2%) in the no adjuvant chemotherapy group and 13 patients (2.0%) in the adjuvant chemotherapy group. Among adjuvant chemotherapy regimens, tegafur/uracil was the most commonly used and was administered to 86 patients (52.1%), followed by intravenous fluorouracil/leucovorin (n=71, 43%), capecitabine (n=6, 3.6%), and doxifluridine (n=2, 1.2%). Compared with patients in the no adjuvant chemotherapy group, patients in the adjuvant chemotherapy group had a significantly higher proportion of males (61.2% vs. 51.8%, p=0.036), larger tumors (mean size, 2.25 cm vs. 2.04 cm; p=0.033), more advanced stage of cancer (stage I, 22.4% vs. 62.2%; stage II, 26.7% vs. 14.6%; stage III, 50.9% vs. 23.3%; p < 0.001), more lymph node involvement (50.9% vs. 23.3%, p < 0.001), more perineural invasion (34.5% vs. 16.6%, p < 0.001), more lymphovascular invasion (LVI; 60.6% vs. 33.5%, p < 0.001), more poorly differentiated histology (13.3% vs. 6.2%, p < 0.001), and elevated preoperative serum CA 19-9 (35.8% vs. 27.4%, p=0.014).
2. Survival outcomes
With a median follow-up duration of 88 months (95% confidence interval [CI], 82.2 to 93.8), recurrence and death occurred in 265 patients (41.0%) and 269 patients (41.6%), respectively. Median RFS was 130 months (95% CI, 95.5 to 164.5), and median OS was 152 months (95% CI, 114.5 to 189.5) (S1 Fig.).
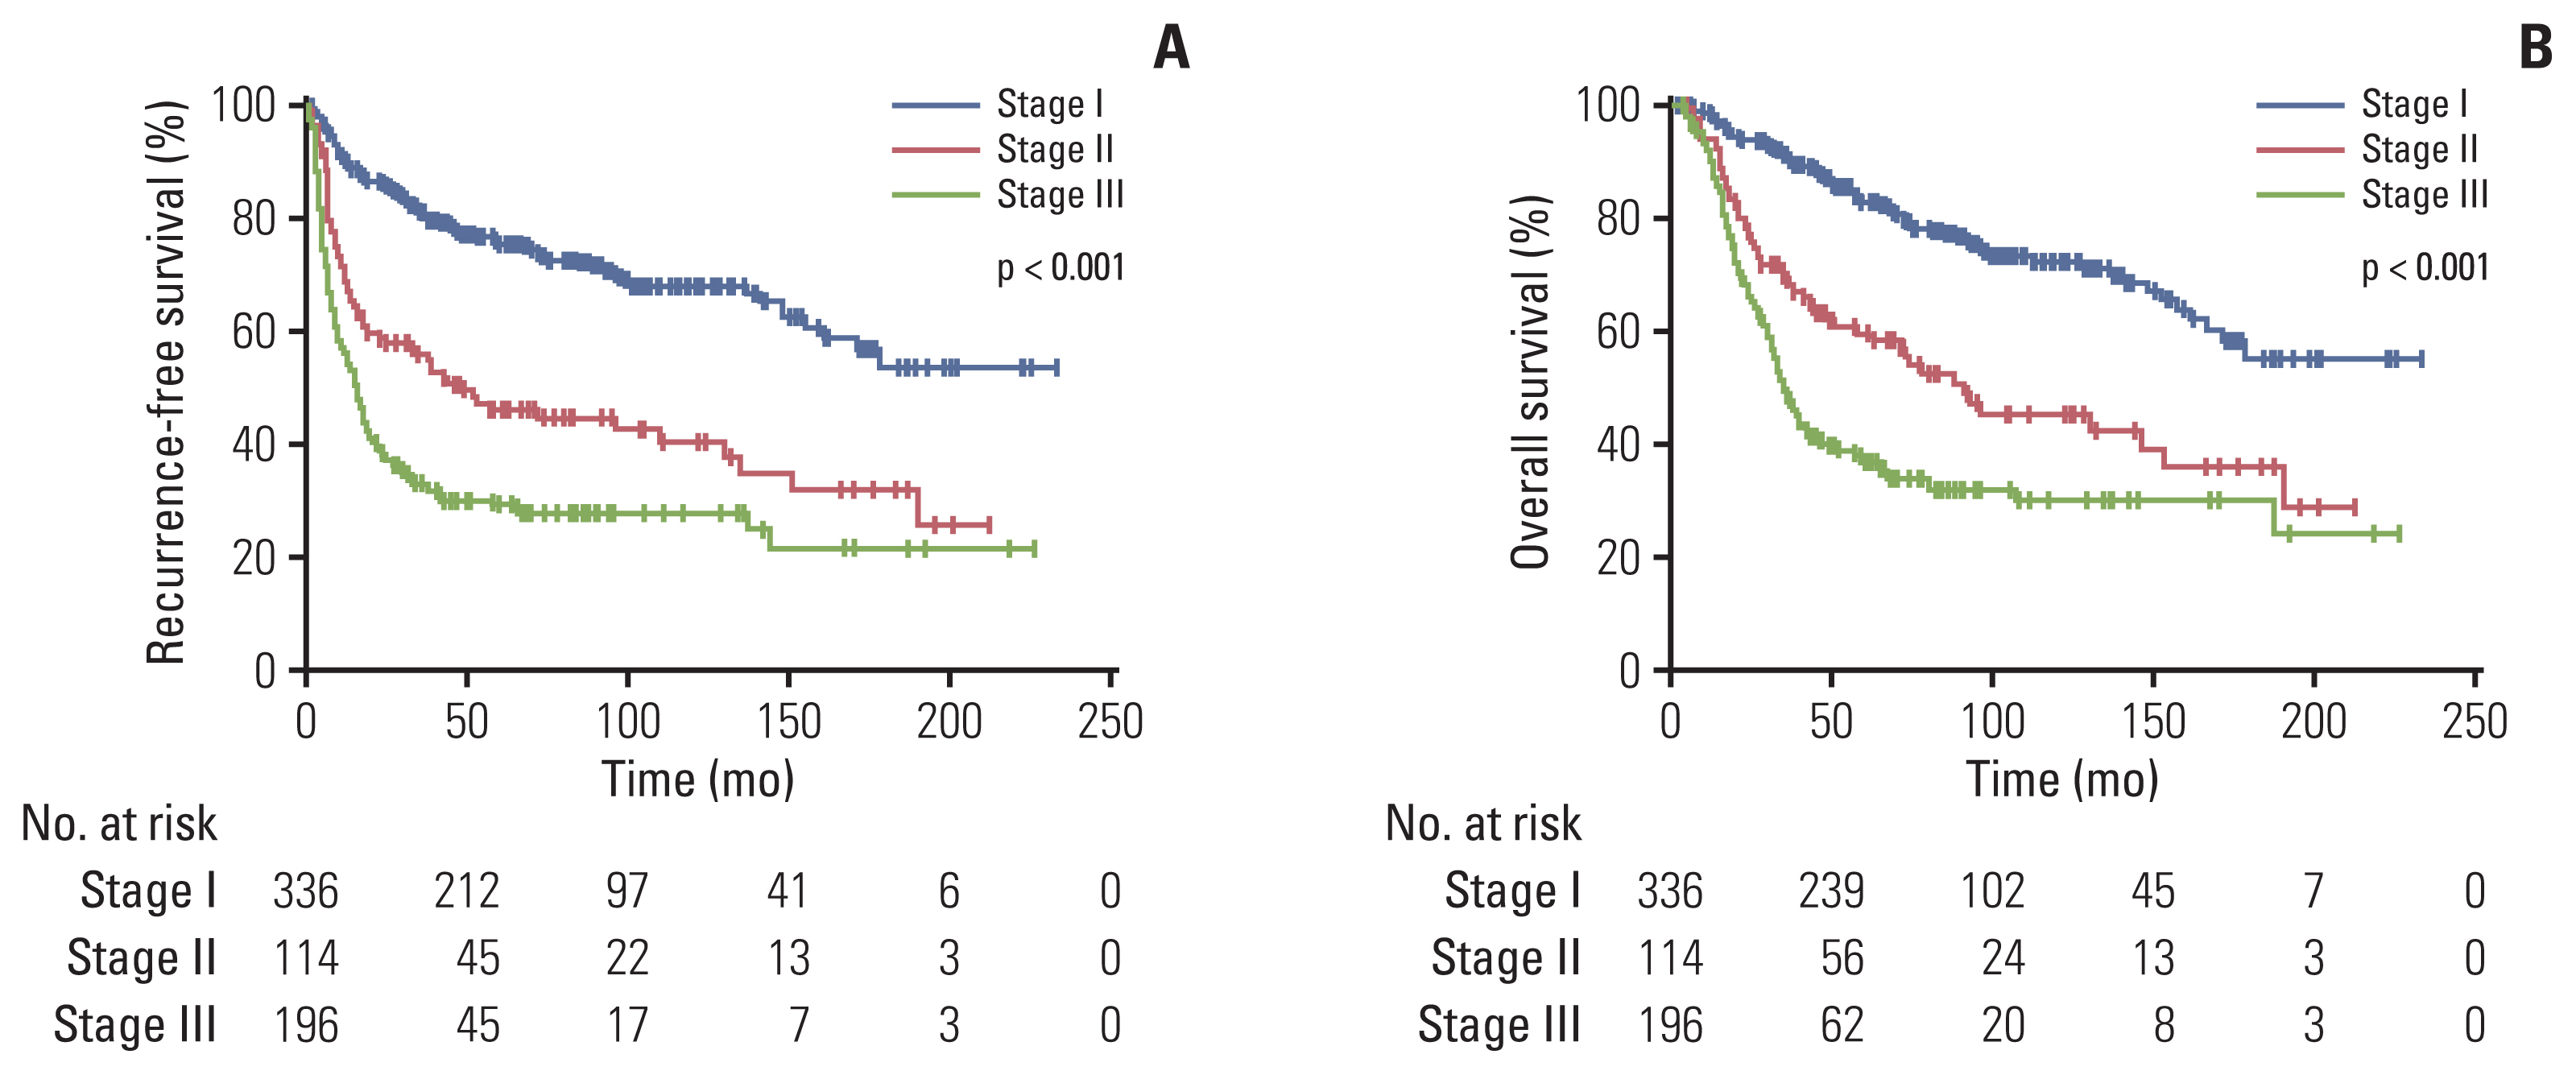
Median values of RFS and OS were not reached in patients with stage I disease. Median RFS was 44 months (95% CI, 17.9 to 70.1) in stage II patients and 15 months (95% CI, 11.6 to 18.4) in stage III patients (p < 0.001) (Fig. 2A). Median OS was 88 months (95% CI, 65.9 to 110.1) in stage II patients and 35 months (95% CI, 30.3 to 39.7) in stage III patients (p < 0.001) (Fig. 2B).
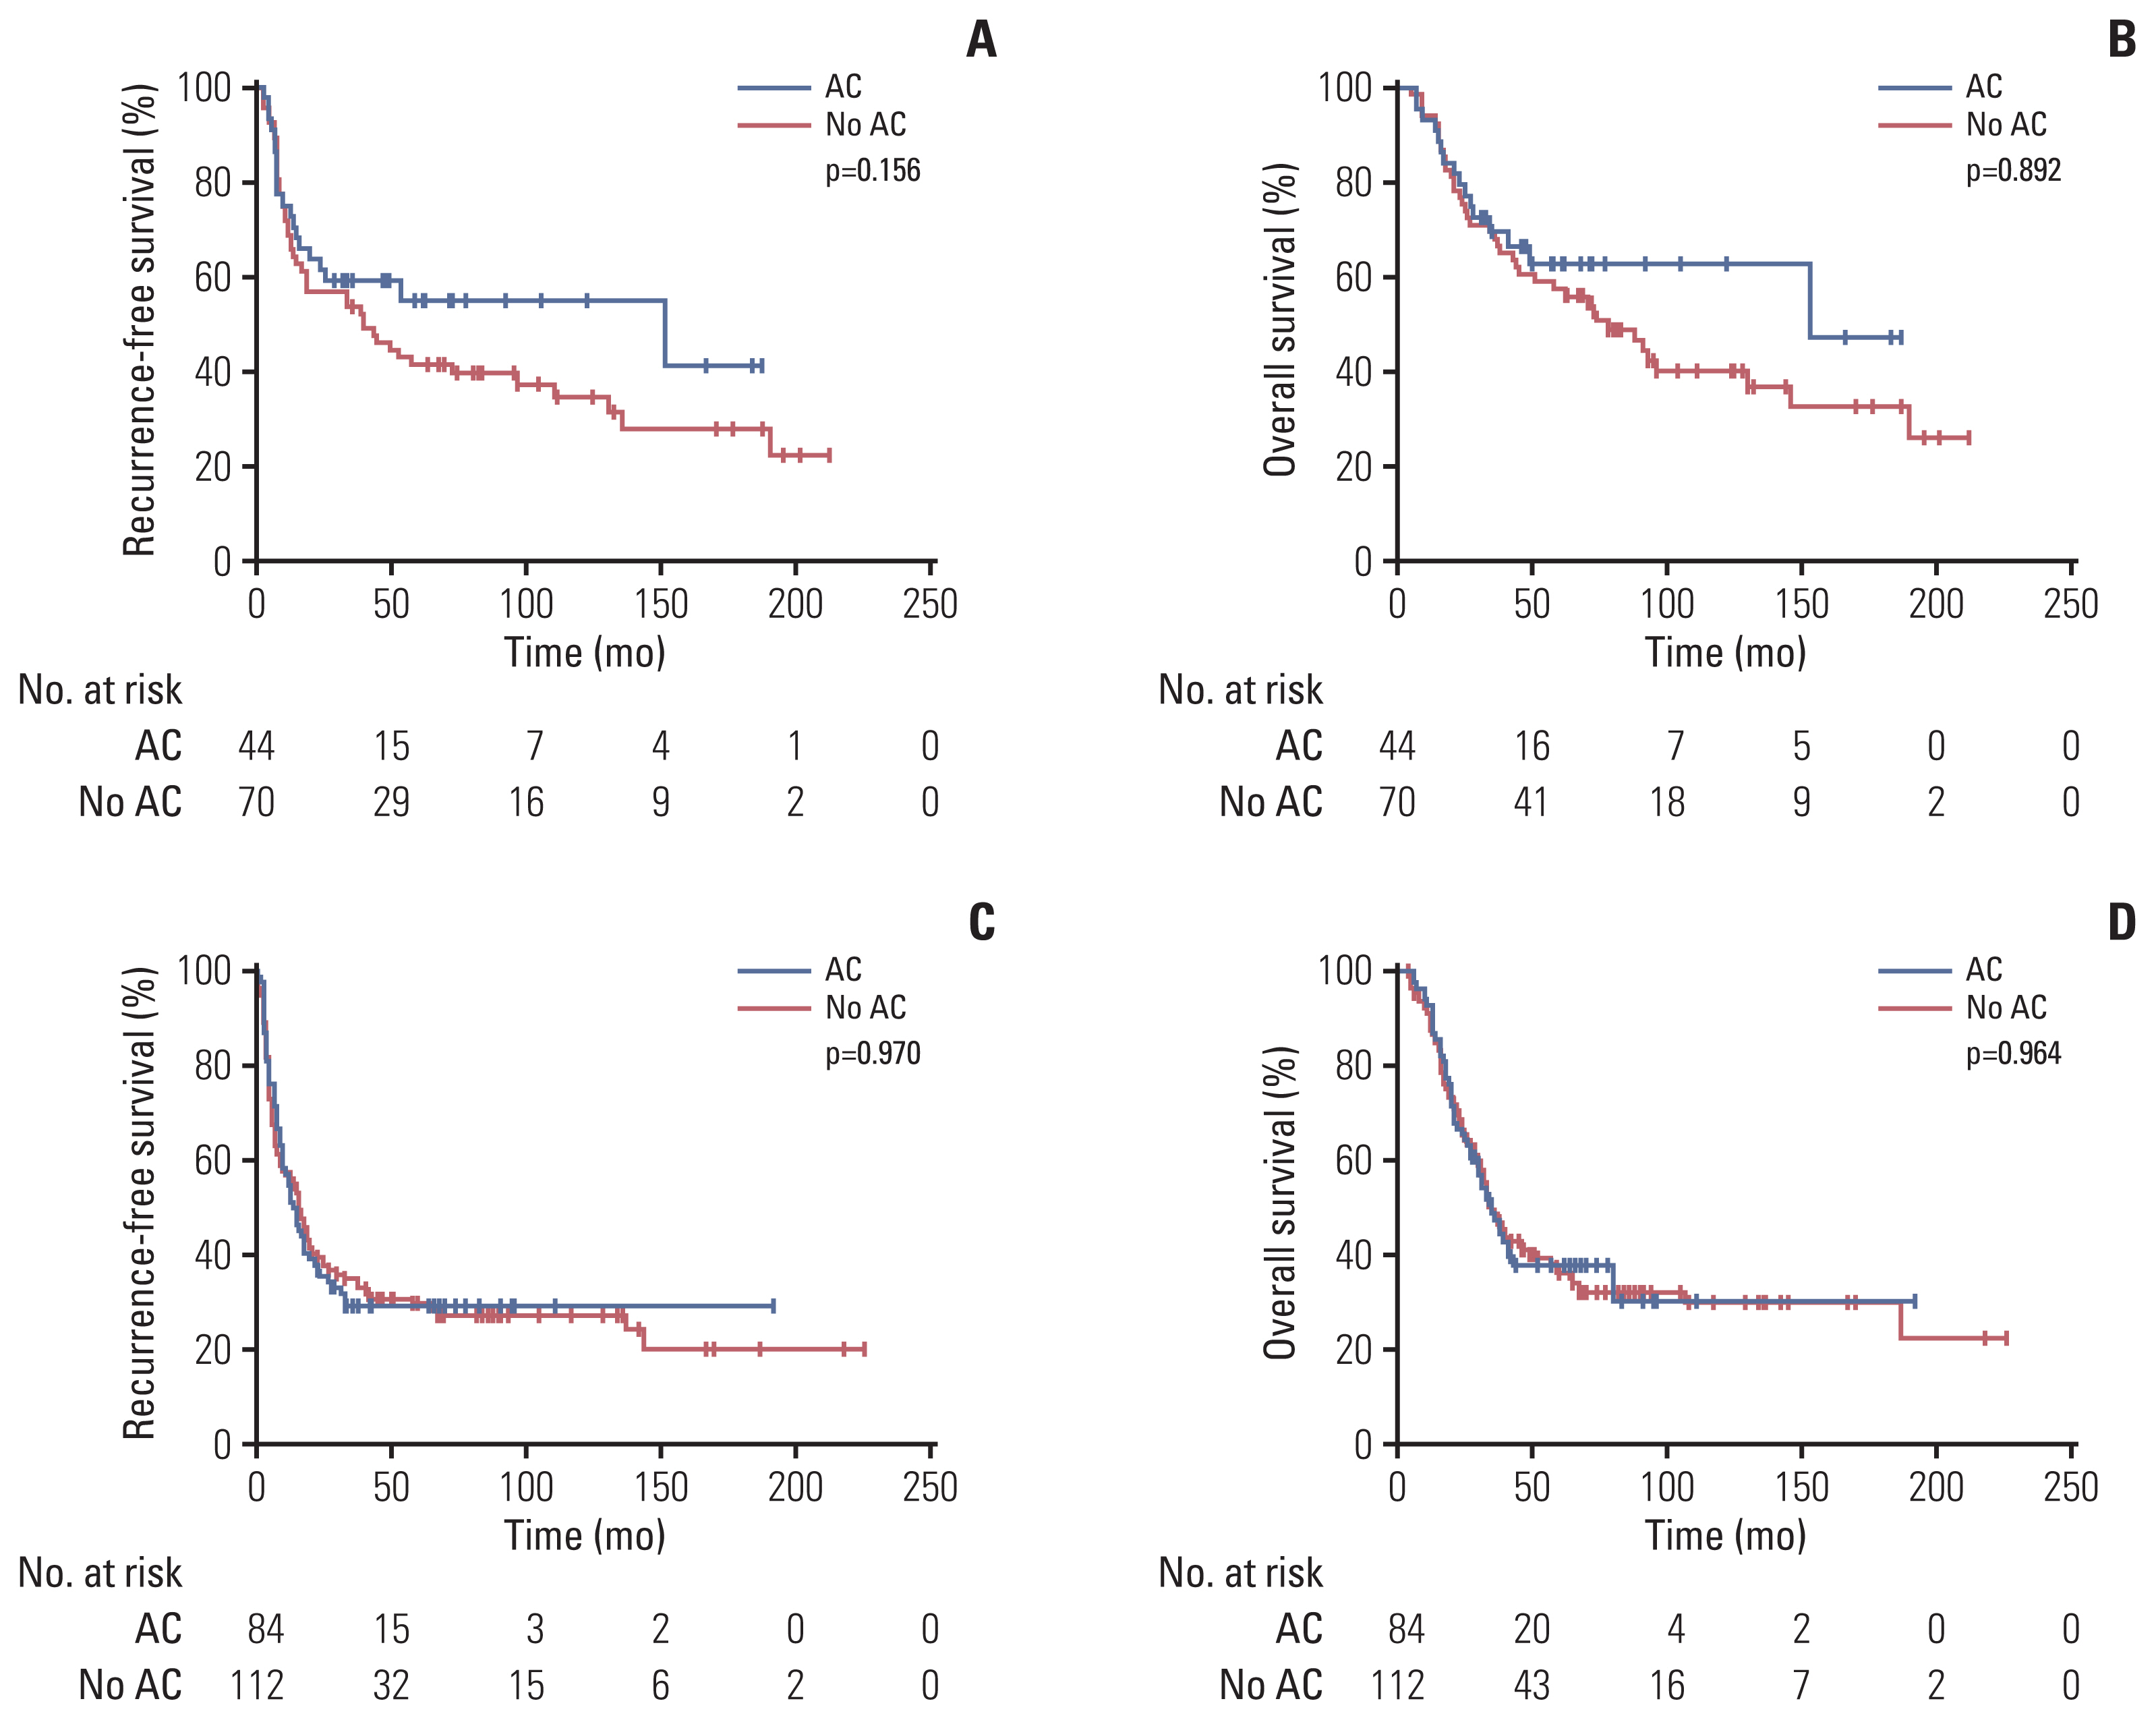
In patients with stage I disease, all median values of RFS and OS were not reached, without significant differences between the two groups (median RFS, p=0.488; median OS, p=0.970). In patients with stage II disease, RFS and OS were numerically better in the adjuvant chemotherapy group than in the no adjuvant chemotherapy group, although there were no statistically significant differences between the groups (median RFS, 151 months vs. 38 months; p=0.156 and median OS, 153 months vs. 74 months; p=0.299) (Fig. 3A and B). In patients with stage III disease, RFS and OS did not differ between the two groups (median RFS, 14 months vs. 16 months; p=0.970 and median OS, 35 months vs. 35 months; p=0.964) (Fig. 3C and D). According to the regimen of adjuvant chemotherapy, there were no significant differences between fluorouracil/leucovorin and tegafur/uracil in RFS (median, 25 months vs. 24 months; p=0.948) and OS (median, 45 months vs. 80 months; p=0.629) (S2 Fig.).
3. Univariate and multivariate analysis for RFS and OS
In the univariate analyses, old age (> 60 years), male sex, adjuvant chemotherapy, advanced TNM stage, R1 resection status, presence of LVI, presence of perineural invasion, poorly differentiated histology, and elevated preoperative CA 19-9 and CEA levels were significantly associated with poor RFS, and all of these factors except for old age were also significantly associated with poor OS (Tables 2 and 3).
In the multivariate analysis for RFS, TNM stage (stage II vs. I: hazard ratio [HR], 2.36; stage III vs. I: HR, 3.30; p < 0.001), resection status (R1 vs. R0: HR, 2.03; p=0.030), presence of LVI (HR, 2.18; p < 0.001), and presence of perineural invasion (HR, 1.54; p=0.005) showed significant association, while adjuvant chemotherapy (yes vs. no: HR, 0.74; 95% CI, 0.54 to 1.00; p=0.052) was marginally related. In the multivariate analysis for OS, TNM stage (stage II vs. I: HR, 2.04; stage III vs. I: HR, 3.08; p < 0.001), resection status (R1 vs. R0: HR, 2.07; p=0.034), presence of LVI (HR, 1.74; p=0.001), and presence of perineural invasion (HR, 1.76; p=0.001) remained significant factors.
4. Subgroup analysis of stage II/III patients before and after propensity score matching
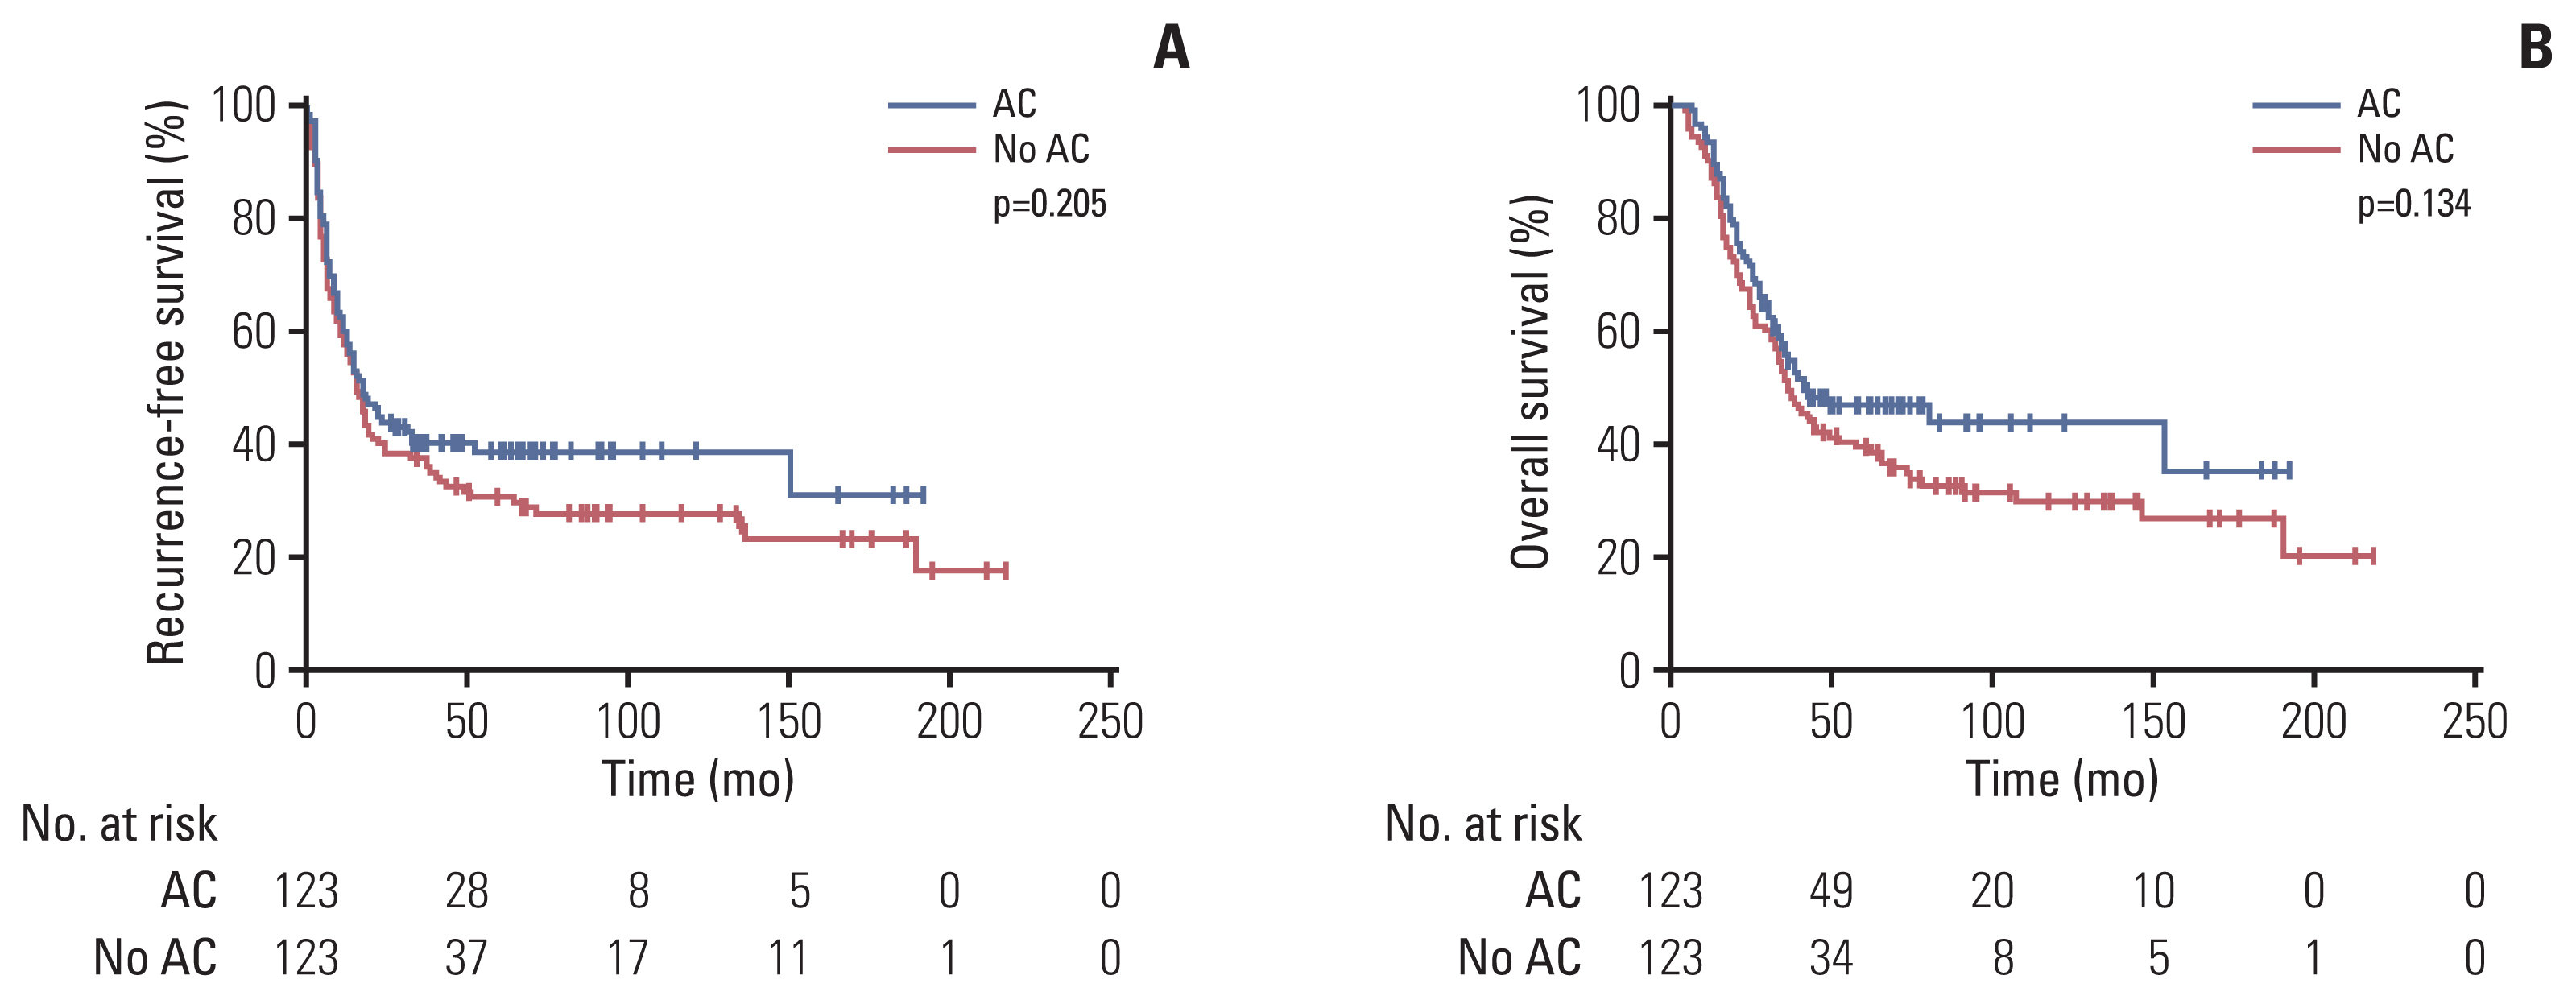
Table 4 summarizes the univariate and multivariate analysis of RFS and OS of stage II/III patients in the unmatched and matched samples. At multivariate analysis of unmatched samples, adjuvant chemotherapy was significantly associated with better RFS (HR, 0.73; 95% CI, 0.54 to 0.97; p=0.033), while not associated with OS (HR, 0.78; 95% CI, 0.57 to 1.07; p=0.129) (Table 4). After propensity score matching, all 246 patients with stage II/III disease were classified into adjuvant chemotherapy (n=123) and no adjuvant chemotherapy (n=123). Baseline characteristics of patients were well balanced (S3 Table). Median RFS and OS were numerically better in the adjuvant chemotherapy group than in the no adjuvant chemotherapy, although there were no statistically significant differences between the groups (median RFS, 18 months vs. 16 months; p=0.205 and median OS, 41 months vs. 36 months; p=0.134) (Fig. 4). The HR for RFS was 0.80 (95% CI, 0.60 to 1.06; p=0.116) and HR for OS was 0.77 (95% CI, 0.56 to 1.06; p=0.111) (Table 4).
5. Periodic changes in use of adjuvant chemotherapy and survival outcomes between 2000 and 2017
There were no significant differences in baseline characteristics between periods except for older age and higher proportion of present LVI in the recent period (2000–2006, 2007–2012, and 2013–2017: 58 years, 61 years and 64 years; p < 0.001 for age and 27.9%, 36.1%, and 48.4%; p < 0.001 for present LVI) (S4 Table). The proportion of patients receiving adjuvant chemotherapy increased (14% in 2000–2006, 14.1% in 2007–2012, and 37.8% in 2013–2017; p < 0.001). Details of periodic changes in the chemotherapy agents of patients treated with adjuvant chemotherapy are summarized in S5 Table and there were no significant differences in proportion of fluorouracil and tegafur/uracil, which were the most commonly used agents, between periods (p=0.565). There were no significant differences in RFS and OS among patients who underwent surgery during different time periods. The 5-year RFS rates were 52.7% in 2000–2006, 54.1% in 2007–2012, and 60.3% in 2013–2017 (p=0.580); the 5-year OS rates were 61.2% in 2000–2006, 63.4% in 2007–2012, and 70.2% in 2013–2017 (p=0.243) (Fig. 5).
6. Recurrence sites and patterns
Among 265 patients with recurrence, 37 (14.0%) and 228 (86.0%) patients presented initially with locoregional and systemic recurrence, respectively. Details of the recurrence sites are summarized in Table 5, and most of patients presented recurrence with systemic multiple sites. The most common sites of locoregional and systemic recurrence were regional lymph nodes and liver, respectively. There were no significant differences in locoregional (12.8% vs. 14.5%) and systemic recurrence (87.2% vs. 85.5%) between adjuvant chemotherapy and no adjuvant chemotherapy groups (p=0.703). Among 40 patients treated with CCRT, 27 patients had recurrence, most of which 25 (92.6%) presented initially systemic recurrence. There were no significant differences in locoregional reccurence rates between patients treated with CCRT and without CCRT (7.4% vs. 14.7%, p=0.392).
Discussion
The current study showed that utilization of adjuvant chemotherapy has increased during the past decades (from 14.1% in 2000–2012 to 37.8% in 2013–2017; p < 0.001), but there has been no significant improvement in survival. A recent multicenter retrospective study that evaluated the effect of adjuvant treatment in 651 patients with resected AoV carcinoma also reported that adjuvant treatment was not associated with survival [12]. Overall, median RFS and OS after curative resection were approximately 11 and 12.7 years, respectively, and significantly differed according to TNM stage. Among patients with stage II disease, RFS and OS were numerically better in patients receiving adjuvant chemotherapy than in those without adjuvant chemotherapy, although the difference did not reach statistical significance, and adjuvant chemotherapy was marginally associated with favorable RFS in multivariate analysis. After propensity score matching in subgroup analysis of stage II/III patients, RFS and OS with adjuvant chemotherapy were numerically longer than those without adjuvant chemotherapy (HR, 0.80; 95% CI, 0.60 to 1.06; p=0.116 and HR, 0.77; 95% CI, 0.56 to 1.06; p=0.111). This result is in line with the results of the ESPAC-3 trial [4], which showed an improvement in survival in patients with resected periampullary carcinoma who received adjuvant chemotherapy compared with those who did not receive adjuvant chemotherapy in multivariate analysis (HR, 0.75; 95% CI, 0.57 to 0.98; p=0.03), although the difference was not statistically significant before adjustment for various prognostic factors. These results suggest that AoV carcinoma may be a heterogeneous group of diseases and that it is necessary to find patient subgroups who would benefit most from adjuvant therapy.
Lack of efficacy of adjuvant chemotherapy in AoV carcinoma in our study and prior studies may be due to multiple factors. AoV carcinoma can be classified into two histologic phenotypes, the intestinal and pancreatobiliary types [17,18]; the pancreatobiliary type has been reported to have more aggressive clinical features [19–21]. Whole exome sequencing analysis [22] has shown that various genetic alterations and diverse signaling pathways are involved in AoV carcinoma. Interestingly, the prevalence of driver genetic mutations differed significantly between the pancreatobiliary type and the intestinal type; KRAS, TP53, and SMAD4 for pancreatobiliary type similar to pancreatic carcinoma and APC, TP53, KRAS, and SMAD4 for intestinal type similar to colorectal carcinoma [22]. Such genetic differences between cases of AoV carcinoma may contribute to their different responses to cytotoxic chemotherapy agents. Further studies exploring biologic differences will be necessary to identify optimal options for adjuvant chemotherapy.
In our study population, only fluoropyrimidine-based monotherapy was used, because these agents were the only agents available for resected AoV carcinoma in Korea. Considering that AoV carcinoma has the histologic features of either pancreatobiliary or colorectal cancer, and fluoropyrimidine- and oxaliplatin-containing doublet or triplet regimens have proven efficacy for resected colorectal [23] and pancreatic [24] cancer, these intensive chemotherapy regimens might be effective as adjuvant chemotherapy for resected AoV carcinoma. Further studies are required to evaluate the efficacy of these regimens.
As prognostic factors for AoV carcinoma, prior ESPAC-3 periampullary cancer trial reported age, resection margin, differentiation of histology, and lymph node involvement as unfavorable factors for survival [4]. Among patients with resected AoV carcinoma, vascular invasion, elevated CA 19-9 or age, T category, N category, and differentiation of histology were significantly associated with prognosis [12,25]. Consistent with these reports, age, sex, TNM stage, resection status, lymphovascular or perineural invasion, differentiation of histology, and serum CEA or CA 19-9 before surgery were associated with prognosis in the present study.
This study has some limitations. First, it is a retrospectively designed study, which cannot eliminate selection bias. Second, half of the patients treated with adjuvant chemotherapy received tegafur/uracil, which is an old-school chemotherapy, although there were no significant differences in RFS and OS according to regimens of chemotherapy. Third, this study could not include patients treated with gemicitabine-based monotherapy, which is one of the standard chemotherapies for pancreatobiliary cancer and was studied in the ESPAC-3 trial, because its use was not approved in Korea. In the ESPAC-3 trial, the gemcitabine group had significantly better survival than the observation group on multivariate analysis. Fourth, the efficacy of adjuvant chemotherapy according to histology subtype (intestinal or pancreatobiliary), which was not mandatoriliy reported, could not be evaluated in this retrospective study. Despite these limitations, this study had the strengths of a large number of patients and a long duration of follow-up to evaluate survival.
In conclusion, adjuvant chemotherapy with fluoropyrimidine did not improve survival in overall patients with resected AoV carcinoma. However, it was marginally associated with better RFS in multivariate analysis. Further investigation to determine the optimal options for adjuvant chemotherapy is warranted.