Introduction
Breast cancer (BC) remains the most frequent cancer type worldwide and one of the leading cancer-related causes of death in women [1]. Locally limited disease is curable in 70%–80% of patients, while distant metastases result in poor prognosis despite the vast variety of recent emerging therapeutic options [2].
Human epidermal growth factor receptor 2 (HER2) targeting, one of the most successful achievements in the treatment of BC during the last 30 years, originated from the identification of HER2, a surface tyrosine kinase receptor with pivotal role in the initiation and development of HER2-enriched BC [3]. Slamon et al. [4] showed that the combination of the anti-HER2 monoclonal antibody trastuzumab with chemotherapy in metastatic BC patients, yields significant improvements in objective responses and duration of responses, and prolongs time to disease progression and overall survival (OS), reforming the treatment landscape of HER2-positive disease.
Although the mechanism of function and clinical aspects of trastuzumab in the treatment of BC have been extensively studied, the role of angiogenesis in the management of HER2-positive BC is still unclear. Angiogenesis is a crucial factor in the initiation and development of BC and has been recently reviewed elsewhere [5].
Preclinical studies have outlined the cross-talk pathways between HER2 signaling and angiogenesis in animal and human cell lines, linking HER2 activation with vascular endothelial growth factor (VEGF) mRNA expression, hypo-xia-inducible factor-α (HIF-α) synthesis and microvessel counts (reviewed by Alameddine et al. [6]). In clinical studies, BC tissue samples were found to display HER2 expression in significant association with VEGF and the proangiogenic cyclooxygenase-2 (COX-2) (reviewed by Alameddine et al. [6]). The mechanisms linking HER2 signaling with angiogenesis involve primarily direct induction of COX-2 transcription, activation of mitogen-activated protein kinases (MAPKs) and resultant VEGF transcription and activation of phosphoinositide 3-kinase (PI3K)–Akt–mammalian target of rapamycin (mTOR) and MEK-ERK-mTOR with subsequent HIF-α expression (reviewed by Alameddine et al. [6]). Clinical studies of HER2-positive BC, at various phases (0-III), have investigated the use of anti-angiogenic agents along with HER2 targeting, namely employing the anti-VEGF monoclonal antibody bevacizumab, in the neoadjuvant or adjuvant setting, anti–vascular endothelial growth factor receptor tyrosine kinase inhibitors, mTOR inhibitors, COX-2 inhibitors or the antiangiogenic effect of metronomic administration of chemotherapeutic regimens. Frequent obstacles in the establishment of such regimens involve toxicity or modest results (reviewed by Alameddine et al. [6]), both accentuated by the still elusive reliable predictive factors.
In the present study, in view of the link between HER2 signaling and angiogenesis, we hypothesized that the expression of VEGFA and VEGFC and VEGF receptors 1, 2, 3 (VEGFR1, VEGFR2, VEGFR3), the pivotal angiogenesis effectors, may have clinical prognostic significance for female BC patients with metastatic disease treated with trastuzumab.
Materials and Methods
1. Study design, population, and data collection
The study was conducted following the Helsinki Declaration on ethical guidelines (2013) [7] was approved by the Bioethics Committee of the Aristotle University of Thessaloniki School of Medicine and was performed by the Hellenic Cooperative Oncology Group (HeCOG).
It is a retrospective translational research study of patients with histologically confirmed, metastatic BC, treated with trastuzumab-based regimens. The medical records of all patients were retrospectively reviewed. Adequacy of clinical, pathological and treatment data on patients’ medical records and availability of adequate tumor tissue were also included in the eligibility criteria. Initial HER2 expression was centrally reassessed due to known issues with inter-laboratory discordances. All experiments were designed and performed in the Laboratory of Molecular Oncology, Aristotle University of Thessaloniki.
2. Immunohistochemical analysis
Formalin-fixed, paraffin-embedded (FFPE) tumor tissue samples were retrospectively collected from the enrolled patients. Representative hematoxylin-eosin-stained tumor sections were reviewed by a pathologist (M.B.) and representative tumor areas were selected for the construction of the tissue microarray (TMA) blocks, as previously described [8]. Each case was represented by two tissue cores, 1.5 mm in diameter. Various neoplastic, non-neoplastic, and reactive tissues were also included in each TMA block to assist in the orientation and provide internal assay controls. Cases inadequately represented on the TMA sections were re-cut from the original blocks and whole tissue sections were used for immunohistochemical analysis.
Serial 2.5-μm-thick thick tissue sections from the TMA or the original blocks were used for the immunohistochemical staining, performed in the Laboratory of Molecular Oncology of the Hellenic Foundation of Cancer Research/Aristotle University of Thessaloniki, using a Bond MaxTM autostainer machine (Leica Microsystems, Wetzlar, Germany). The primary antibodies employed, retrieval conditions, dilution, and incubation time are presented in Table 1, as previously described [9].
3. Evaluation of immunohistochemistry
All immunohistochemical stains were assessed by one pathologist (E.K.) blinded to the case and patient characteristics. The angiogenesis-related proteins VEGFA, VEGFC VEGFR1, VEGFR2, and VEGFR3 were variably expressed and evaluated in the neoplastic cells, stromal lymphocytes, plasma cells, and the vascular endothelium. The non-neoplastic elements served as internal positive control in each tissue core. Scoring of immunostaining was performed based on the Allred score (values 0–8), calculated as the sum of points for the percentage of stained neoplastic cells (points 0–5) and the staining intensity (points 0–3), as follows: points 0–5 correspond to the following percentages of positive tumor cells 0%, < 1%, 1%–10%, 11%–33%, 34%–66%, and 67%–100%, respectively; points 0–3 for intensity were assigned for negative, weak, moderate or intense staining intensity, respectively.
4. Gene expression analysis
The protein expression and mRNA levels of VEGFA, VEGFC, VEGFR1, VEGFR2, and VEGFR3, were evaluated in FFPE tumor tissues. FFPE tissue blocks were processed for RNA extraction, following histological examination to estimate tumor tissue abundance and mark areas with highest tumor cell density. Manual macrodissection was performed in cases with < 50% tumor cell content. RNA extraction from whole or macrodissected 10-μm paraffin sections was carried out with a fully automated nucleic acid isolation method, based on silica-coated magnetic beads (Versant Tissue Preparation Reagents, Siemens Healthcare Diagnostics, Tarrytown, NY) in combination with a liquid handling robot, as before [10,11]. Finally, to ensure the presence of pure RNA, DNase I was added to each nucleic acid extract to remove DNA.
Subsequent cDNA synthesis was performed with random primers and SuperScript III reverse transcriptase (cat. No. 48190011 and 18080044, Invitrogen, Carlsbad, CA), accor-ding to standard procedures. cDNAs were assessed in duplicate 10 μL reactions with quantitative polymerase chain reaction in an ABI7900HT system for 45 cycles of amplification using premade exon-spanning Taqman-MGB assays (App-lied Biosystems/Life Technologies, Fisher Scientific, Foster City, CA) for the following transcripts (data in parentheses refer to assay ID and amplicon size): FLT1 (VEGFR1) exons 17–18 (Hs00176573_m1; 55 bp), KDR (VEGFR2) exons 15–16 (Hs00176676_m1; 84 bp), VEGFC exons 4–5 (Hs00153458_m1; 126 bp), VEGFA exons 1–2 (Hs00173626_m1; 77 bp), HIF1A exons 4–5 (Hs00153153_m1; 76 bp), NRP1 exons 7–8 (Hs00826128_m1; 90 bp), TEK exons 11–12 (Hs00176096_m1; 82 bp), VCAM1 exons 7–8 & 8–9, (Hs00365486_m1; 122 bp), VHL (Von Hippel-Lindau tumor suppressor) exons 2–3 (Hs00184451_m1; 72 bp).
For the detection of VEGF xa and xb transcript variants, custom assays were designed spanning exons 7b–8a for VEGFA165a, 189a, 206a, and exons 7b–8b for VEGF165b, 189b, 206b (sense primer, antisense primer, and, Taqman MGB probe, all sequences 5′-3′): for xa, AAACACAGACTCGCGTTGCA, AGAGATCTGGTTCCCGAAACC, and CGAGGCAGCTTGAG; for xb, AGGCGAGGCAGCTTGAGTTA, ACGTTCTGTCGATGGTGATGGT, and CGAACGTACTTGCAGATC. The size of xa transcripts was 129 bp and for xb 122 bp, respectively.
A Taqman-MGB expression assay targeting β-glucuronidase (GUSB) exons 8–9 (Hs00939627_m1; 96 bp) was used as the endogenous reference for relative quantification. The commercially available TaqMan Control Total RNA (cat. No. 4307281, Applied Biosystems) was applied as a positive control for inter-run evaluation of polymerase chain reaction assay efficiency, alongside no-template controls. Finally, to obtain linear relative quantification values, relative expression was assessed as (40-dCT), as described before [10]. Samples were considered eligible for GUSB CT < 36 and deltaRQ for each duplicate pair (intra-run variation) of < 1. Based on the above criteria, RNA samples for 60 patients yielded informative results for all aforementioned targets and were considered eligible for relative mRNA expression analysis.
The biomarkers were associated with patient characteristics and other markers of interest, related to HER2 resistance and available in the HeCOG database, including PTEN (phosphatase and tensin homolog), phosphorylated forms of HER2 (pHER2Tyr 877 pHER2Tyr 1221/1222) and HER3 protein expression, PIK3CA (phosphatidylinositol-4,5-bisphosphate 3-kinase catalytic subunit alpha) status as well as mRNA expression of HER2, HER3, HER4, Src (SRC proto-oncogene, non-receptor tyrosine kinase), CDKN1B (cyclin dependent kinase inhibitor 1B), and JAK2 (Janus kinase 2).
5. Statistical analysis
Descriptive statistics including counts with the corresponding percentages (for categorical variables) and medians with range (for continuous variables) were used to summarize patient characteristics and the distribution of examined markers for the entire cohort and by central HER2 status (according to central assessment of HER2). The median value of the Allred scores was used as a cut-off point for VEGFR1, VEGFR2, VEGFR3, VEGFA, and VEGFC to categorize tumors into low or high-expressing. The associations of the expression of examined markers with patient characteristics and other markers of interest were assessed in the entire cohort using the chi-square or the Fisher exact test if appropriate (for categorical variables) and the Wilcoxon rank-sum test (for continuous variables). Spearman correlations were used to evaluate the associations between the mRNA levels of the markers of interest.
Progression-free survival (PFS) was defined as the time from the initiation of trastuzumab treatment for metastatic BC (with or without concurrent chemotherapy/hormonal therapy) to the date of the first documented disease progression, death from any cause or last contact (whichever occurred first). Survival was measured from the initiation of trastuzumab treatment to the date of death (from any cause), with patients alive and those lost to follow-up being censored at the date last known to be alive. Survival curves were estimated with the Kaplan-Meier method and compared between groups with the log-rank test.
The prognostic value of the tumoral and stromal expression of the examined markers was evaluated with respect to PFS and survival separately in patients with HER2-positive and HER2-negative tumors, only for those markers with adequate number of patients and events of interest (PFS or survival events) in each group. The prognostic value of the mRNA expression of examined markers was not assessed due to the small number of patients with available data. All parameters were tested for proportionality using time-dependent covariates. The associations between the stromal and tumoral expression of the examined markers and progression/mortality rates were assessed with hazard ratios (HR) and 95% confidence intervals (CI) estimated by univariate Cox proportional hazard regression models. Multivariate Cox regression analyses with a backwards selection criterion of p < 0.10 were also performed, including: menopausal status (premenopausal, postmenopausal), performance status (0, 1–2), estrogen receptor (ER)/progesterone receptor (PR) status (negative, positive), number of metastatic sites (1–2, 3), as well as each marker that was found to be a significant prognosticator or revealed a trend towards significance in the univariate analyses (p < 0.10).
Follow-up information for all patients was updated in October 2019. All tests were two-sided at an alpha 5% level of significance. Analyses were conducted using the SAS ver. 9.3 software (SAS Institute Inc., Cary, NC).
Results
1. Patient population
A total of 200 female patients, with available data for at least one of the markers of interest, were included in the current study. Trastuzumab was administered for HER2-positive disease according to the original HER2 assessment in the local institution. Nevertheless, upon central re-evaluation of HER2 status, 78 patients (39%) were found to have in fact HER2-negative disease. Selected patient and tumor characteristics according to central assessment of HER2 status are depicted in Table 2. The median age at the time of trastuzumab initiation was 57 years (range, 28 to 95 years), with patients carrying HER2-negative tumors being older (Wilcoxon rank-sum p=0.041). Most patients had relapsed metastatic BC (R-MBC), while 31.5% had de novo metastatic disease.
2. Trastuzumab exposure
In total, 86% of the study cohort received trastuzumab as first-line treatment (59 HER2-negative and 113 HER2-positive), while 12.5% of patients were treated with second line trastuzumab (16 HER2-negative, 9 HER2-positive). Additionally, in three patients with HER2-negative tumors, trastuzumab was administered as a third-, fourth-, and seventh-line treatment, respectively. In 90% of patients, trastuzumab was given with concurrent chemotherapy (66 HER2-negative and 114 HER2-positve), while 16 patients (8%) received trastuzumab in combination with hormone therapy and in four patients (2%) the drug was administered as monotherapy.
3. Distribution of examined markers
The expression of VEGFA, VEGFC, VEGFR1, VEGFR2, and VEGFR3 in the neoplastic cells was cytoplasmic. No membranous staining was observed. Nuclear expression was observed in 42.6% (20 of 47 informative cases) for VEGFA, 35% (62 of 177 informative cases) for VEGFC, 42.5% (82 of 193 informative cases) for VEGFR1, 64.6% (122 of 189 informative cases) for VEGFR2, and 17.9% (19 of 106 informative cases) for VEGFR3. For all immunohistochemically examined parameters, except VEGFC, the Allred score values ranged from 0–8, the median Allred score value was 6, and the mean ranged from 5.75–6.02. For VEGFC the Allred score values ranged from 3–8, the median value was 7 and the mean 6.84. Using the median value as a cutoff, high expression (greater than the median) of VEGFA, VEGFC, VEGFR1, VEGFR2, and VEGFR3 in tumor cells was observed in 43.5%, 24.2%, 36%, 29.5%, and 43%, respectively. Stromal elements, namely lymphocytes, plasma cells and endothelial cells, displayed expression of VEGFA, VEGFC, VEGFR1, VEGFR2, and VEGFR3 in 78.9%, 93.3%, 90.7%, 90.2%, and 74.8% of patients with available data, respectively. The frequency distribution of tumor and stromal expression was similar in patients with HER2-positive and HER2-negative disease (S1 Table). mRNA expression of the examined markers was available for tumors of 60 patients (30%) and did not differ between patients with HER2-positive and HER2-negative disease. Tumors from patients with de novo metastatic BC had higher VEGFxa mRNA expression (Wilcoxon rank-sum p=0.008), as compared to those with R-MBC, and expressed less frequently tumor VEGFC and stromal VEGFR1 (chi-square p < 0.001 and p=0.019, respectively) (S2 Table). No differences in the distribution of the examined markers were detected between patients with ER/PR-positive and negative tumors (data not shown).
4. Association with clinicopathological characteristics and other markers of interest
Patients with VEGFR1-high tumors had more frequently visceral metastases in comparison to the VEGFR1-low BCs (p=0.008). VEGFR2-low tumors were more frequently of higher grade, with loss of PTEN and higher JAK2 mRNA expression compared to VEGFR2-high tumors (p=0.033, p=0.033, and p=0.016, respectively). VEGFR3-high expression was associated with pHER2Tyr877 protein expression and preservation of PTEN (p=0.029 and p=0.004, respectively). Patients carrying tumors with high tumor VEGFC expression compared to those with low VEGFC expression were of younger age at the time of trastuzumab administration and less frequently of postmenopausal status (p=0.031 and p=0.001, respectively). Tumors with high tumor VEGFA expression had more frequently positive pHER2Tyr1221/1222 (p=0.019) and HER3 protein expression (p=0.004) and PTEN preservation (p=0.027). Tumors with stromal VEGFR3 high expression had lower mRNA levels of JAK2 and higher levels of HER2 (p=0.007 and p=0.005, respectively) (Table 3). In addition, VEGFA mRNA expression was positively, marginally correlated with Src (rho=0.27, p=0.045) and VEGFR1 mRNA expression was positively correlated with HER2 mRNA expression (rho=0.33, p=0.015). Positive correlations were also observed between VHL mRNA expression and Src (rho=0.42, p=0.012), CDKN1B (rho=0.37, p=0.006), JAK2 (rho=0.28, p=0.044), HER2 (rho=0.38, p=0.005), HER3 (rho=0.44, p < 0.001), and HER4 mRNA (rho=0.33, p=0.016). However, none of these correlations were strong. No further significant associations were detected between the expressions of examined markers and patient characteristics or other markers of interest.
We further examined potential associations between expression of the examined markers in the neoplastic cells. Tumors with high VEGFR1 expression had less frequently low tumor expression of VEGFR2 (p=0.014), VEGFR3 (p=0.003), and VEGFA (p=0.043) as compared to tumors with low VEGFR1 expression. In addition, tumors with low expression of VEGFR3, as compared to those with high expression, had more frequently low expression of VEGFR1 (p=0.003), VEGFR2 (p=0.012), VEGFC (p=0.006), and VEGFA (p < 0.001) (Table 4). Co-expression of tumor VEGFR1 and VEGFR2 was noticed in 26 tumors (15.1%), VEGFR1 and VEGFA in 35 tumors (19.3%), VEGFR2 and VEGFA in 26 tumors (15.3%), and VEGFR3 and VEGFA in 45 tumors (25.1%).
5. Association of markers with clinical outcome
Within a median follow-up of 13.3 years (95% CI, 12.8 to 14.4), a total of 180 events of progression or death (PFS events) were reported and 168 patients (84%) died. The median PFS was 11.5 months (95% CI, 9.6 to 14.0). Patients with HER2-positive tumors had longer PFS compared to those with HER2-negative disease (median PFS, 14.0 months [95% CI, 11.0 to 19.6] vs. 8.9 months [95% CI, 7.8 to 10.7]; log-rank p=0.018). The median survival was 3.4 years (95% CI, 2.9 to 3.9) and was significantly longer for patients with HER2-positive compared to those with HER2-negative tumors (median survival, 4.0 years [95% CI, 3.1 to 5.0] vs. 2.9 years [95% CI, 2.3 to 3.4]; log-rank p=0.010).
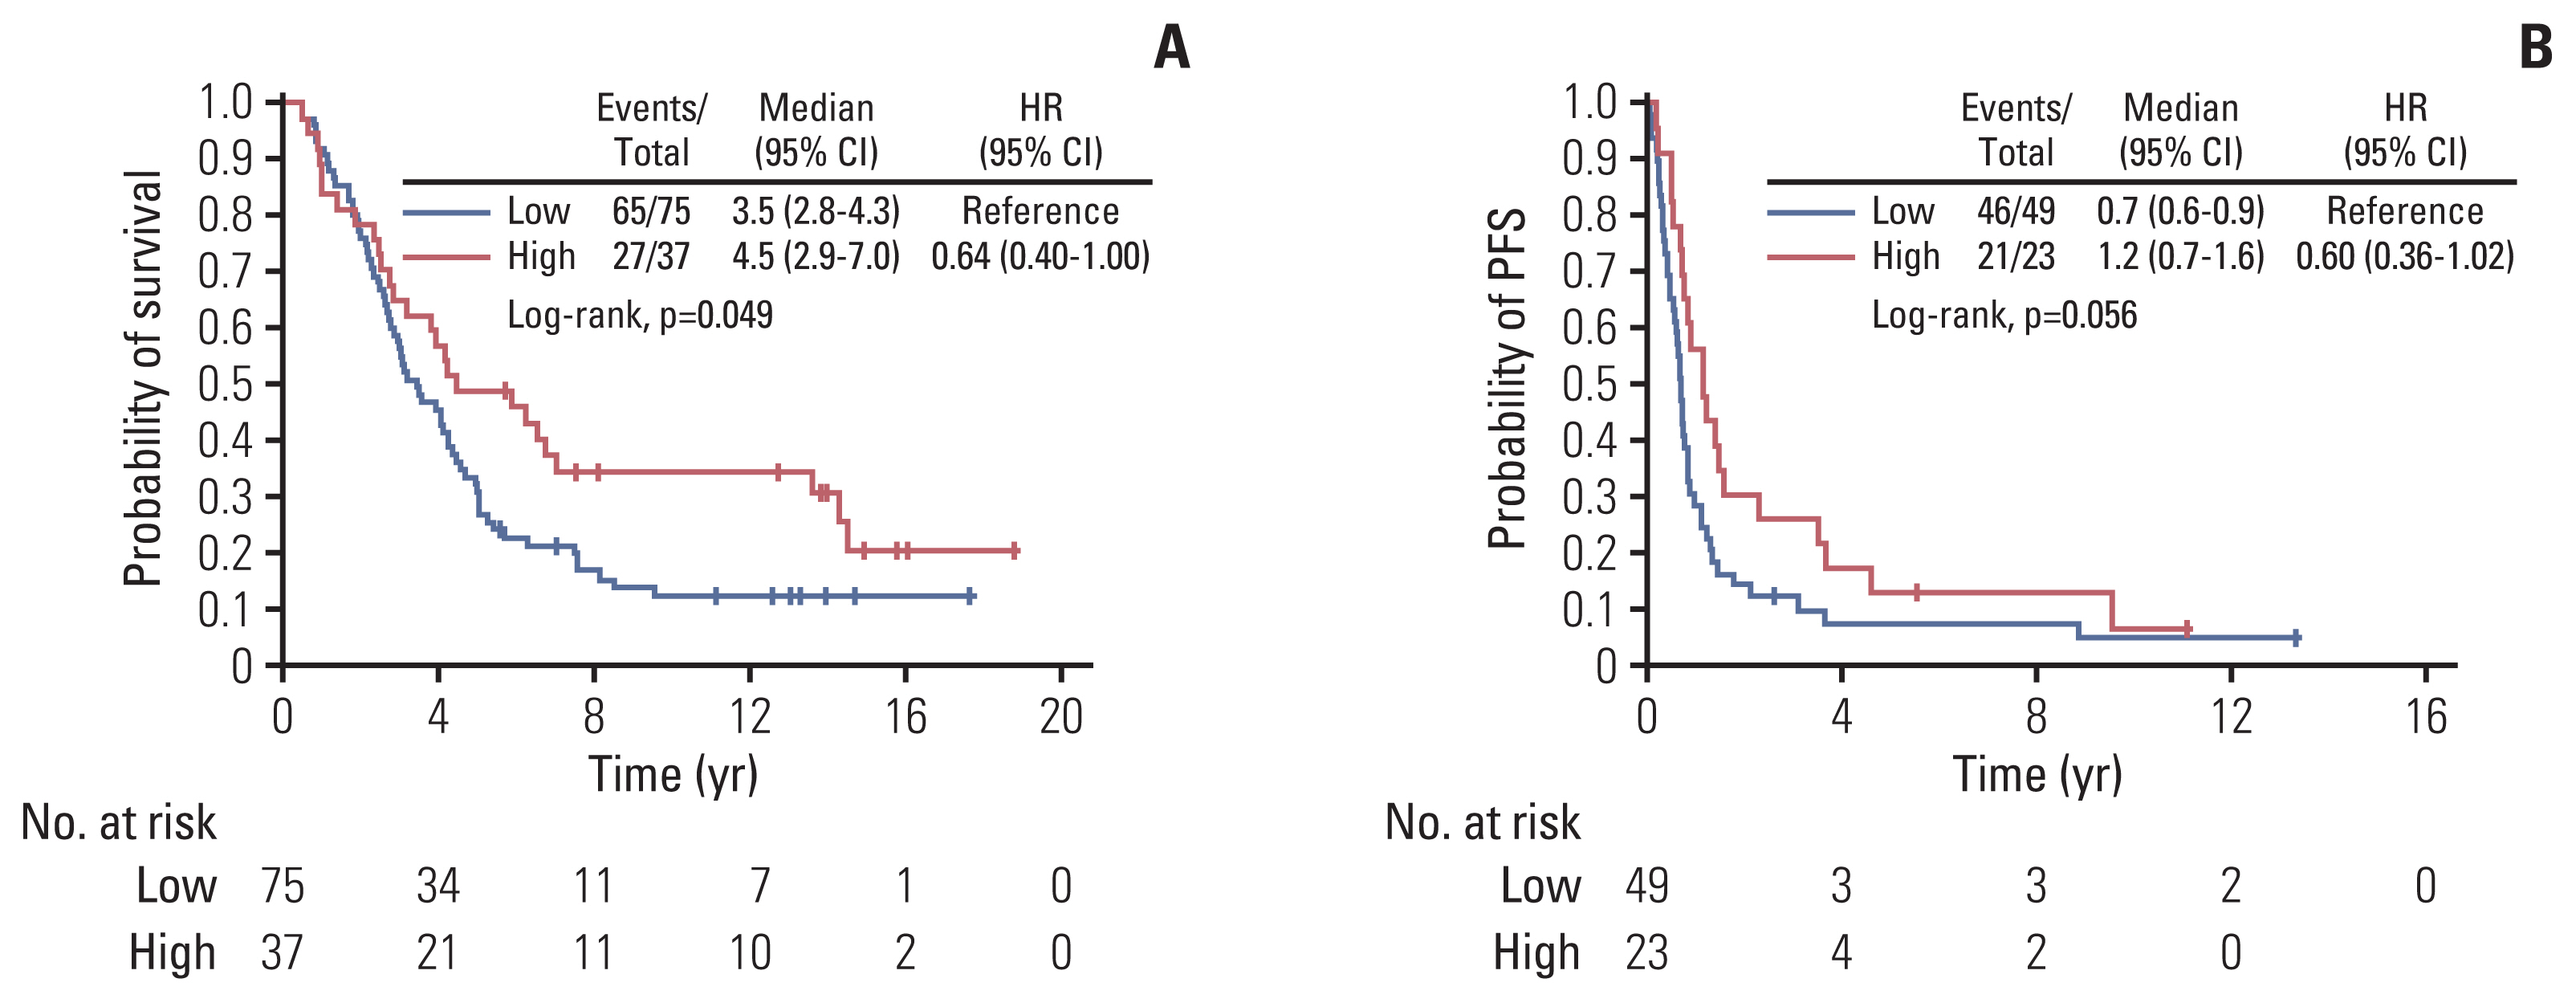
Among patients with HER2-positive BC, none of the examined markers showed prognostic significance for PFS univariately, whereas high VEGFR1 expression in the tumor cells was marginally associated with longer survival (HR, 0.64; 95% CI, 0.40 to 1.00; Wald’s p=0.051) (Fig. 1A). In multivariate analysis, high expression of VEGFR1 remained a favorable prognostic factor for survival among patients with HER2-positive tumors (HR, 0.55; 95% CI, 0.34 to 0.88; p=0.013) along with 1–2 PS (HR, 0.58; 95% CI, 0.37 to 0.93; p=0.025), while menopausal status, ER/PR status and the number of metastatic sites were removed from the final model (p=0.23, p=0.51, and p=0.16, respectively).
A trend towards longer PFS was detected in univariate analysis for patients with HER2-negative tumors and high tumor expression of VEGFR2 (HR, 0.60; 95% CI, 0.36 to 1.02; p=0.059) (Table 5, Fig. 1B). However, high expression of VEGFR2 was not found to be prognostic for PFS upon adjustment for selected clinicopathological parameters (p=0.19).
Tumor co-expression of VEGF1/VEGFR2, VEGFR1/VEGFA, VEGFR2/VEGFA, and VEGFR3/VEGFA did not show prognostic significance either among patients with HER2-positive tumors or among those with HER2-negative disease (Table 5).
Discussion
Over the last decades, the clinical course of metastatic BC has been transformed most remarkably via HER2 targeting. Although many aspects of HER2-positive BC and trastuzumab effects are illuminated, the clinical significance of angiogenesis in patients treated with trastuzumab-based regimens is still unclear. In this study, we assessed the protein and gene expression of pivotal angiogenesis-related molecules with regards to their interrelations and prognostic value in metastatic BC patients, treated with trastuzumab.
A major finding of this study was the correlation of VEGFR1 immunohistochemical expression by tumor cells with prolonged survival, in HER2-positive patients. Similarly, Lebok et al. [12] have reported that reduced or lost membranous expression of VEGFR1 in BC patients is associated with poor prognosis, and a previous study from our group found that VEGFR1 mRNA expression had prognostic value, depending on HER2 status, in patients with high-risk early BC treated in the adjuvant setting [8]. On the contrary, Ghosh et al. [13], using data from a cohort of 642 cases with primary breast carcinomas treated with a combination of surgical excision with or without local irradiation and/or hormonal therapy, have reported that high levels of VEGFR1 were significantly associated with decreased OS. In addition, Kosaka et al. [14] have shown that increased VEGFR1 mRNA levels in peripheral blood of BC patients with stage 0 to III disease and positive or negative ER/PR/HER2 status, who underwent surgery, are associated with larger tumor size, lymph node (LN) infiltration, advanced clinical stage as well as with poor survival outcome. Along these lines, a previous report from our group of 124 metastatic HER2-negative BC patients found that high expression of VEGFR1 was associated with poor survival in multivariate analysis [9]. The above findings highlight the biological heterogeneity of BC and suggest that in the various intrinsic subtypes of BC, importantly based on HER2 status the effect of angiogenesis-related factor may differ.
Another interesting finding was the significant association of VEGFR1 tumor expression with visceral metastases. The role of VEGF/VEGFR axis in the development of metastases is supported by many studies. Interestingly, Ning et al. [15], some years ago, showed that the activation of VEGFR1 can induce epithelial-mesenchymal transition (EMT), promoting migration and invasion of BC cells. Previously, it had been documented that VEGF and its receptors VEGFR1 and 2 exert an osteolytic role in bone metastases from BC [16]. Furthermore, Kaplan et al. [17], using a mouse model, have shown that VEGFR1-positive bone marrow-derived hematopoietic progenitor cells participate in the formation of tumor-specific pre-metastatic sites. More recently, Sadremomtaz et al. [18] published that dual blockade of VEGFR1 and VEGFR2 by a novel peptide can stop VEGF-driven metastasis via manipulation of PI3K/AKT and MAPK/ERK1/2 signaling pathways. Although the association of VEGFR1 with increased visceral metastases seems contradictory to the associated increased survival, it may not be so in the setting of HER2-positive tumors treated with trastuzumab, further referring to the association of HER2 pathways and angiogenesis blockade, namely via the PI3K/AKT and MAPK/ERK1/2 pathways. In a study of angiogenesis in early BC, VEGFR1 was associated with better disease-free survival in ER/PR-positive BC but worse disease-free survival in triple-negative BC but no statisitical significance was observed to HER2-positive BC [19]. The varying results compared to the present work, introduce the question of heterogeneity of angiogenesis-related parameters and their significance in early versus advanced/metastatic BCs stemming from the associated clonal evolution of tumors. These findings point to the following hypothesis: the expression of angiogenesis-related parameters and their significance may vary among both the various intrinsic subtypes and the stage of BC. The question may be addressed in larger cohorts of early or metastatic BC, along with the immune profile of tumors, in light of the combinations of treatment modalities, particularly in metastatic BC [20].
Also interesting was the marginally significant association of tumor VEGFR2 expression with improved PFS in patients with HER2-negative tumors. This is the first report according to our knowledge, which implicates VEGR2 in the clinical outcome of HER2-negative patients. In preclinical mouse models of HER2-amplified BC brain metastasis, combined targeting of HER2 (trastuzumab and lapatinib) with an anti-VEGFR2 antibody significantly reduced tumor growth prolonging median OS 5-fold [21]. Yan et al. [22] have reported that VEGFR2 expression in BC was positively correlated with LN metastasis and negatively with OS. In addition, in the same study, higher VEGFR2 expression was associated EMT markers (such as Twist1 and Vimentin), implicating VEGFR2 in EMT of BC. Thus, the prognostic value of VEGFR2 in trastuzumab-treated BC remains to be further clarified in larger studies.
Discordance between local and central evaluation of HER2, as observed herein, have been previously reported from our group [10,23] and others [24–26]. Central assessment of the first 104 cases enrolled in the National Surgical Adjuvant Breast and Bowel Project (NSABP) Protocol B-31 (NSABP B-31) did not confirm the community-based initial evaluation in 18% of cases [24]. Similarly, in the N9831 trial of 119 patients, there was poor concordance (74%) between local and central testing for HER2 [25]. More recently, Griggs et al. [26], on a cohort of 367 patients, reported that HER2 discordance by IHC between local and central laboratories was 26%. Interestingly, 4% of patients initially characterized as negative were finally positive upon retesting [27]. These observations support the necessity of centralization of HER2 testing in order to maximize the number of patients appropriately treated with trastuzumab, who will experience clinical benefit, minimizing concurrently those who will face side effects without any benefit.
Despite the promising results of the current study, we have to acknowledge some limitations. A weakness of our study is that it has been performed based on the analysis of retrospectively collected data, and in a relatively small cohort. Another weakness relates to the heterogeneity of the cohort with regards to trastuzumab exposure. Moreover, a two-phase design should also be used to validate the value of the studied biomarkers.
To conclude, our findings suggest that angiogenesis-related factors may have significant prognostic value for BC patients with metastatic disease treated with transtuzumab-based regimens. It seems that VEGFR1 and VEGFR2 are the most promising markers, however, more studies are needed to further define their potential clinical value.