Introduction
T-cell lymphoblastic lymphoma (T-LBL) is an aggressive subtype of non-Hodgkin lymphoma, characterized by male predominance and a high frequency of mediastinal tumor [1,2]. Although pediatric-derived, intensive lymphoblastic leukemia-like protocols significantly prolong survival, many patients continue to fail to achieve a response or suffer relapse [3,4]. In addition, there is no optimal prognostic model for T-LBL. Conventional markers of tumor burden, including Ann Arbor stage, International Prognostic Index (IPI), serum lactate dehydrogenase (LDH), bulky disease and bone marrow involvement, have been reported to be prognostic in limited studies [4–6]. Therefore, there remains an urgent need to identify new prognostic factors and accurate risk stratification to develop individualized treatment strategies for T-LBL.
18Fluorine fluorodeoxyglucose positron emission tomography–computed tomography (FDG PET-CT) has been adopted by the 2014 International Conference on Malignant Lymphoma imaging consensus guidelines as a powerful tool in the staging and response assessment of FDG-avid lymphoma [7]. Recently, new promising parameters measured on baseline positron emission tomography–computed tomography (PET-CT), including total metabolic tumor volume (TMTV), and total lesion glycolysis (TLG), which estimate both tumor burden and metabolism, have been shown to be significantly related to inferior progression-free survival (PFS) and/or overall survival (OS) in diffuse large B-cell lymphoma (DLBCL), primary mediastinal large B-cell lymphoma, Hodgkin lymphoma (HL), follicular lymphoma (FL), peripheral T-cell lymphoma (PTCL), and extranodal natural killer/T cell lymphoma (NKTCL) [8–15].
The current study aims to determine whether the TMTV and TLG evaluated by PET-CT are capable of predicting survival in T-LBL, and to generate a risk model for T-LBL patients to identify those with a high risk of disease relapse.
Materials and Methods
1. Patients and characteristics
From January 2013 to December 2018, 37 patients with treatment naïve T-LBL, who underwent baseline FDG PET-CT, were included in this retrospective study. All patients were diagnosed according to the 2016 World Health Organization Classification of Tumors of Hematopoietic and Lymphoid Tissues. Response assessment was made according to The International Working Group response criteria [16].
2. PET-CT parameters
All patients underwent FDG PET-CT before the initiation of chemotherapy. PET-CT scans were performed after at least six hours of fasting. Blood glucose was required to be lower than 11.1 mmol/L before initiation. Sixty minutes after the administration of 3.7–4.4 MBq/kg of 18F-FDG, images were acquired from the skull base to the upper thighs using a delicate scanner (Siemens Biograph 64 True point PET-CT, Erlangen, Germany). Computed tomography images were acquired at 130 mAs, 130 kV, and a slice width of 8 mm per rotation performed for the attenuation correction of PET scan. Corrected emission data images were reconstructed after Fourier transformation with AWOSEM software (2 iterations, 8 subsets, 5 mm Gaussian filter).
All PET-CT scans were reviewed and computed by two board-certified nuclear medicine physicians blinded to the patient’s clinical outcome. For the target lesions of FDG tracer uptake, a standardized uptake value (SUV) of ≥ 2.5 as the contouring border was considered to represent lymphoma, as suggested by Freudenberg et al. [17]. Notably, the automatically estimated lesion boundaries were partly manually redrawn to exclude physiological cardiac activity. Dedicated software (Syngo TrueD, Siemens) automatically estimated the average and maximum SUV (SUVmean and SUVmax) and metabolic tumor volume (MTV) of each lesion, which was obtained by using an isocontour threshold method based on the 41% SUVmax method as recommended by the European Association of Nuclear Medicine [18]. The highest baseline SUVmax of all lesions was considered the SUVmax of the patient. TMTV was measured as the sum of the MTVs of all nodal and extranodal lesions. Bone marrow was included in TMTV measurement when there was focal uptake. TLG was measured as MTV multiplied by the average SUV of each lesion, and then total TLG was obtained by summing TLG of all lesions.
3. Statistical analysis
Receiver-operating characteristic (ROC) analysis was used to determine optimal cutoff values for SUVmax, TMTV and TLG based on survival prediction. The characteristics of the patients were compared using Fisher’s exact test or chi-square test for discrete variables, and t test or Mann-Whitney test for continuous variables. PFS was calculated from diagnosis to the date of first disease progression, relapse, death or the date of last follow-up. OS was calculated from diagnosis to the date of death from any cause or to the date of last follow-up. Survival curves were plotted according to the Kaplan-Meier method and differences between groups were analyzed using a two-tailed log rank test. Those with a p-value less than 0.1 in the univariate regression were included into the multivariable prognostic analyses, and Cox regression with a forward LR model was used to estimate the hazard ratio (HR). All statistical analyses were performed using SPSS ver. 25.0 software (IBM Corp., Armonk, NY), and p < 0.05 was considered to be statistically significant.
Results
1. Patient characteristics
Thirty-seven treatment naïve T-LBL patients who underwent baseline PET-CT scans were included in this study. Among these patients, 29 patients (78.4%) were male, and the median age was 22 years old, with a range of 12–75 years. Furthermore, among these patients, 32 patients were in stage III–IV, 12 patients (32.4%) had bone marrow involvement verified by bone marrow biopsy, and 17 patients had a mediastinum bulky mass > 7.5 cm in diameter. In addition, 17 patients (45.9%) were given cyclophosphamide, vincristine, doxorubicin, and dexamethasone (Hyper-CVAD) alternating with high-dose methotrexate and cytarabine (MA) chemotherapy, while the remaining 20 patients received a modified BFM-90 regimen [3], an adapted pediatric-like acute lymphoblastic leukemia protocol. Moreover, 10 patients underwent hematopoietic stem cell transplantation after remission, which included two autologous and eight allogenic stem cell transplantations. The detailed patient characteristics are outlined in Table 1.
The median follow-up time was 26.5 months (range, 7.5 to 65 months). At the time of the analysis, 26 patients (70%) had disease progression, while 17 patients (46%) died from T-LBL. A total of six patients (19%) died within the first 6 months.
2. PET-CT parameters
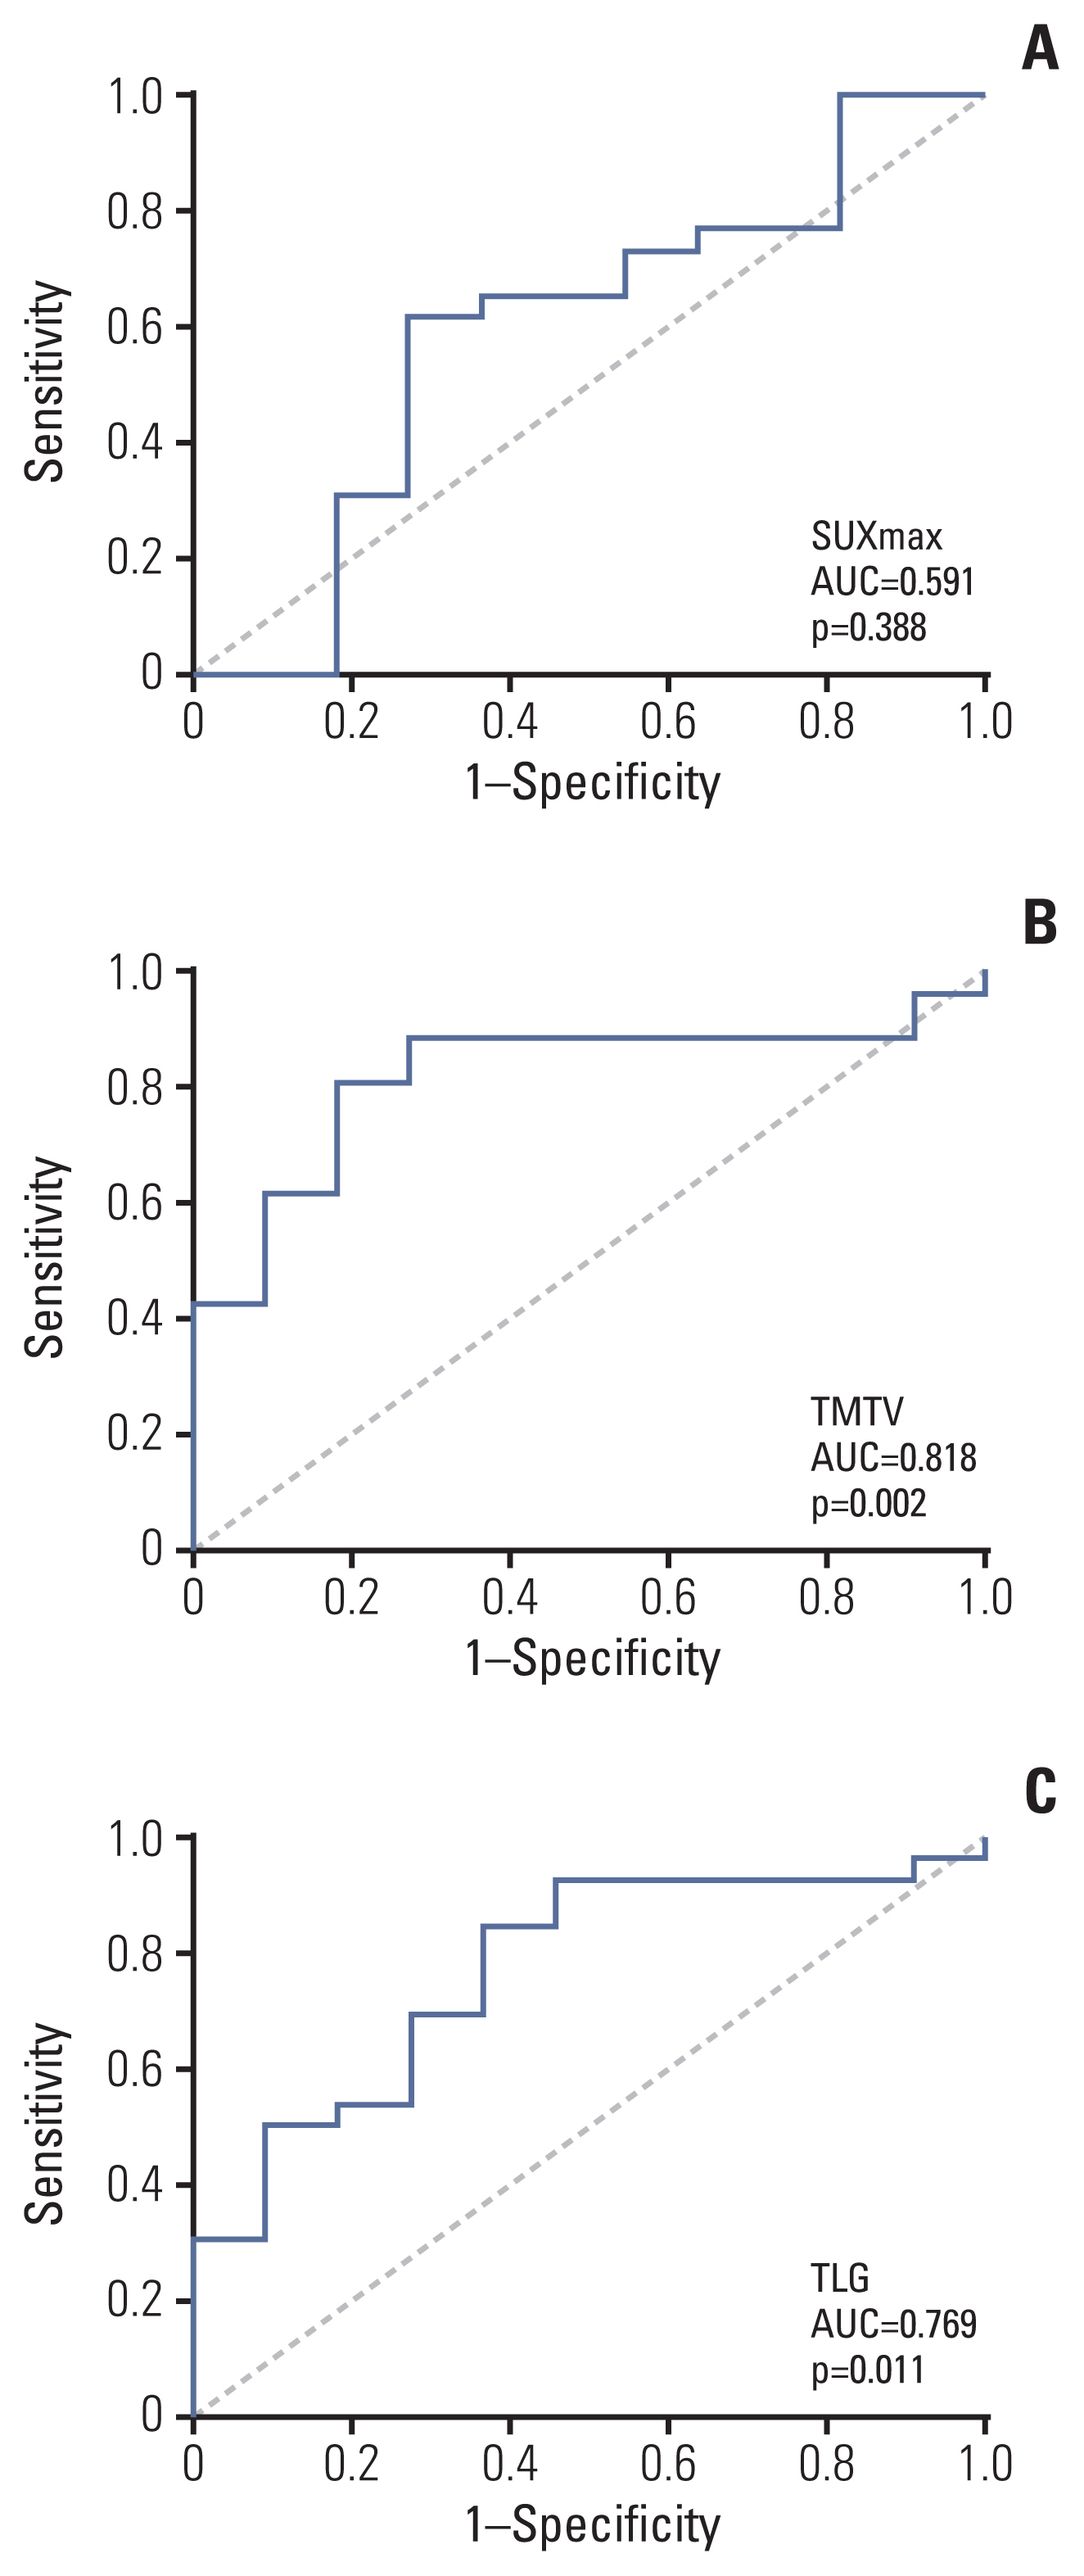
The median SUVmax, TMTV, and TLG were 10.80, 383.00 cm3, and 1,644.20, respectively, with ranges of 3.70–29.70, 55.10–2,053.80 cm3, and 115.80–18,132.40, respectively. The area under the ROC curve was 0.591 (p=0.388), 0.818 (p=0.002), and 0.769 (p=0.011) for SUVmax, TMTV, and TLG, respectively (Fig. 1). The ROC curves were used to determine the optimal cutoff value for each parameter based on PFS and OS analysis. A cutoff of 12.70 (sensitivity, 46.20%; specificity, 72.70%), 302 cm3 (sensitivity, 88.50%; specificity, 72.70%) and 890 (sensitivity, 84.60%; specificity, 63.60%) was selected for SUVmax, TMTV, and TLG, respectively.
The presence of a high SUVmax (≥ 12.7) was significantly associated with a higher IPI and lower hemoglobin, while patients with high TMTV and TLG were more likely to have more than two sites of extranodal involvement. However, these three indicators were not significantly correlated with bulky disease. Comparisons of patient characteristics according to PET-CT parameters are shown in S1 Table.
3. Clinical and biological parameters
By the end of follow-up, there were 30 evaluable patients. Among them, 12 (40%) had achieved complete response, 11 (36.7%) had achieved partial response, and seven (23.3%) experienced disease progression. However, there was no difference in the overall response rate between the different PET-CT parameter groups.
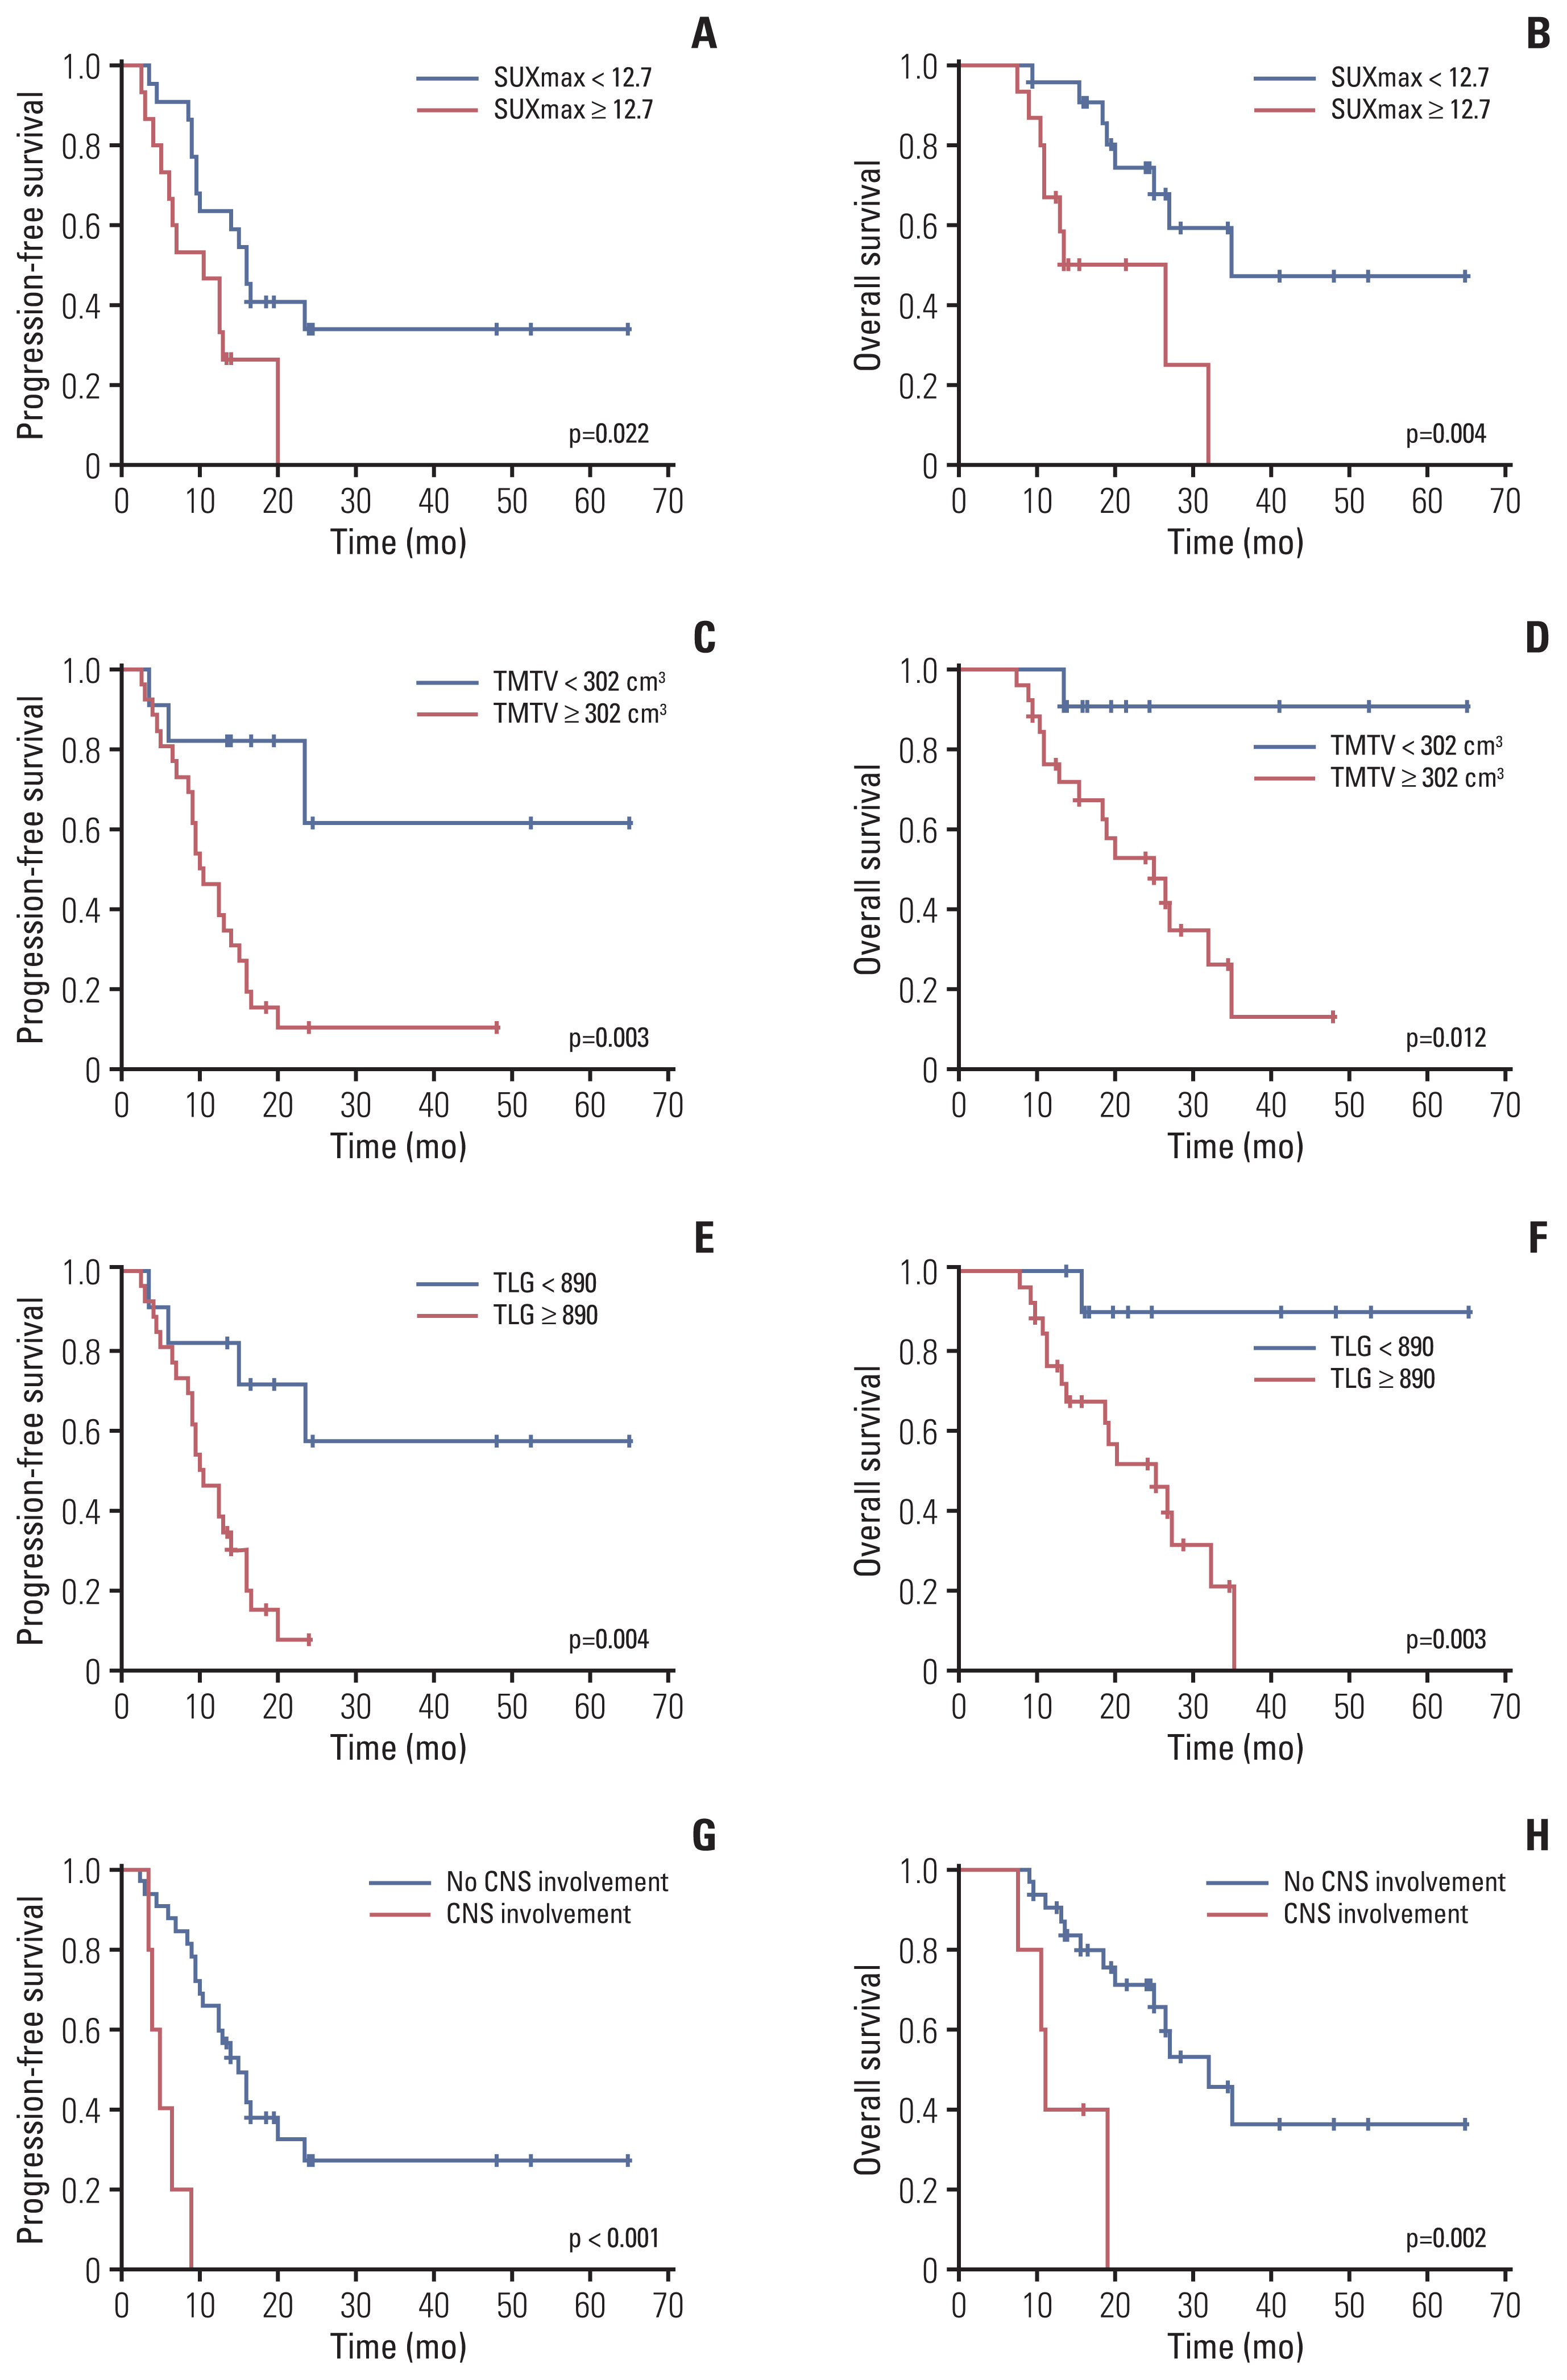
The Four-year PFS and OS of the entire cohort were 23.3% and 32.2%, respectively (S2 Fig.). Patients with a high SUVmax had significantly shortened PFS and OS (median PFS, 10.5 months vs. 16.0 months; p=0.022; hazard ratio [HR], 2.54 and median OS, 13.5 months vs. 35.0 months; p=0.004; HR, 4.16). At a cutoff value of 302 cm3, 26 patients with a high TMTV experienced significantly worse outcomes, with a 3-year PFS and OS of 10.3% and 26.1% vs. 61.4% and 90.9% for patients with low TMTV (p=0.003 for PFS; HR, 5.19 and p=0.012 for OS; HR, 8.77). In addition, patients with a high TLG also had shortened PFS and OS (3-year PFS, 7.6% vs. 57.3%; p=0.004; HR, 4.53 and 3-year OS, 31.6% vs. 90.0%; p=0.003; HR, 12.24) (Fig. 2). When only patients with advanced disease were included, the prognostic value of SUVmax, TMTV, and TLG remained significant (S3 Fig). Meanwhile, central nervous system (CNS) involvement was also shown to be closely related to worse clinical outcome in the univariable analysis (median PFS, 5.0 months vs. 15.0 months; p < 0.001; HR, 8.80 and median OS, 11.0 months vs. 32.0 months; p=0.002; HR, 5.88) (Fig. 2). However, the Ann Arbor stage, IPI, presence of B symptoms, bulky disease, treatment regimens, and transplantation did not predict survival (Table 2).
Interestingly, the TMTV identified patients with earlier treatment failure. The 1-year PFS was 81.8% for patients with TMTV < 302 cm3 vs. 15.4% for those with a TMTV of ≥ 302 cm3. Among the 16 patients who progressed within one year, 87.5% had a high TMTV, compared with 57.1% of the 21 patients who remained progression-free for at least 1 year (p=0.045).
4. Combining PET-CT parameters with clinical indicators
In the multivariable analysis, a high TMTV (HR, 4.746; p=0.015) and CNS involvement (HR, 5.309; p=0.006) were identified as independent risk factors for PFS, while a high SUVmax (HR, 3.170; p=0.035), high TLG (HR, 9.253; p=0.039) and CNS involvement (HR, 5.880; p=0.007) predicted worse OS (Table 3).
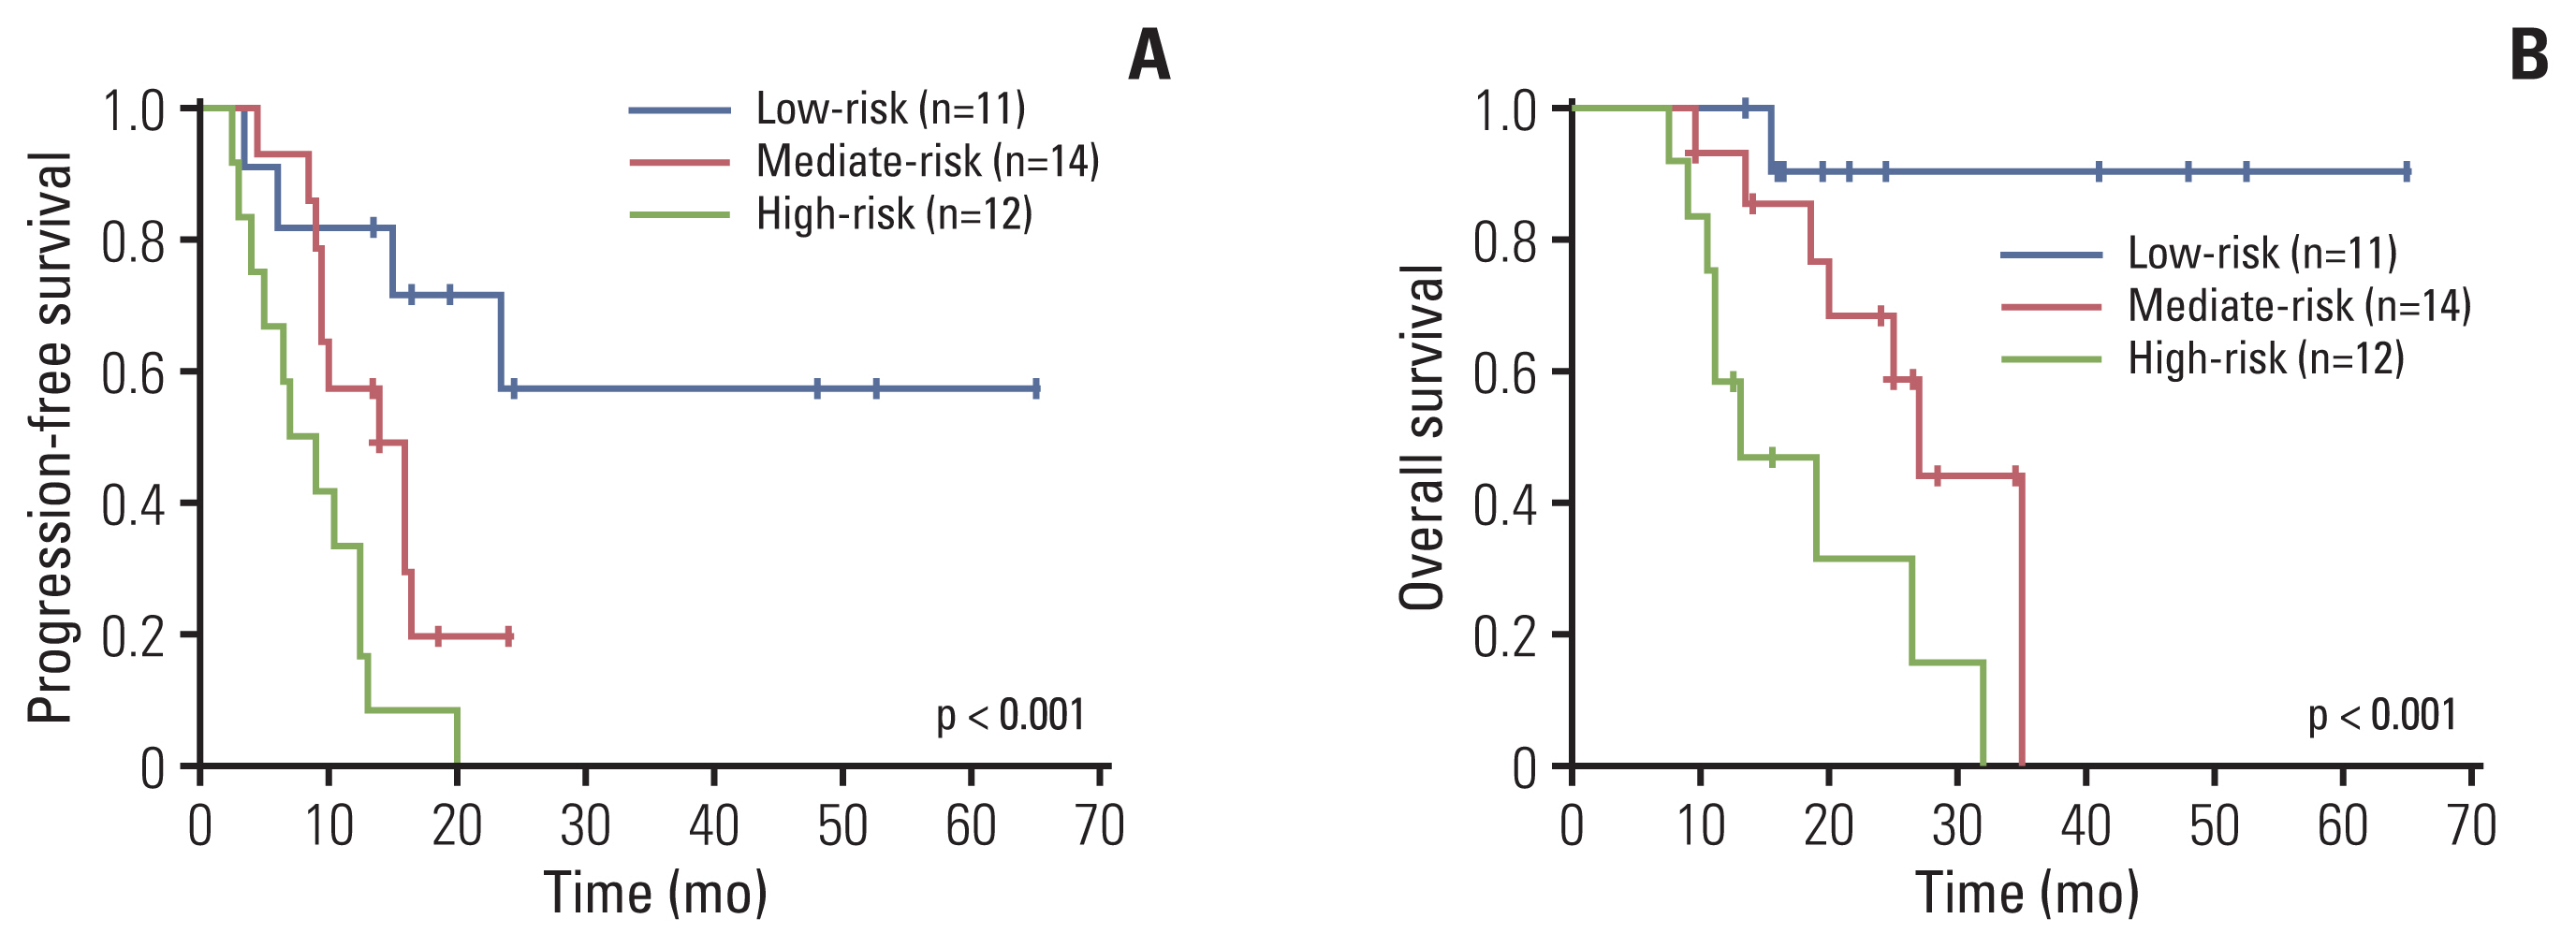
Subsequently, we developed a risk model comprising SUVmax ≥ 12.7, TMTV ≥ 302 cm3, TLG ≥ 890, and CNS involvement, with each indicator ranking 1 score, which stratified the cohort into three risk groups: group 1, the low-risk group (n=11), which included patients with a score of 0–1; group 2, the mediate-risk group (n=14), which included patients with a score of 2; and group 3, the high-risk group (n=12), which included patients with a score of 3–4. These groups had significantly different median PFS of not reached, 14 months and 7 months, respectively (group 1 vs. group 2, p=0.060; group 1 vs. group 3, p < 0.001; group 2 vs. group 3, p=0.026). The median OS for each group were not reached, 27 months and 13 months, respectively (group 1 vs. group 2, p=0.034; group 1 vs. group 3, p=0.001; group 2 vs. group 3, p=0.020) (Fig. 3).
Discussion
The present study revealed that high baseline SUVmax, TMTV, and TLG predict a worse outcome in T-LBL. Additionally, TMTV identifies patients at high risk of early progression. In combination with CNS involvement, these PET-CT parameters stratified T-LBL patients into three risk groups with significantly different clinical outcomes. As far as we aware, this is the largest cohort involved in the discussion of the utility of PET-CT in T-LBL.
PET-CT has been widely utilized for the staging and response evaluation of FDG-avid lymphoma [19–22]. Recently, the prognostic role of TMTV and TLG in various lymphomas has been demonstrated, including HL, DLBCL, FL, PTCL, and NKTCL. Furthermore, the combination of baseline PET-CT parameters with the Deauville score evaluated in interim and end-of-treatment PET-CT, the molecule profile, and the follicular lymphoma IPI (FLIPI) or PTCL (prognostic index for PTCL-U, PIT) score more significantly separated patient categories, than PET-CT parameters alone [13,14,23–28]. However, the utility of PET-CT has not been widely discussed and remains controversial in T-LBL due to its rarity. In the post induction phase of the German multicenter ALL (GMALL) trial, the positron emission tomography (PET) results were significantly associated with the response obtained after consolidation I [29], while in the GRAALL-Lysa study, the PET results did not predict a long-term survival [4]. Another earlier study explored the prognostic role of TMTV, TLG, and SUVmax in T-LBL, and revealed that a high SUVmax predicted a longer PFS and OS, while TMTV, TLG, and the Deauville score were not associated with survival [30]. However, there are pitfalls in this study: First, the PET-CT data were acquired from multicenter studies over a long time period with different scanners and protocols, which may have affected the stability of SUV and TMTV. Second, all patients enrolled in the study received corticosteroids before the PET-CT scan, which could influence FDG acquisition. Furthermore, the conclusion that a high SUVmax predicted a superior outcome could have resulted from the bias of oncogenic markers, and multivariate survival analysis was not performed.
TMTV is a measurement of the viable fraction of all tumor sites, and is a better predictor of survival than bulky disease. Although no correlation was found between TMTV or TLG and bulky disease, this study revealed that patients with high TMTV or TLG were more likely to have more than two sites of extranodal involvement. In the univariable survival analysis, a high SUVmax, TMTV, and TLG were significantly correlated with worse outcome, regardless of the treatment regimens and transplantation. More specifically, patients with a high TMTV had a 3-year OS of 26.1%, while those with a low TMTV had an OS of 90.1%. Furthermore, TMTV was further found to be correlated with early progression within one year, highlighting its importance in the clinical treatment of T-LBL. In addition, CNS involvement was found to be another independent indicator in the present cohort, regardless of whether CNS prophylaxis was routinely administered for all patients.
Pretherapy surrogate markers of tumor burden, including Ann Arbor stage, IPI, serum LDH, and tumor bulk, are routinely employed to stratify patients with lymphoma. However, these indicators are imperfect, and the IPI appears to have lost its prognostic value in T-LBL. In the GRAALL/Lysa study, NOTCH1/FBXW7 mutation and/or the absence of RAS/PTEN mutation/deletion were demonstrated to predict longer event-free survival and OS [4,31]. In the present study, a risk model that combined three PET-CT parameters with CNS involvement was generated, and three risk categories could be distinguished, with the high-risk group having a median PFS and OS of seven months and 13 months, respectively. Since only 37 patients were enrolled in the present cohort, there were still significant differences among groups. To the best of our knowledge, our study is the first to promote a risk model that combined PET-CT parameters with clinical factors to identify patients at high risk of early relapse or progression. However, this proposed model must be validated in a seperate large and independent cohort to confirm its prognostic value.
In addition to the baseline PET-CT parameters, the Deauville score and reductions in SUVmax, TMTV, and TLG acquired in interim PET-CT have also been demonstrated to be prognostic for HL, FL, DLBCL, and PTCL [24,26]. In the present study, 20 patients underwent PET-CT scans after induction therapy, which revealed that no correlation was found between the Deauville score or SUVmax reduction and survival (data not shown). Given the limited number of evaluable patients in present study, a larger population is warranted to obtain more solid results.
Together with the T-LBL in the present study, the importance of TMTV has also been exhibited in various other lymphomas. However, more questions have been raised regarding its clinical application: How can the most accurate method or the optimal cutoff of TMTV be defined for specific lymphoma subtypes? Is it possible to offer patients with a high TMTV more aggressive therapies, while sparing patients with low TMTV the adverse effects? Is the same drug concertation enough for patients with very different TMTV, but with the same body surface area? Is there any better combination of indicators, such as the mutation of oncogenic markers, molecule profile, circulating tumor cells, or DNA, that can identify patients at high risk of disease progression or early death?
Due to the absence of a recognized gold standard for assessing these parameters and the different machines and software used in different institutions, the determination of optimal cutoff values remains to be resolved and will require prospective validation. Similar to previous retrospective studies, our study included a small number of patients and was conducted in a single center, therefore the proposed model combining PET-CT parameters and CNS involvement requires validation in another independent data set.
To date, the present study represents the largest series of T-LBL with an analysis of PET-CT functional parameters, which revealed that SUVmax, TMTV, and TLG are significantly associated with clinical outcome. Combined with CNS involvement, these parameters are capable of precisely predicting patients at high risk of progression or relapse, although the proposed model needs to be validated in other studies.