Introduction
Gastric cancer (GC) is the fifth most common cancer and the third leading cause of death worldwide [1], and the third most common and fourth leading cause of death in Korea [2]. Although the survival rate of patients with GC has increased with appropriate screening systems and improvements in surgery and chemotherapy, patients with unresectable advanced or recurrent GC (UAR-GC) still have a poor prognosis.
The main sites of distant metastasis in GC are the peritoneum, liver, and distant lymph nodes (LNs). Bone metastasis (BM) is relatively rare in GC. In patients with curatively resected GC, 1.2%-1.8% have been reported to develop BM [3,4]. Among patients with UAR-GC, the incidence of BM has been reported to be approximately 10% [5,6]. Additionally, the frequency of BM in GC patients is 13.4%-15.9% in the autopsy series. These findings suggest that asymptomatic BM is underestimated and that the incidence of BM in clinical cases may be much higher than that previously reported [7]. Importantly, UAR-GC patients with BM are known to have distinct clinicopathological characteristics and a poor prognosis compared to UAR-GC patients without BM [6,8]. The response to chemotherapy is transient, and disseminated intravascular coagulation is frequently observed in UAR-GC with BM [9-11]. Therefore, UAR-GC with BM is expected to have different genetic alterations than UAR-GC without BM; however, this is yet to be revealed.
The aim of this study was to investigate the genomic and transcriptomic characteristics of UAR-GC with BM. We explored the genetic alterations, gene expression profiles, and immune microenvironments that characterize UAR-GC with BM compared to UAR-GC without BM.
Materials and Methods
1. Study design and sample collection
Among patients who had been diagnosed as UAR-GC and treated at the Seoul National University Bundang Hospital (SNUBH), we selected 50 patients who underwent gastrectomy between March 2012 and June 2018. Among these 50 patients, 39 had initially stage IV disease at the time of GC diagnosis and 11 had recurrent disease. At the time of GC diagnosis (initially stage IV cases) or when recurrence was first confirmed, 14 had BM (BM group) and the other 36 had distant metastasis in other sites (without evidence of BM; without-BM group). We retrospectively collected clinicopathological data such as demographics, cancer stage using the American Joint Committee on Cancer (AJCC) staging system (8th edition), histologic type, p53, microsatellite instability, human epidermal growth factor receptor 2, and Epstein-Barr virus status [12]. Formalin-fixed paraffin-embedded (FFPE) blocks of primary tumor tissues collected from gastrectomy specimens were used for genomic and immunohistochemical experiments. Next-generation sequencing was performed using FFPE tissues from 44 patients (12 patients in the BM group and 32 in the without-BM group). In cases of recurrent GC, primary tumor tissues obtained at the time of curative gastrectomy were used for examination. All FFPE tissue samples were obtained from the Department of Pathology, SNUBH, in accordance with protocols approved by the institutional review board (IRB No. B-1902/520-302).
2. Targeted DNA sequencing
After genomic DNA extraction from each FFPE tissue sample, targeted sequencing was performed using the hybrid capture-based TruSight Oncology 500 DNA kit (Illumina, San Diego, CA) according to the manufacturer’s instructions. Briefly, DNA was fragmented using an ultrasonicator (Covaris, Woburn, MA) with a target peak of approximately 130 bp. After end repair, A-tailing, and adapter ligation, adapterligated fragments were amplified using index polymerase chain reaction (PCR) (UP-index)–specific primers. Furthermore, the libraries were enriched using a hybrid capture-based method using specific probes, followed by PCR-based enrichment, cleanup, and quantification of double-stranded DNA using a high-sensitivity Qubit (Thermo Fisher Scientific, Eugene, OR). The libraries were subjected to bead-based normalization and sequenced using V2 sequencing reagent kits on a NextSeq 550 platform (Illumina).
3. Somatic variant analysis using targeted sequencing data
Raw sequence reads were converted to FASTQ format using the BaseSpace TSO 500 Assessment App (Illumina). The DNA sequences in the FASTQ files were aligned to the hg19 genome using the Burrows-Wheeler Aligner with SAMtools. After the reads were collapsed using a unique molecular identifier, the Stitching Pisces software was used to detect somatic variants of low frequencies. Single-nucleotide variants (SNVs) and small insertions and deletions (INDELs) were identified using BaseSpace variant interpreter. The minimum read depth for the reference calls was 100, and the limit of detection for variant allele frequency (VAF) was 0.05 at that depth. The post-processing of small variant call formats was performed using Pepe for background polishing and quality score adjustment. In-house filtering and functional annotation were performed using SnpEff based on several databases, such as ClinVar and the Exome Aggregation Consortium (ExAC). The following criteria were used to include only somatic variants with clinical significance: (1) variants with a VAF < 2% or ≥ 97% were removed; (2) variants with allele frequency ≥ 1% in the ExAC and Macrogen (Seoul, Korea) internal population databases were excluded; (3) variants annotated in the ClinVar database as benign or likely benign were filtered out; (4) synonymous, intron, 3′ and 5′ untranslated region, and upstream, downstream, and intergenic region variants were excluded. Tumor mutational burden detection was set by counting the eligible SNVs and indels per Mb in the coding and high-confidence regions with ≥ 50 × coverage.
4. Whole transcriptome sequencing
In addition to the 44 cases mentioned above, six normal samples were subjected to whole transcriptome sequencing (WTS). Total RNA was extracted using the RNeasy FFPE Kit (Qiagen, Germantown, MD), according to the manufacturer’s instructions. RNA integrity was assessed using a Bioanalyzer (Agilent, Santa Clara, CA), and tumor RNAs with RNA integrity number ≥ 6 were subjected to RNA-sequencing (RNA-seq). RNA-seq libraries were generated using the TruSeq RNA Sample Preparation Kit (Illumina). mRNA was enriched using poly T oligo-attached magnetic beads, followed by mRNA fragmentation by acoustic shearing. First-strand cDNA was synthesized using reverse transcriptase and random hexamers. Second-strand cDNA was synthesized using DNA polymerase I and RNase H. Subsequently, the cDNA was subjected to adapter ligation and then enriched with PCR to prepare a cDNA library. The cDNA libraries were sequenced using HiSeq 2000 (Illumina).
5. Differentially expressed gene analysis
The WTS data of 12 patient samples in the BM group, 32 in the without-BM group, and six normal samples were analyzed to explore the gene expression profiles of GC with BM. After the raw data quality was assessed using FastQC, the adapter and over-represented sequences were trimmed using Trimmomatic v.1. Trimmed reads were then mapped to the human reference genome (GRCh37/hg19) using HISAT2 (v.2.1.0.) with Ensembl gene annotation and a first-strand library type. Differentially expressed gene (DEG) analyses were performed between normal versus BM, normal versus without-BM, and BM versus without-BM group using the DeSeq2 R package. The raw count data were normalized by size factors determined by the median ratio of gene counts relative to the geometric mean per gene, and the Wald test for significance determined DEGs following negative binomial generalized linear model fitting [13]. Only genes with a false discovery rate (FDR) < 0.05 and |log2 fold change (FC)| > 1.5 were selected as DEGs.
6. Gene set enrichment and protein-protein interaction network analysis
Gene set enrichment analysis (GSEA) and protein-protein interaction (PPI) network analyses were performed for the functional analysis of DEGs. We performed GSEA (http://www.broadinstitute.org/gsea/index.jsp) using the Gene Ontology (GO) function and oncogenic signature gene sets from the Molecular Signatures Database (https://www.gseamsigdb.org/gsea/msigdb/genesets.jsp) [14,15]. The enriched pathways of the DEGs were identified with statistical significance (FDR < 0.25). Additionally, the PPI network of DEGs was constructed from the STRING database (https://string-db.org) with a confidence of interaction > 0.4, and significant modules were determined through the insertion Molecular Complex Detection (MCODE) plugin with degree > 2, node score > 0.2, and K-Core=2 using Cytoscape 3.9.1 [16,17].
7. Immune cell deconvolution
Immune cell deconvolution was performed using CIBERSORTx with normalized gene expression data. The CIBERSORTx algorithm enables the estimation of cell-type abundance from bulk RNA-seq [18]. The tumor infiltration levels of immune cells, including T cells, B cells, natural killer (NK) cells, and macrophages, were inferred from the estimated cell fraction.
8. Multiplex immunohistochemistry using immune cell markers
Multiplex immunohistochemistry (mIHC) was conducted using antibodies against CD3, CD8, FOXP3, CD20, CD57, and CD68 using a tissue microarray (TMA) constructed from FFPE blocks of the total cohort (n=50). Preprocessed FFPE TMA slides were first incubated with Harris hematoxylin for nuclear staining and then subjected to sequential immunohistochemistry (IHC; antigen retrieval and blocking, antibody incubation with the specific antibody of choice, image acquisition by whole-slide scanning, and antibody stripping with stripping buffer) six times. Each TMA core was extracted from the acquired images using an Aperio ImageScope (Leica Biosystems, Newcastle upon Tyne, UK). CellProfiler ver. 3.1.8 (Broad Institute, Cambridge, MA) was used to perform nuclear hematoxylin staining and image alignment and to estimate the single-cell staining intensity and cell density. All processing and analysis of mIHC were performed using SuperBioChips (SuperBioChips Laboratories) [19,20].
9. IHC of mucin-12
Gene expression of the mucin-12 protein was found to be upregulated in GC with BM using DEG analysis; this result was validated by IHC staining. IHC analysis of mucin-12 (1:50, cat. # ab121777, Abcam, Cambridge, UK) was performed on all cohorts using the BenchMark XT automated slide processing system (Ventana Medical Systems, Tucson, AZ). Mucin-12 expression was evaluated based on intensity (negative, faint, moderate, and strong) and area (%). Positive expression of mucin-12 was defined as moderate to strong expression in ≥ 10% of tumor cells.
10. Data visualization and statistical analysis
All data visualization and statistical analyses were conducted using the R software ver. 4.1.0 (R Development Core Team, Vienna, Austria). The chi-square test was used to identify different associations between clinicopathological features and metastatic sites. Fisher’s exact test was used to determine the differences in gene mutation frequencies between the BM and without-BM groups. The Wilcoxon rank-sum test was performed to compare non-parametric distributions between the two groups. Kaplan-Meier curves were constructed for survival analysis, and the associations between explored variables and overall survival (OS) were assessed using the log-rank test or Cox regression analysis. OS was defined as the period between the date of UAR-GC diagnosis (in case of recurrence, the date on which recurrence was first confirmed) to the date of death or the last follow-up visit for patients still alive. All statistical tests were two-sided, and a p-value of < 0.05 was considered to be statistically significant. The correction for multiple testing was performed using the Benjamini-Hochberg method.
Results
1. Clinicopathologic features associated with BM
The demographics and clinicopathological characteristics of patients with BM (n=14) and without BM (n=36) are shown in Table 1. The histologic type showed different distributions between BM and without-BM groups. Approximately 70% of patients with BM had poorly cohesive carcinoma (PCC), but only 28% of patients without BM had PCC (p=0.021). When classified by Lauren histological type, no statistically significant difference was observed between BM and without-BM groups, but the BM group tended to have a more frequent diffuse type than the without-BM group (86% vs. 56%; p=0.056). From the time of UAR-GC diagnosis, patients with BM had worse OS than those without BM in univariate analysis (p < 0.001) (S2 Fig.). When the multivariate analysis was conducted including metastatic sites, the presence of BM was a particularly poor prognostic factor with a statistical significance and the highest hazard ratio (HR) compared to the presence of other metastatic sites (HR, 4.745; 95% confidence interval, 1.406 to 16.013; p=0.012) (S3 Table).
2. Somatic mutational profiling of GC with BM
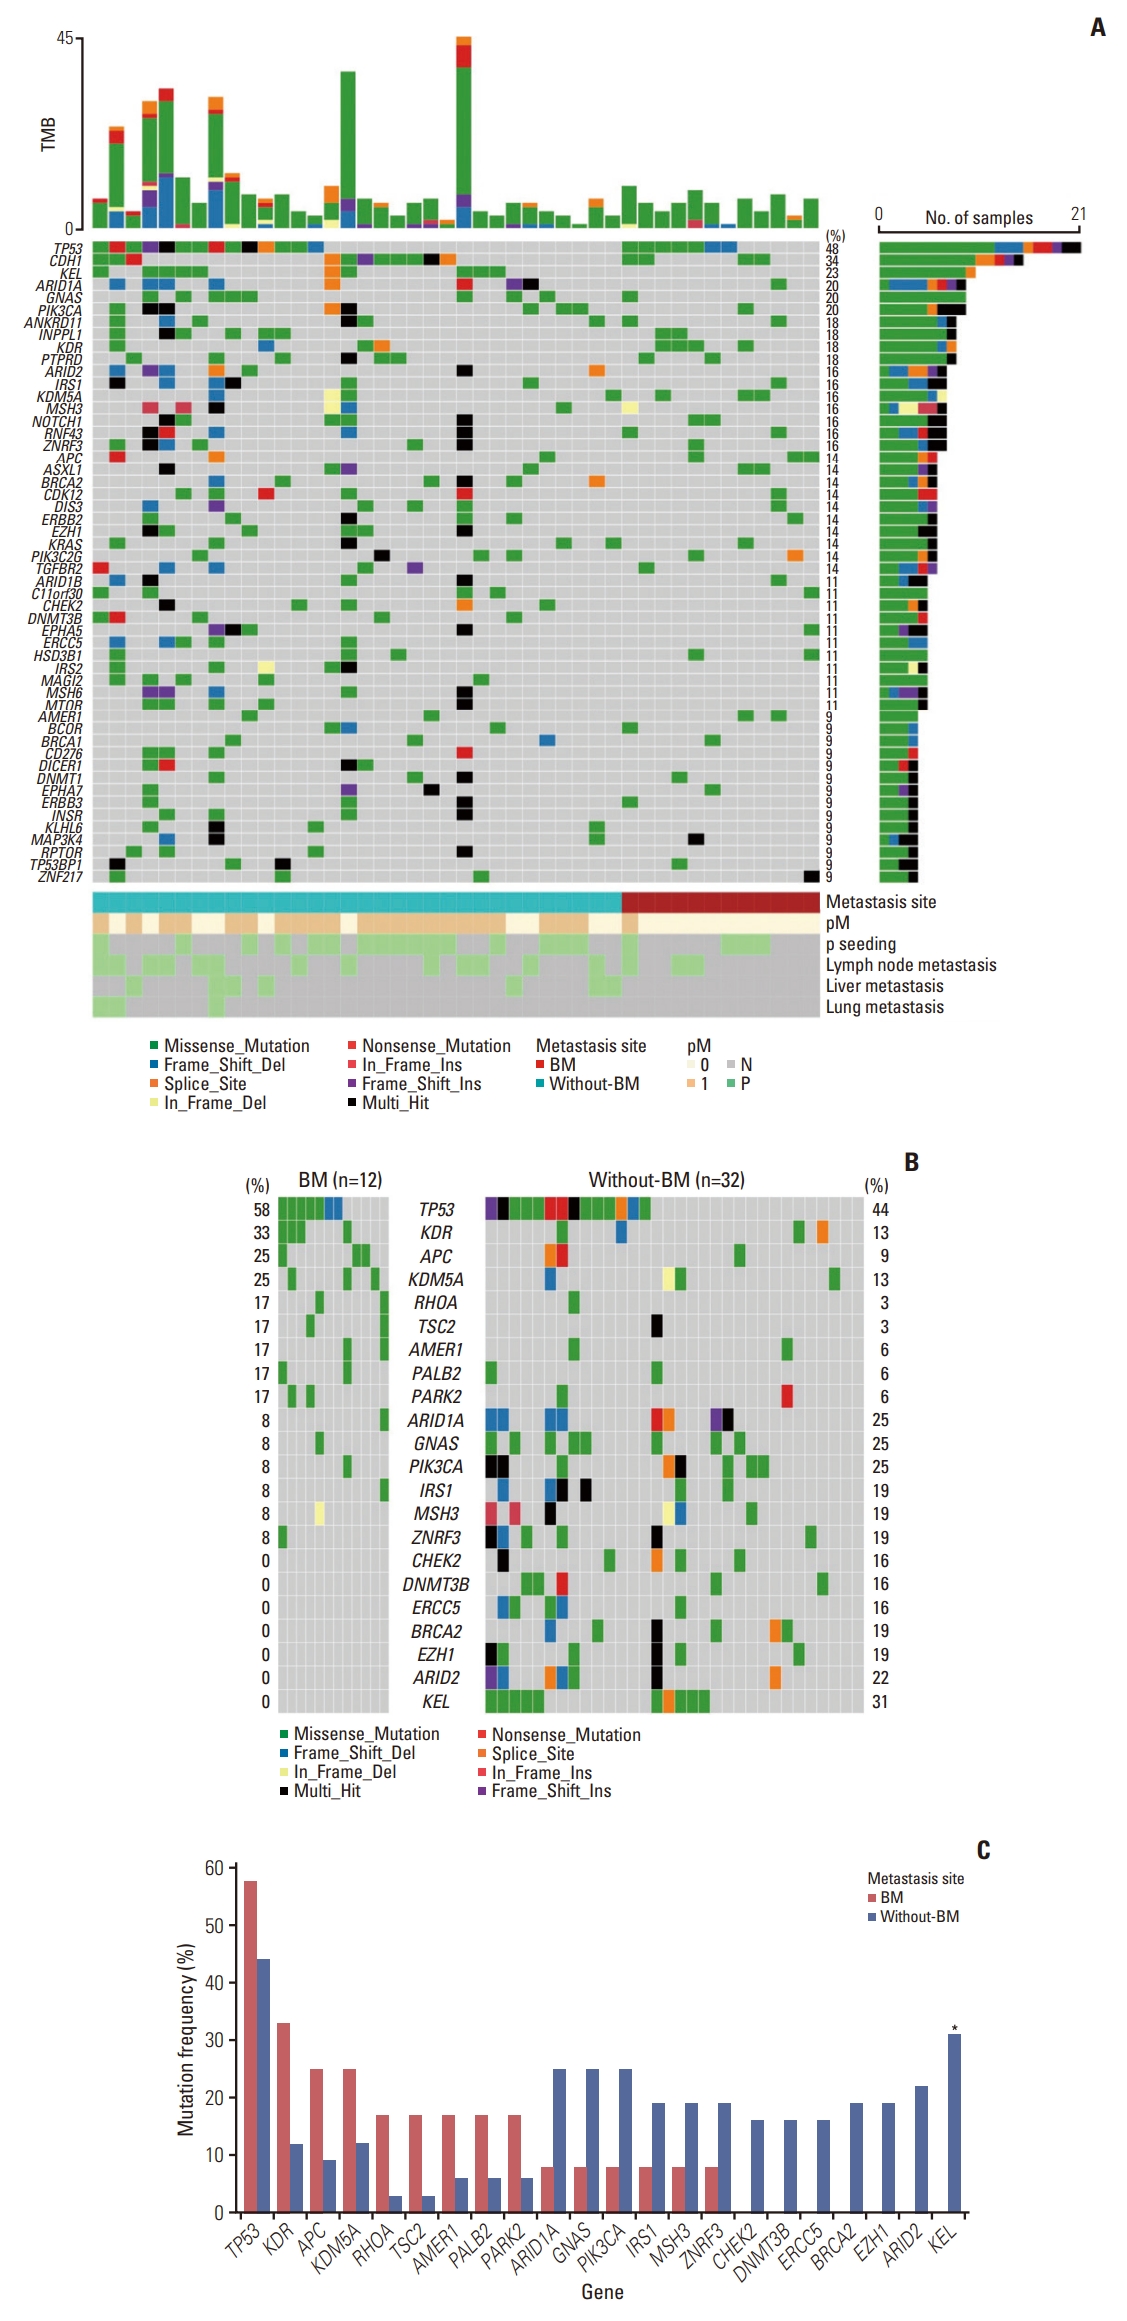
Somatic mutations in cancer-related genes were detected using targeted sequencing data from 44 UAR-GC patients. The oncoplot illustrates the 60 most mutated genes in the total cohort: TP53 (48%), CDH1 (34%), KEL (23%), PIK3CA (20%), ARID1A (20%), GNAS (20%), ANKRD11 (18%), INPPL1 (18%), PTPRD (18%), and KDR (18%) (Fig. 1A). The BM group tended to show a higher mutation rate of TP53 (58% vs. 44%), KDR (33% vs. 13%), APC (25% vs. 9%), KDM5A (25% vs. 13%), RHOA (17% vs. 3%), and TSC2 (17% vs. 3%) than the without-BM group (Fig. 1B). In contrast, mutations in CHEK2 (16%), DNMT3B (16%), ERCC5 (16%), BRCA2 (19%), EZH1 (19%), ARID2 (22%), and KEL (31%) were found only in the without-BM group. Among the above genes, KEL was shown to be less frequently mutated in patients with BM, with statistical significance (0% vs. 31%; p < 0.05, Fisher’s exact tests) (Fig. 1C). Although there seemed to be numerical differences, these differences in the mutation frequencies of genes other than KEL were not statistically significant between the two groups.
3. Gene expression signatures of GC with distant metastasis
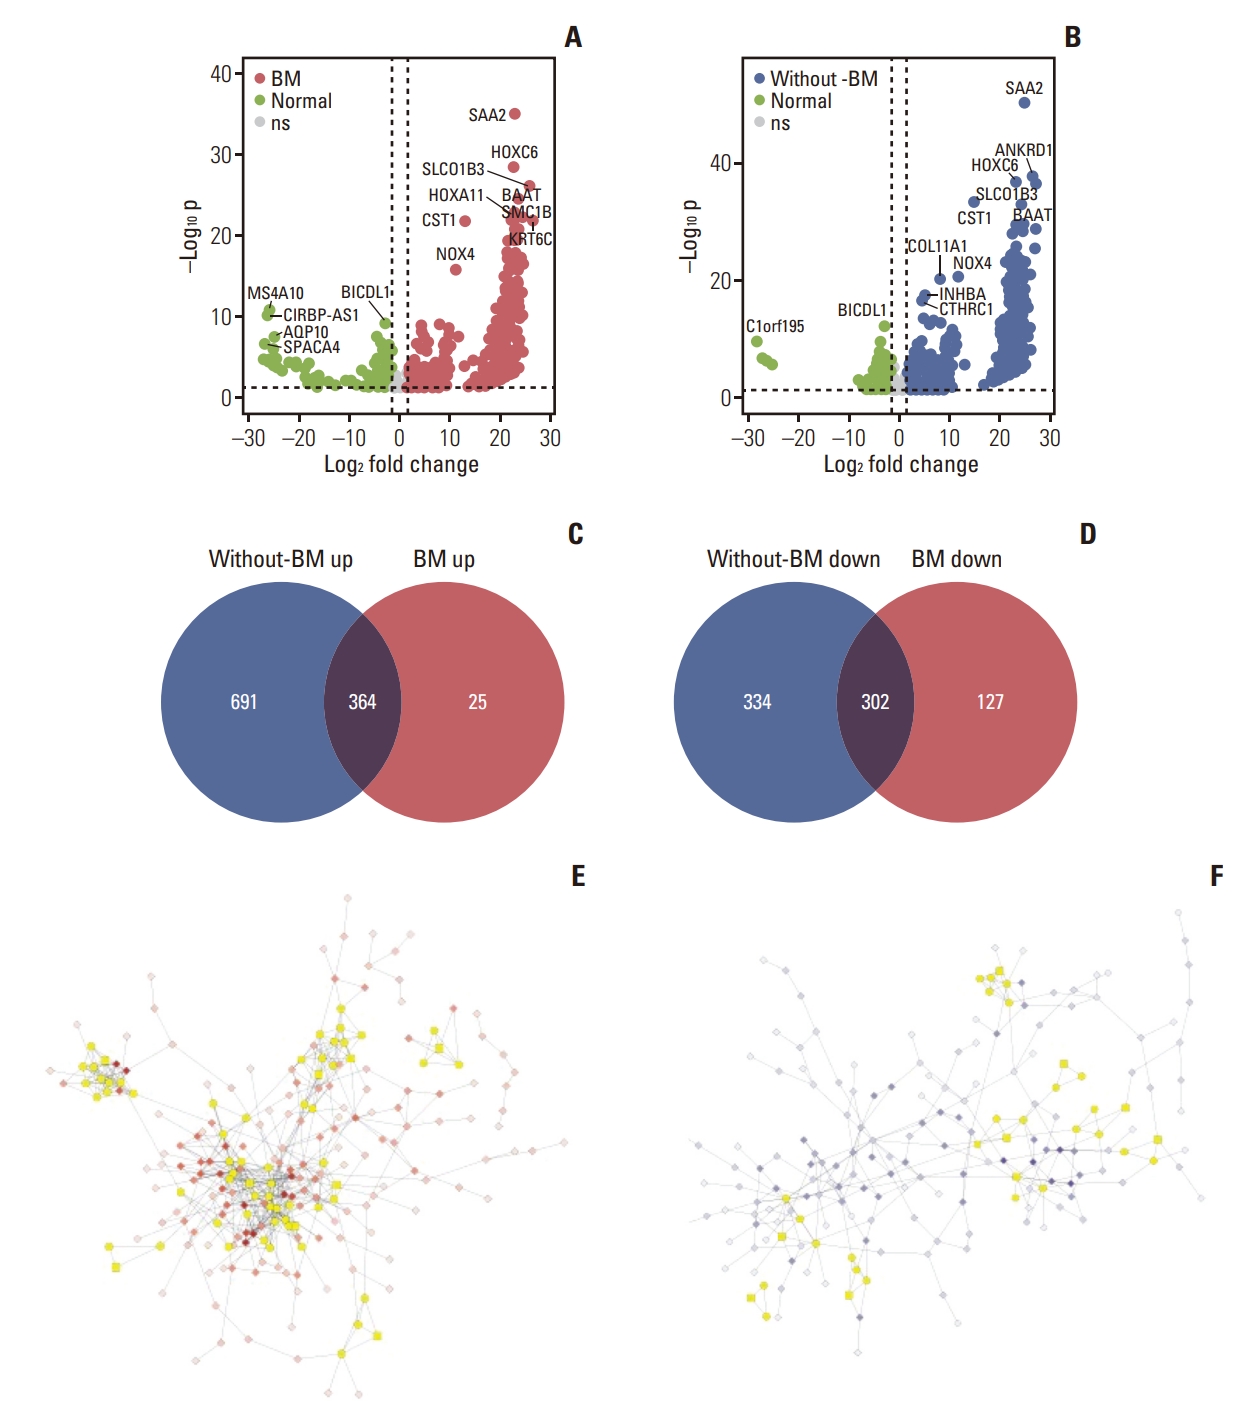
To reveal the common gene expression patterns in patients with BM and without BM, DEG analyses were first conducted between normal samples and each group. Thus, 389 and 429 genes were up- and downregulated in the BM group, whereas 1,055 and 636 genes were up- and downregulated in the without-BM group (Fig. 2A and B), respectively. Shared upregulated (n=364) and downregulated (n=302) genes were identified as common DEGs, suggesting that they play a crucial role in tumorigenesis and progression of both BM and without-BM groups (Fig. 2C and D). We conducted a PPI network analysis of these common DEGs and selected the top three modules with the highest scores determined by MCODE analysis. As shown in Fig. 2E and F, the network of common upregulated genes comprised 249 nodes and 598 edges, while that of common downregulated genes comprised 203 nodes and 293 edges. Pathway enrichment analyses of significant modules were performed to determine the key biological features of each network. The GO pathways enriched in the top three modules of commonly upregulated genes included extracellular matrix organization, blood vessel development, blood vessel morphogenesis, cell adhesion, regulation of cell migration, cell-cell adhesion, and positive regulation of cell migration. These pathways related to cell invasion and migration were upregulated in both BM and without-BM groups. In contrast, the common downregulated genes of key modules mainly participated in GO pathways related to metabolism and immune responses, such as the type 1 interferon signaling pathway, fructose metabolic process, hexose metabolic process, innate immune response, diacylglycerol metabolic process, carbohydrate metabolic process, glucose metabolic process, and immune system process (FDR < 0.05) (Fig. 3A and B).
4. Distinct gene expression signatures of GC with BM
The distinguishable gene expression signatures of patients with BM were investigated through DEG analyses between BM and without-BM groups, followed by PPI network analysis and GSEA of DEGs. We identified 123 genes that distinguished between BM and without-BM groups. Among them, ANGPTL8, FAM159B, PGA3, LIPF, TRIM50, MUC12, PGC, and MFSD4A were more highly expressed in the BM group than in the without-BM group, whereas the expression of ITIH2, SERPINA6, SLC30A2, MT1A, CCL7, DAPL1, DUSP9, ANO4, MS4A10, OR9Q2, GPR143, GAGE1, OR52A1, and PMAIP1 was greatly reduced (|log2 FC| > 1.5 and FDR < 0.05) (Fig. 4A). PPI network analysis was conducted to elucidate the biological interactions among the DEGs, and the resulting network consisted of 32 nodes and 24 edges. LIPF, PGC, KLK5, and GAGE12F were identified as hub nodes with degrees > 2 (Fig. 4B). The enriched pathways of oncogenic signatures with respect to the GSEA of DEGs are shown in Fig. 4C. Pathways including MTOR_UP.N4.V1_DN, KRAS. KIDNEY_UP.V1_UP, KRAS.BREAST_UP.V1_DN, AKT_UP. V1_DN, and MTOR_UP.V1_DN were specifically enriched in the BM group, whereas CSR_LATE_UP.V1_UP, CRS_EARLY_UP.V1_UP, MTOR_UP.V1_UP, MTOR_UP.N4.V1_UP, and VEGF_A_UP.V1_DN were enriched in the without-BM group (downregulated in the BM group). The BM group was correlated with activation of the phosphoinositide 3-kinase (PI3K)/AKT/mammalian target of rapamycin (mTOR) pathway, whereas the without-BM group was correlated with inhibition of the mTOR pathway.
5. Validation of key DEGs and their prognostic values
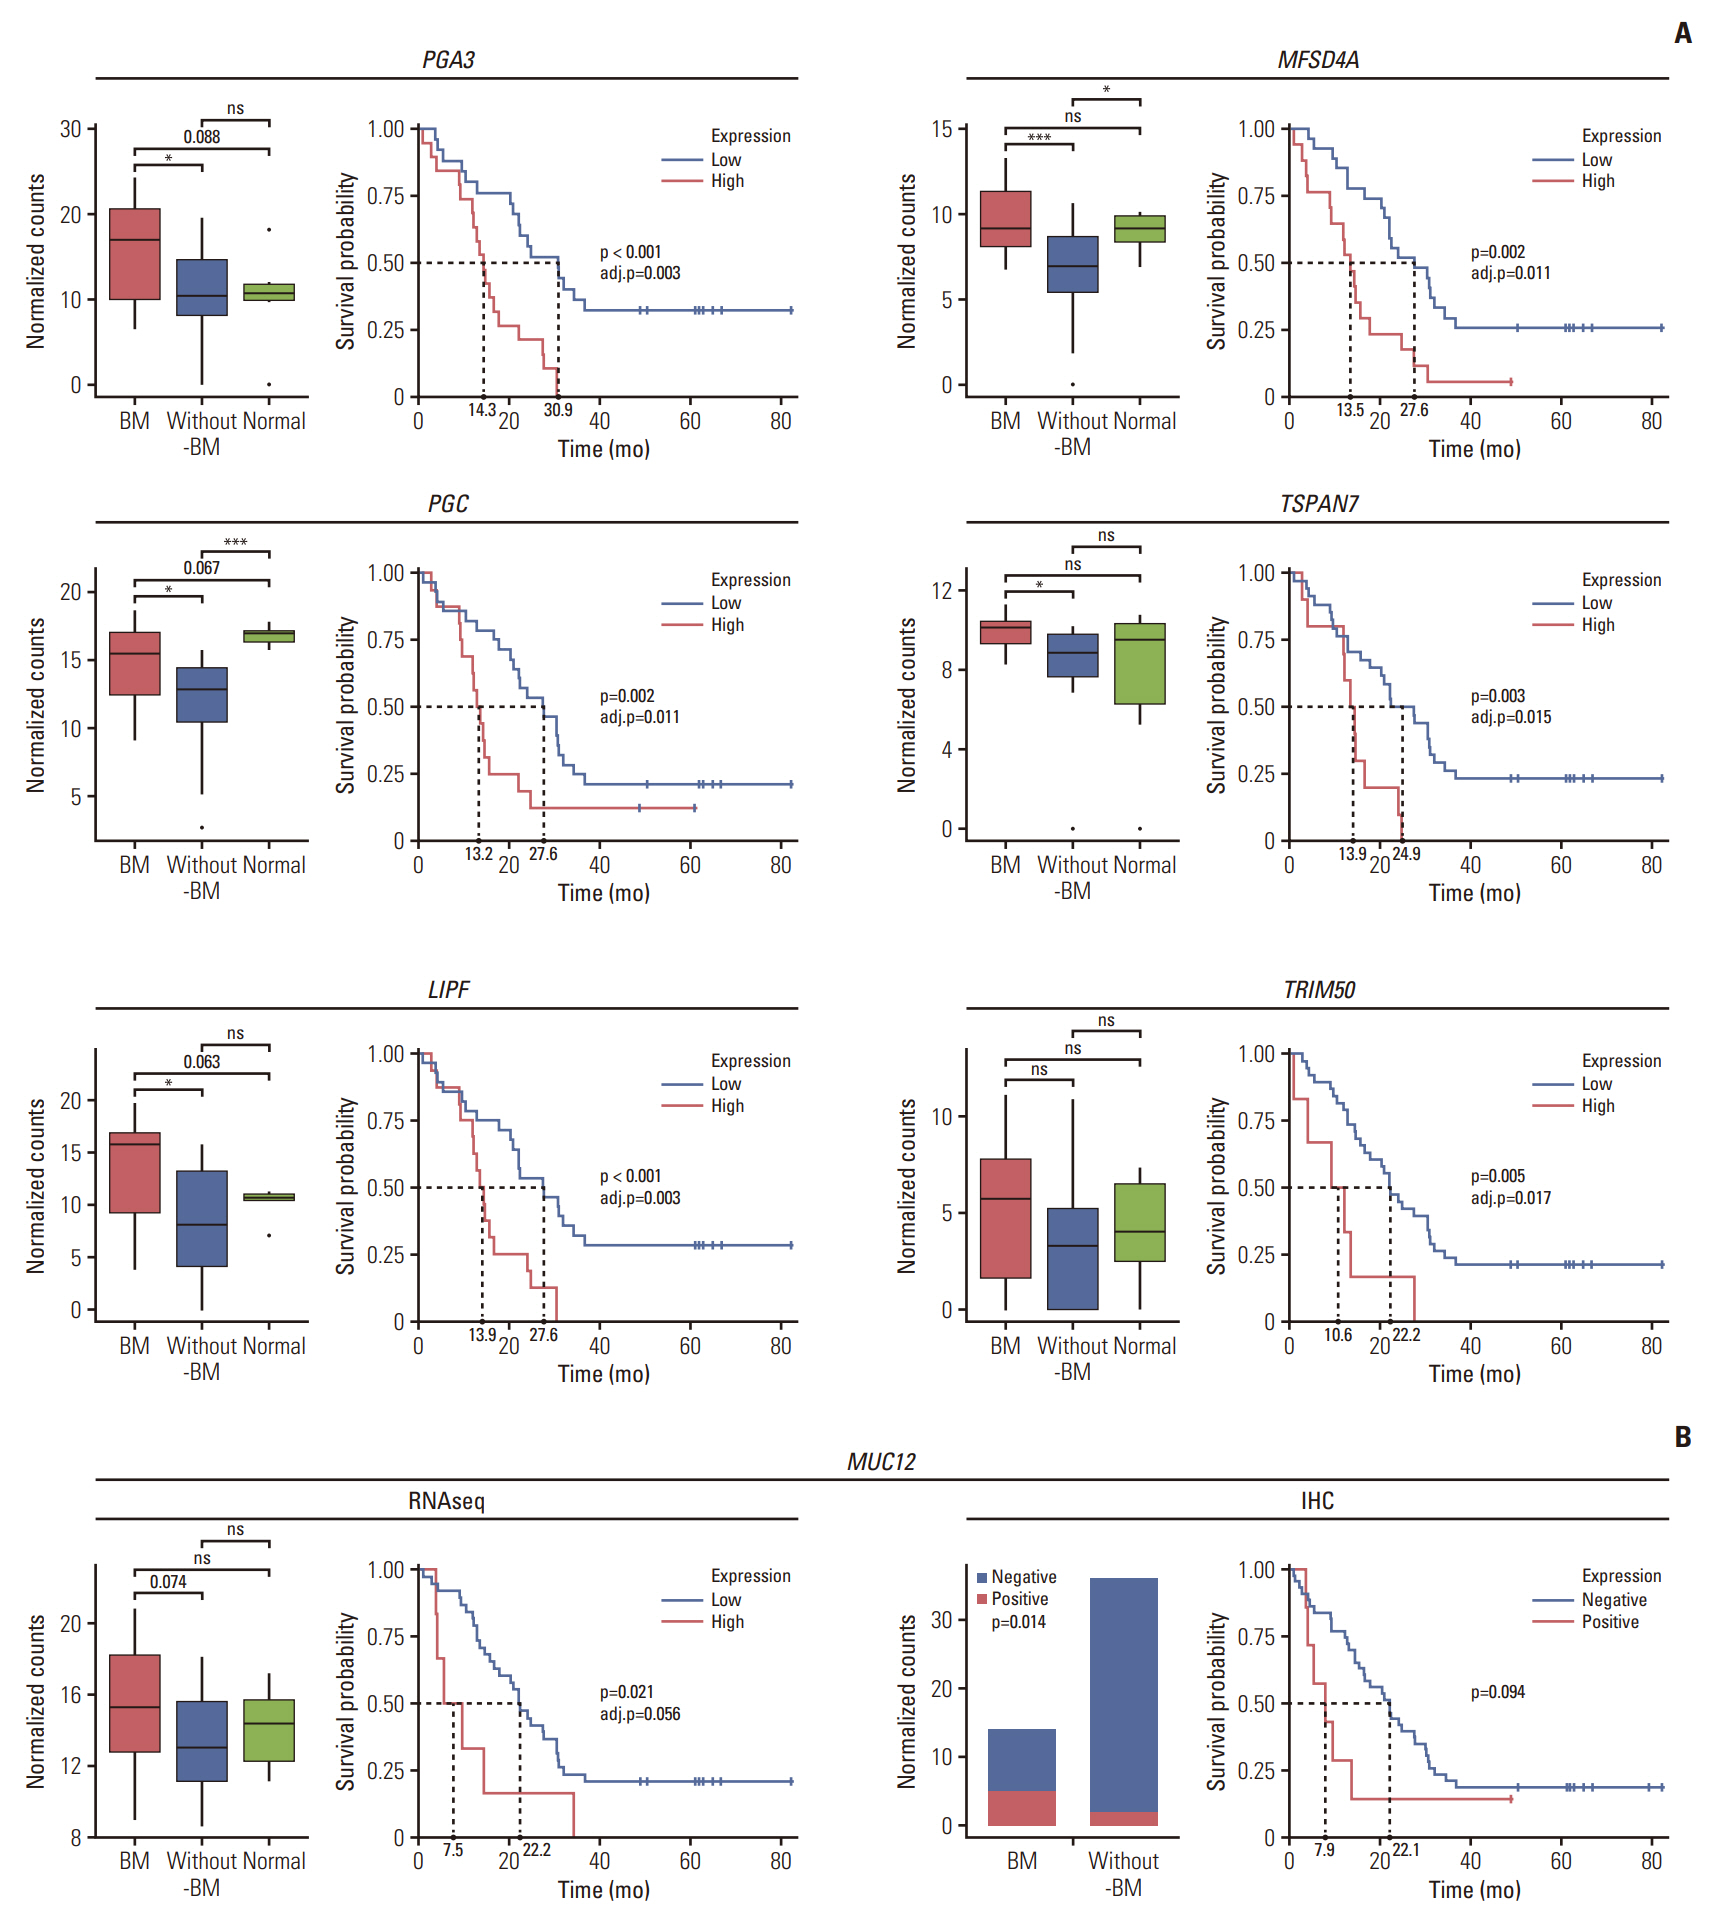
The subset of DEGs was referred to as key DEGs if one of the following three conditions was satisfied: (1) if the gene was identified as the hub gene of the PPI network, (2) if the gene accounted for the enrichment signal of the leading edge, and (3) if any clinical significance of the gene was revealed in previous studies. The 25 key DEGs included ANGPTL8 (angiopoietin-like 8), FAM159B (family with sequence similarity 159 member B), PGA3 (pepsinogen A3), LIPF (lipase F, gastric type), KLK5 (kallikrein related peptidase 5), TRIM50 (tripartite motif containing 50), MUC12 (mucin 12), PGC (pepsinogen C), MFSD4A (major facilitator superfamily domain containing 4A), TSPAN7 (tetraspanin 7), ITIH2 (inter-alpha-trypsin inhibitor heavy chain 2), SERPINA6 (serpin family A member 6), SLC30A2 (solute carrier family 30 member 2), MT1A (metallothionein 1A), CCL7 (C-C motif chemokine ligand 7), DAPL1 (death associated protein like 1), DUSP9 (dual specificity phosphatase 9), ANO4 (anoctamin 4), MS4A10 (membrane spanning 4-domains A10), OR9Q2 (olfactory receptor family 9 subfamily Q member 2), GPR143 (G protein-coupled receptor 143), GAGE1 (cancer/testis antigen 4.1), OR52A1 (olfactory receptor family 52 subfamily A member 1), GAGE12F (cancer/testis antigen 4.7), and PMAIP1 (phorbol-12-myrsitate-13-acetate-induced protein 1).
For further validation of key DEGs, to elucidate their prognostic values, we examined whether the genes were correlated with the survival of UAR-GC patients using log-rank test. Genes such as PGA3, PGC, LIPF, MFSD4A, TSPAN7, TRIM50, and MUC12 were highly expressed in patients with BM than in those without BM, and their high expression was associated with poor survival (adjusted p < 0.05) except MUC12 (p=0.021, adjusted p=0.056) (Fig. 5A). In the case of MUC12, the expression level of mucin-12 protein was assessed using IHC. Similar to the sequencing results, an elevated level of mucin-12 protein was more frequently observed in the BM group than in the without-BM group (36% [5/14] vs. 6% [2/36]; p=0.014). Overexpression of mucin-12 protein tended to be associated with decreased OS (p=0.094) (Fig. 5B). In contrast, the expression levels of SERPINA6, ITIH2, SLC30A2, and PMAIP1 were downregulated in the BM group, and the high expression of these genes was associated with prolongation of OS with borderline statistical significance (Fig. 6).
6. Tumor-infiltrating immune cell analysis
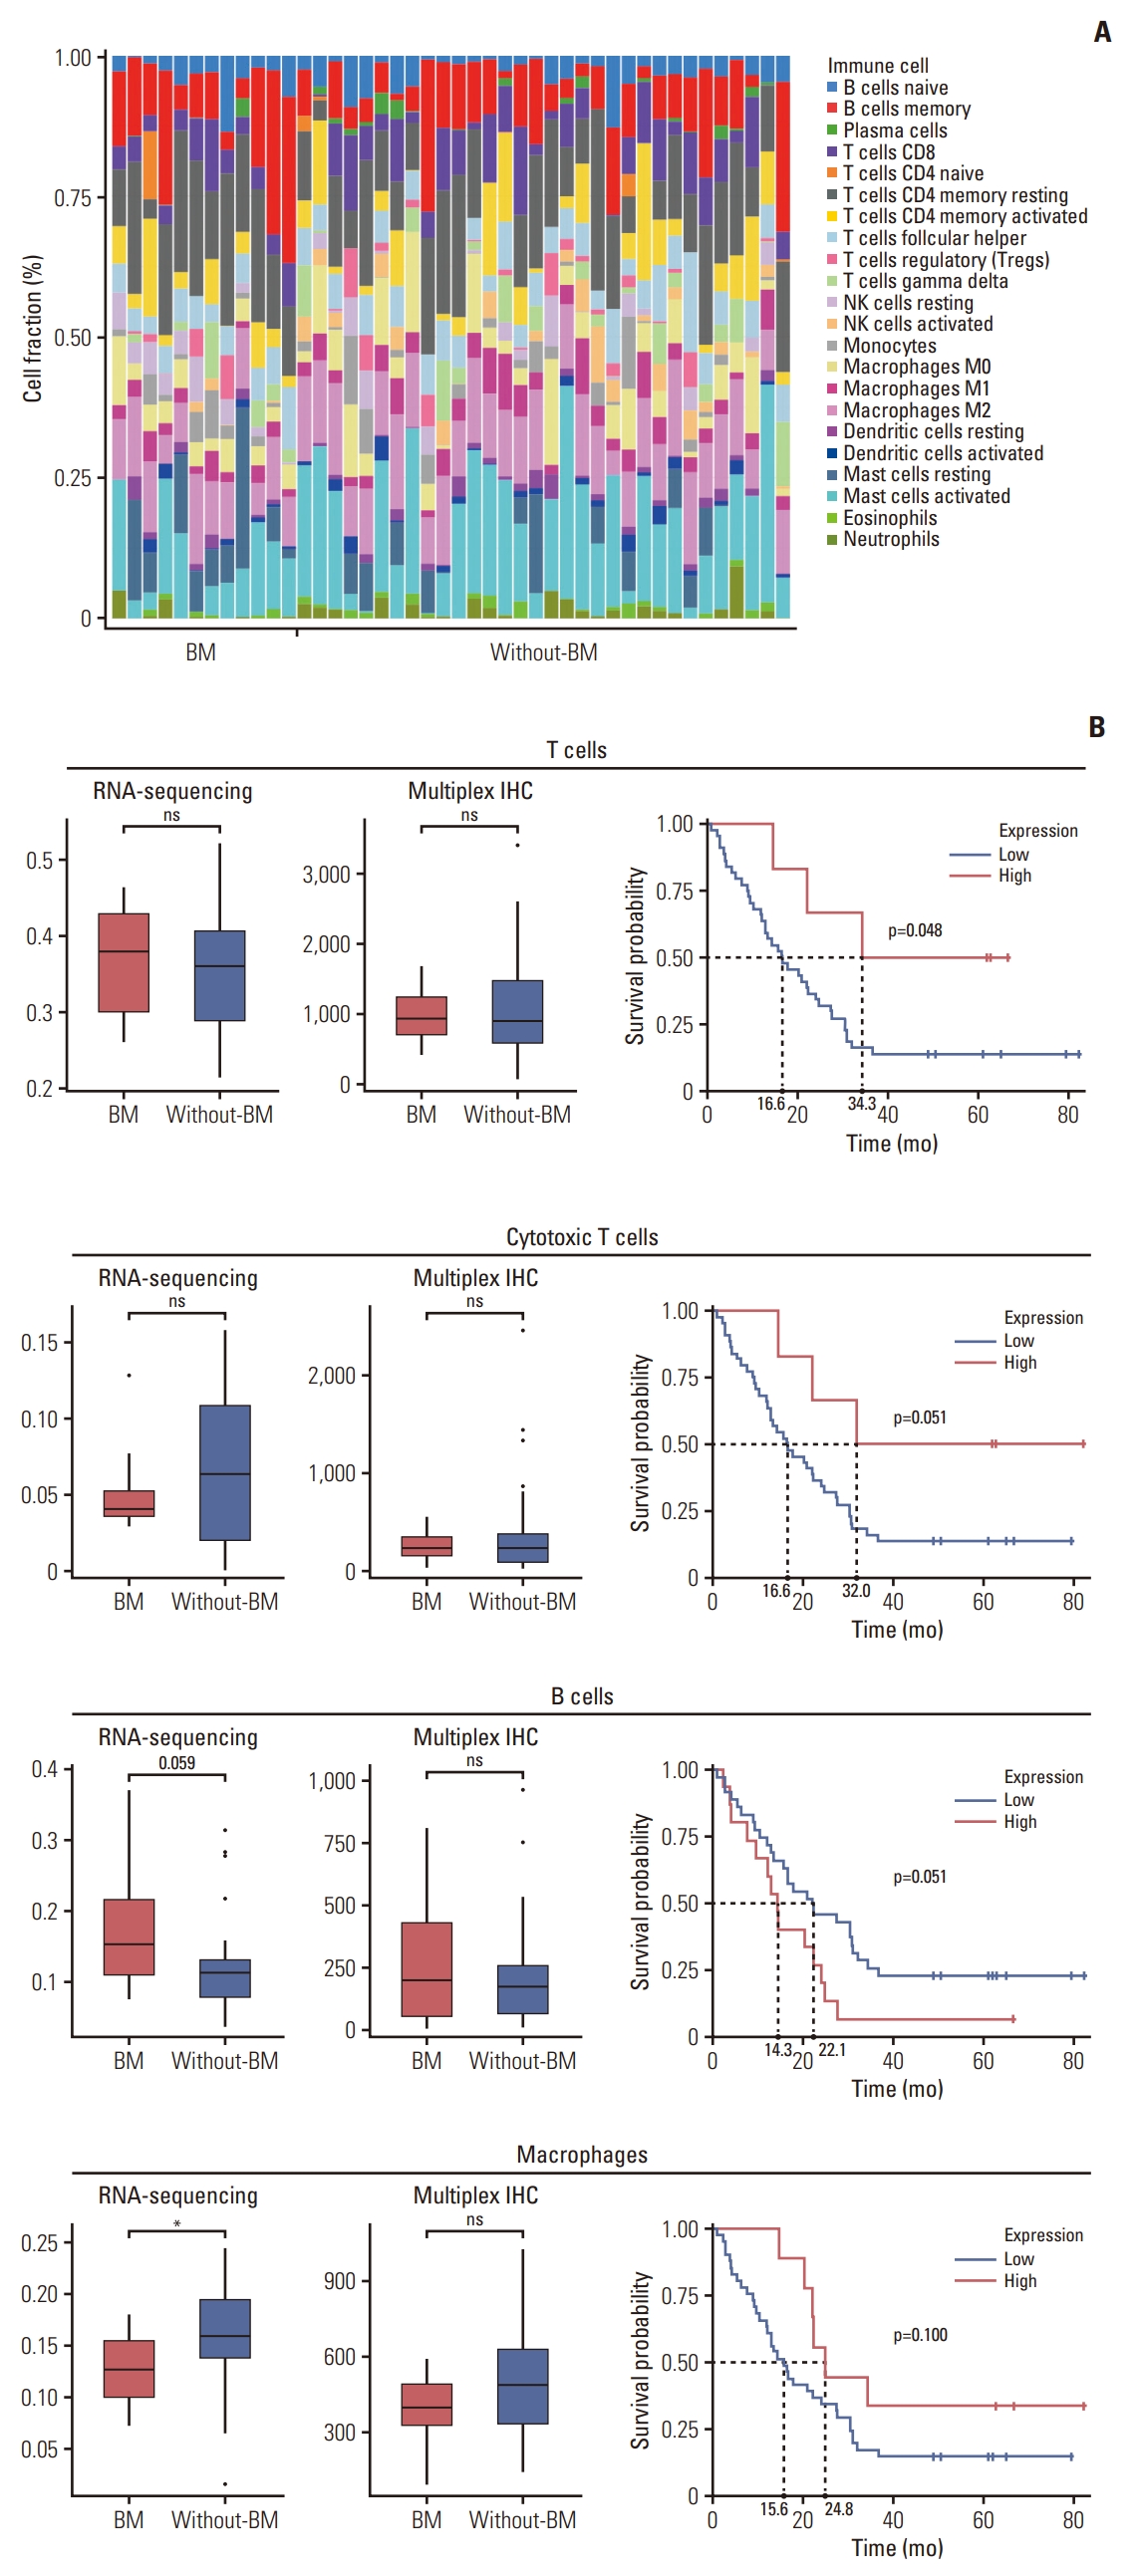
WTS data were evaluated using CIBERSORTx tools to define the landscape of infiltrating immune cells in the tumor microenvironment (Fig. 7A). We compared the cell fractions of T cells, B cells, NK cells, and macrophages estimated via CIBERSORTx between the BM and without-BM groups (Fig. 7B). The densities of T cells and cytotoxic T cells did not differ between the two groups. B-cell density tended to be higher in the BM group than in the without-BM group, although the difference was not statistically significant (p=0.059). Conversely, the density of macrophages was higher in the without-BM group (p=0.025).
Tumor-infiltrating immune cells were assessed by mIHC using antibodies targeting CD3, CD8, FOXP3, CD20, CD57, and CD68. The densities of CD3+CD8+, CD3+CD8−, and CD3+FOXP3+ immune cells did not differ between the BM and without-BM groups (p > 0.05). Moreover, the expression of CD20, CD57, and CD68 did not differ between the two groups (p > 0.05). Higher densities of CD3+, CD3+CD8+, and CD68+ cells were associated with prolonged OS with statistical significance or trend (p=0.048, 0.051, and 0.100, respectively), whereas high expression of CD20 tended to be associated with poor OS (p=0.051).
Discussion
BM rarely occurs in GC compared to other cancers such as breast, lung, renal, and prostate cancer but has dismal outcomes [6,21]. All 14 patients with BM in our cohort died, and the survival time from the diagnosis of distant metastasis to the date of death was shorter in patients with BM than that in those without BM (p < 0.001). In this study, we aimed to investigate the distinctive clinical features, genetic alterations, gene expression profiles, and immune microenvironments that characterize GC with BM compared with GC without BM.
To unravel the gene expression patterns that distinguish GC with BM from GC without BM, key DEGs were selected using PPI network analysis. The hub genes of the network included PGA3, PGC, and LIPF, which were overexpressed in the BM group than in the without-BM group and were thought to potentially contribute to an unfavorable prognosis. Interestingly, they are mainly expressed in gastric chief cells [22], suggesting that tumors mainly composed of cells resembling chief cells are more likely to progress to the BM. Moreover, in a previous study elucidating the relationship between pepsinogen (PG) levels and GC, PGI and PGII levels in diffuse-type GC were significantly higher than those in intestinal-type GC (p < 0.05) [23]. Consistent with this study, PCC was positively correlated with GC with BM in our cohort. Kong et al. [24] stated that although LIPF levels were lower in cancer tissues than in normal tissues, high expression levels of LIPF in GC were associated with poor prognosis.
Other upregulated genes, such as TSPAN7, TRIM50, and MFSD4A whose expression is associated with poor survival, also showed clinical significance in other carcinomas. TSPAN7 was a leading-edge gene that accounts for the enrichment of oncogenic signature pathways. TSPAN7-mediated signal transduction is known to play a role in cell development, activation, and growth and affects the growth of lung cancer cells in target organ metastasis [25]. TRIM50 encodes an E3 ubiquitin-protein ligase that ubiquitinates Beclin-1/BECN1 to promote autophagy activation, and its RNA expression is enriched in liver and renal cancer [26,27]. In addition, Yang et al. [28] demonstrated that MFSD4A could specifically bind to and degrade EPH receptor A2 (EPHA2), leading to alterations in the PI3K-AKT-ERK1/2 pathway and epithelial-mesenchymal transition, thereby affecting nasopharyngeal carcinoma.
Among the key DEGs, several genes were downregulated in the BM group, and their elevated expression led to a relatively good prognosis. Hamm et al. [29] revealed that ITIH, which induces extracellular matrix stability and anti-proliferation, differentiation, and metastatic effects, is clearly downregulated in multiple human solid tumors, including breast, colon, and lung cancers. SLC30A2 is a favorable prognostic marker for renal cancer [17]. PMAIP1, a pro-apoptotic subfamily within the BCL-2 protein family, contributes to p53/TP53-dependent apoptosis. Induction of PMAIP1 suppresses cell proliferation, whereas RNAi-mediated knockdown of PMAIP1 induces cell-growth recovery [30].
Immune cell deconvolution revealed no difference in the densities of helper, cytotoxic, and regulatory T cells between the two groups in this study. However, differences in the densities of B cells and macrophages were observed between the two groups. That is, the infiltration of B cells analyzed by WTS data tended to increase in GC with BM, although the difference was not statistically significant. In contrast to other immune markers, the CD20 marker showed a trend of poor OS with high expression levels. This result conflicted with previous studies showing that a high level of CD20+B-cell infiltration was significantly associated with improvements in OS [31]. It has also been reported that CD20 infiltration is associated with a longer OS in different cancer types. However, we still have a poor understanding of the heterogeneity and diversity of B-cell subsets in tumors [32]. Studies have shown that different B-cell phenotypes play different roles in various cancers [33]. Therefore, our observations strongly suggest that further studies on B-cell subsets are warranted. The densities of CD68+ macrophages were lower in the BM group than in the without-BM group, and the same trend was observed in mIHC. However, since mIHC was performed only for the CD68 marker that identified total macrophages, further studies are required to confirm the difference between the M1 and M2 subtypes.
Targeted DNA sequencing of our cohort revealed the somatic mutation profiles of patients with BM. The mutation frequencies of well-defined cancer-related genes such as TP53, KDR, APC, and RHOA tended to be higher in GC with BM. A significant difference in the mutation frequency of the Kell metalloendopeptidase (KEL) was observed. Although KEL mutations have been detected in a few cancers, including colon cancer, lung cancer, and lymphoma, their clinical implications remain unknown (https://cancer.sanger.ac.uk/cell_lines/gene/analysis?ln=KEL).
Our study has some limitations. Because this study included only patients who underwent gastrectomy, this may be why patients included in this study tended to have longer OS than those included in previous studies of UAR-GC. Patients with BM included more cases of recurrence after curative surgery (rather than initially metastatic M1 cases) than patients without BM (Table 1); therefore, in the BM group, tumor tissues obtained through curative gastrectomy at the time of locally advanced stage (M0), rather than at the time when distant metastasis was confirmed, were used more frequently for analysis than in the without-BM group. Validation for this study is necessary, but it was difficult to secure sufficient samples from patients with UAR-GC with BM. Only primary tumor tissues were used without metastatic tumor tissues in this study. Although we know that primary and metastatic tumor tissues could have heterogeneous genetic features, it is very difficult to obtain enough bone biopsy samples to perform genomic testing. In addition, validation through open data such as The Cancer Genome Atlas Program could not be used because clinical information, including metastasis, was not clear.
To summarize, in UAR-GC patients, GC with BM was associated with different genetic alterations and gene expression profiles than GC without BM. Our study revealed that GC with BM has the predominant pathologic type of PCC and shares characteristics of gastric chief cells. Consistent with the worse outcome of GC with BM compared to GC without BM, genes upregulated in the BM group, including chief cell-related genes (PGA3, PGC, and LIPF), MUC12, and TSPAN7, were associated with poorer prognosis. In contrast, downregulated genes such as ITIH and PMAIP1 were associated with better survival. Unfortunately, we were not able to suggest a dominant functional pathway affecting metastasis to the bone rather than to other sites. However, several genes associated with poor OS were found to be overexpressed in GC with BM compared to GC without BM. Additional studies are required to identify more specific genetic changes related to BM in GC and to explore therapeutic targets for this subgroup.