Introduction
Since the discovery of prostate-specific marker, namely, prostate-specific antigen (PSA), the PSA level is one of the screening markers for prostate biopsies, along with digital rectal examination (DRE) and transrectal ultrasonography (TRUS) [1]. PSA levels > 3.0 ng/mL are correlated with prostate cancer (PC); however, PSA is not totally PC specific, with a wide range of sensitivity, that is, between 21% and 95%. It varies with prostate volume, histologic inflammation (HI), urethral instrumentation, and amount of cancer within the gland to exhibit limited diagnostic power for cancer detection. Several supplementary PSA parameters such as PSA velocity (change of PSA over time), PSA density (standardization of PSA level in relation to the size of the prostate), adjusted PSA reference ranges (accounting for age-dependent prostate growth and occult prostatic disease), and PSA forms have been developed to maximize the accuracy of PC predictability [1].
Patients with a high suspicion of PC and concurrent elevated PSA level, as well as abnormal findings on DRE or TRUS, were recommended to undergo a TRUS-guided prostate biopsy (TRUS-Bx) [1-3]. Because of the invasiveness of TRUS-Bx and its related complications, the dilemma of recommending TRUS-Bx for patients with a high PSA level has gained attention. Another issue is the difficulty for clinicians in assuring patients who are not worried about PC because of the possible predisposition to PC with false-negative results from TRUS-Bx; these patients typically yield a negative cancer pathology with some HI. Further, these patients are generally recommended to undergo a repeat TRUS-Bx, despite having received anti-inflammatory treatment [2].
For urologists, it is important to find predisposing factors to eliminate PSA level elevation due to HI and to avoid unnecessary repeat TRUS-Bx. Previous literature has suggested a prevalence range of 22%-63% for acute HI and 8%-99% for chronic HI among asymptomatic men who were biopsied due to an elevated PSA level [4]. This elucidates the strong relationship between chronic HI and PC risk, which suggests a protective effect of anti-inflammatory agents against PC [5,6]. HI associated with proliferative inflammatory atrophy has also been proposed as a precursor for prostatic intraepithelial neoplasia and PC [7].
Therefore, in this study, the degree of HI in initial and repeat biopsied prostate specimens was evaluated to determine whether it was correlated with PC in patients with a high suspicion PC who were diagnosed as PC-negative on the initial biopsy, but were diagnosed with PC on the repeat biopsy.
Materials and Methods
1. Patients and tissue samples
Study participants included patients with high PSA levels who underwent the initial TRUS-Bx either at an outside hospital (n=424, 81.2%) or the Prostate Cancer Center, National Cancer Center in Goyang, Korea (n=98, 18.8%), and the repeat TRUS-Bx at the National Cancer Center (all participants), between 2005 and 2017. All the patients included in this study had at least 12 core biopsies. Those patients who had prostatic intraepithelial neoplasia, high grade, atypical adenomatous hyperplasia, and atypical small acinar proliferation at initial biopsy were all excluded. And those patients who did not undergo the systemic 12 biopsies or had only several targeted biopsies or did not have information about the initial outside biopsy were all excluded. Their clinicopathological records including underlying disease, initial laboratory blood tests with PSA levels before and after biopsy, Gleason score, and clinical TN stages for those diagnosed PC on repeat biopsy were reviewed. All patients had only two pathological reports of initial and repeat prostate biopsies without subsequent later biopsies. The prostatic biopsied indications were high PSA of > 3.0 ng/dL, at least three 3-month-interval consecutive PSA rise despite antibiotic or anti-inflammatory management, prostatic nodule on DRE, and abnormal low-echoic lesion suggesting suspicious malignancy on TRUS.
The TRUS-Bx under local anaesthesia was performed by a single uroradiologist with 20 years of experience. Systemic twelve TRUS-Bx were routinely performed with or without one or two additional targeted-core biopsies, if necessary. The repeat biopsy after the initial biopsy without cancer diagnosis was indicated to be performed within 4-8 weeks after the initial biopsy with sufficient anti-inflammatory treatment or > 2 weeks of antibiotics treatments according to the urologists’ discretion when the PSA level continued to rise or remained similar to the initial PSA levels with/without abnormal nodular lesions or hypoechoic lesions either on DRE or TRUS.
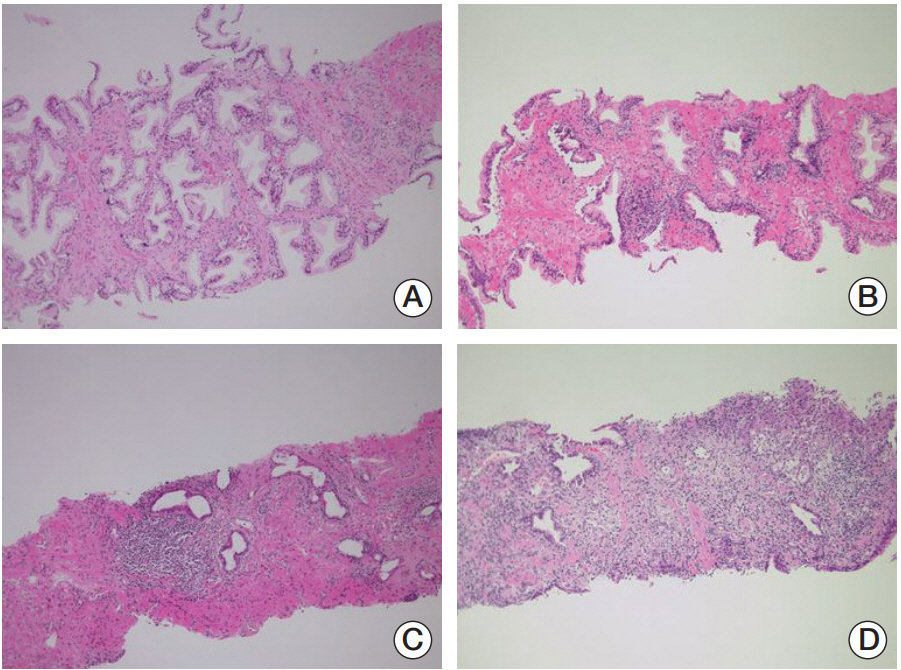
Each 12 biopsy cores with/without one or two additional cores were fixed in buffered formalin and embedded into paraffin blocks and stained with haematoxylin and eosin. The total biopsy length was calculated by adding biopsy core lengths together. The presence of HI and its degree in each biopsied specimen were routinely interpreted on the basis of the presence of mononuclear or polymorphonuclear leukocyte infiltration by one uropathologist (W.S.P.) with 20 years of experience, who was blinded to the study’s aims concerning the original diagnosis of the initial biopsy and the subsequent biopsy (Fig. 1). As for the 438 (83.9%) referred patients after initial biopsy from other hospitals, all the 12 (+2 additional targeted biopsy) systemic biopsied slides were brought to be reviewed unblended manner by the uropathologist to define the degree of HI (Fig. 2). Any slide detected with inflammatory cells was positive under microscopy and the percentage degree (0%-100%) was expressed with the positive inflammatory slides divided by the total number of slides (between 12 and 14 biopsied slides). The degree of HI was recorded routinely in the pathology report as continuous (0%-100%) and binary (0% vs. 1%-100%) variables.
2. Statistical analysis
The association between HI and cancer diagnosis and the comparison between the cancer and non-cancer groups were statistically analysed using Student’s t-test, Wilcoxon’s ranksum test, Pearson’s chi-square test, and the binary logistic regression model with, p < 0.05 considered significant. The sensitivity, specificity, positive predictive value (PPV), and negative predictive value (NPV) of the HI degree in the inital biopsied specimens were assessed to determine the adequate predictive value of HI degree. All analyses were performed by a biostatistician (B.P.) using SAS software, ver. 9.4 (SAS Institute Inc., Cary, NC), and R software, ver. 3.3.3 (R Project for Statistical Computing, Vienna, Austria).
3. Ethical statement
All study protocols were conducted according to the ethical guidelines of the “World Medical Association Declaration of Helsinki-Ethical Principles for Medical Research Involving Human Subjects.” This study was approved by the Institutional Review Board of the Research Institute and Hospital National Cancer Center (IRB No. NCC2018-0012). Written informed consent was waived from the IRB.
Results
1. Baseline characteristics
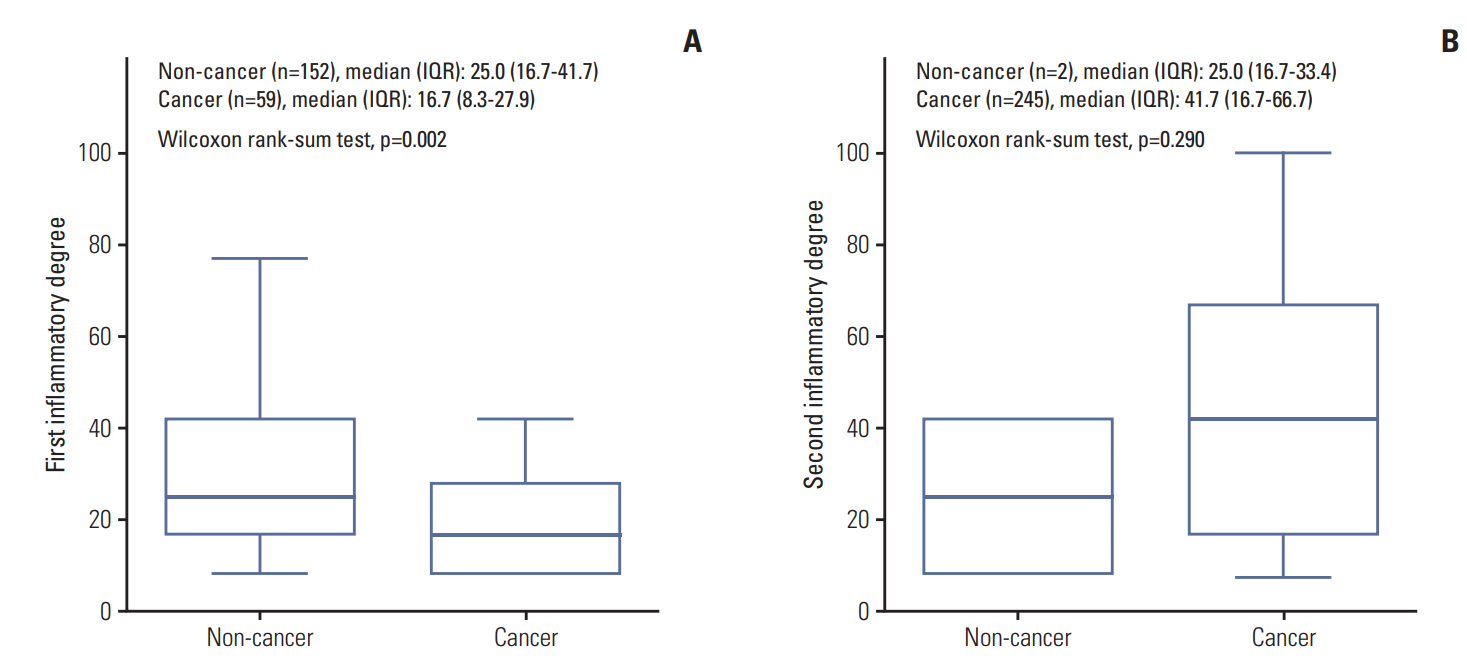
Among the 522 enrolled patients, 258 patients (49.4%) were diagnosed with PC on repeat biopsy. The mean age and median initial PSA level were 67.2 years and 6.5 ng/dL respectively. On the initial prostate biopsied specimens, 211 patients (40.4%) had HI with a median inflammatory extent of 25% (16.7%-33.3%). On repeat prostate biopsied specimens, 247 patients (47.3%) had a median inflammatory extent of 41.7% (16.7%-66.7%) (Table 1).
2. The baseline comparison between the cancer and noncancer groups
The comparison of baseline characteristics including laboratory parameters and underlying diseases showed that the cancer group (n=258) had significantly older, higher initial PSA level and lesser proportion of benign prostatic hyperplasia and prostatitis with a higher rate of hypertension than the non-cancer group (n=264, p < 0.05) (Table 1). Comparison of the cancer revealed that a greater HI specimen in the initial biopsy was associated with fewer PC diagnoses following repeat biopsy (p < 0.001). The rate of patients with HI on initial (57.6% vs. 22.9%) and repeat biopsied (0.8% vs. 95.0%) specimens also showed significant differences (p < 0.001). A significantly lesser degree of HI on initial biopsy (a median degree of HI, 25.0% vs. 16.7%; p=0.002) and insignificantly higher degree of HI on repeat biopsy (25.0% vs. 41.7%, p=0.290) were detected in the cancer group (Table 1). Among the cancer group, the pathological characteristics showed that a median of 33.3% of tumour was detected on repeat biopsy with Gleason scores 8 (11.1%) and 9 (13.5%). The clinical TN stages were 20.4%, 11.0%, and 19.2% of cT3, cT4, and cTxN1, respectively (Table 2).
3. Logistic regression model for cancer diagnosis in initial and repeat biopsy
The degree of HI on initial biopsy had significant association with PC in univariable and multivariable models (p < 0.001) (Table 3). In univariable model, the patients with HI had lower PC diagnoses than the patients without HI (odds ratio [OR], 0.22; 95% confidence interval [CI], 0.15 to 0.32; p < 0.001). The similar results were obtained in the multivariable model with adjusted age and PSA (OR, 0.22; 95% CI, 0.15 to 0.33; p < 0.001; OR, 0.30; 95% CI, 0.20 to 0.44; p < 0.001, for each model). Diagnostic tests to determine the sensitivity, specificity, PPV, and NPV were performed at various cut-off points of HI degree in the initial biopsy (S1 Table). If PC was predicted based on 0% HI degree, the performance values were 77.1% and 57.6% of sensitivity and specificity, respectively. Additionally, if PC was predicted based on HI degree with one of the 12 biopsy cores (8.3%), the performance was 84.1% of sensitivity and 46.6% of specificity.
4. The subgroup analysis for patients underwent both initial and repeat biopsy at same institution
As for the 98 patients who underwent initial and repeat TRUS-Bxs at the National Cancer Center, the comparison of baseline characteristics between the cancer and non-cancer groups showed similar statistical results as that of all 522 patients, with the exception of prostatitis and hypertension being the insignificantly different underlying disease (p < 0.05). Additionally, the degree of HI of the initial biopsied specimen (analysed as a continuous variable) was not significantly different between the cancer and non-cancer groups (p=0.291) (Table 4). Diagnostic tests for the sensitivity, specificity, PPV, and NPV among the 98 patients showed that if PC was predicted based on a 0% HI degree, the performance values were 71.1% and 55.0% for sensitivity and specificity, respectively. Additionally, if PC was predicted based on the degree of HI from one of the 12 biopsy cores (8.3%), the performance was 73.7% for sensitivity and 48.3% for specificity (S2 Table).
Discussion
Despite the initial prostate biopsy yielding negative results for PC, a repeat prostate biopsy is indicated for differentiating PC from other benign prostatic diseases in high-risk patients during active surveillance. This study focused on both the initial and repeat biopsies in relation to HI in the biopsied prostate specimens for screening of PC in patients with a high suspicion of PC.
HI and tumorigenesis are known to be closely related. Among the diverse aetiologies of PC, several instances of chronic HI can cause tumours, and the interaction between immune cells can stimulate tumour cell proliferation, progression, and angiogenesis through producing reactive oxygen species and inflammatory processes, resulting in protein and tissue damage and permanent DNA damage [8,9]. Activation of oncogenes, inactivation of anti-oncogenes or chromosomal rearrangements, and other reasons may also be related to inflammatory processes that activate the nuclear transcription factor in tumour cells, which then promote the tumour cells to produce more chemokines, cytokines, cyclooxygenase 2, and vascular endothelial growth factor, as well as other inflammatory factors [10-12].
HI is not only one of the risk factors of PC, it is also associated with proliferative inflammatory atrophy and prostatic intraepithelial neoplasia, which are precursors of PC cell development [5,13]. The rate of PC incidence reduces after controlling HI with anti-inflammatory agents, which further supports the close relationship between HI and PC development [4,14]. A recent study showed that mRNA and protein expression levels of inflammatory factors, such as inducible nitric oxide synthase, vascular endothelial growth factor, interleukin-2 and -8, and tumour necrosis factor α, were significantly increased in PC, as well as in the benign prostatic hyperplasia+prostatitis group compared to the benign prostatic hyperplasia group (p < 0.05) [11]. Vasavada et al. [14] performed a meta-analysis including 20,585 subjects and 6,641 PC cases and demonstrated that HI on TRUS-Bx was associated with lower PC risk, which was similar to the findings of this study.
However, other biopsy studies, one recent meta-analysis, and another retrospective immunohistochemical study reported no significant association or borderline negative association between HI on biopsied prostate specimens and PC screening on TRUS-Bx [6]. Yli-Hemminki et al. [4] used the histological grading (0-3) degree of acute and chronic HI states in 293 initial prostate biopsies, and indicated that HI in a prostate biopsy was not a useful risk indicator of PC screening.
The present study also showed the significant association between HI on biopsied specimens and PC. Specifically, a significantly lower degree of HI on initial biopsy and an insignificantly greater degree of HI on repeat biopsy were related to PC diagnosis (p < 0.05) (Table 3). This significant finding of HI on initial TRUS-Bx was similar to that of Vasavada et al. [14], and the insignificant HI on repeat TRUS-Bx was similar to the findings presented by Yli-Hemminki et al. [4]. This indicates that already known prostatitis or BPH with rapidly increasing PSA level within a short interval was likely caused by HI, and not by PC itself. The complete absence of HI or at least one core of positive HI on initial biopsy in high-risk patients had a sensitivity between 77.1%-84.1%, with a NPV of 72%-75% and a specificity of cancer screening of 46.6%-57.6% (S1 and S2 Tables).
The insignificantly greater HI on repeat biopsy relating to PC was further analysed in response to the time interval between the initial and repeat biopsies. In the biopsy slides of the 98 patients who underwent both initial and repeat biopsies at the National Cancer Center, PC was detected with greater HI on the repeat biopsy with a shorter time interval between biopsies. This meant that the abruptly increased HI on the prostate with increased PSA velocity had a higher chance of having PC, whereas those with slowly increasing HI with slow PSA velocity had a lesser degree of PC (data not shown) [15].
Thereby, several alternative strategies exist for identifying men who may be at risk for PC, despite negative findings on biopsy sample analysis [2]. The use of other serum PSArelated and urinary measurements, such as urinary transmembrane protease serine 2-E26 transformation specific family membrane gene fusion RNA, enable more sensitive and specific diagnosis and can be combined with the knowledge of clinicopathological features to improve outcomes. Other options include the Food and Drug Administration-approved Progensa PCA3 RNA test and prostate imaging using magnetic resonance imaging (MRI). Newer tissue-based assays that measure methylation changes in normal prostate tissue are currently being developed. A cost-effective strategy is proposed in order to address this challenging clinical scenario, and potential directions of future studies in this area are also described.
As for the clinically significant PC, about 57.5% of patients had a significant Gleason score of > 7, and 33.5% had advanced PC (T3-4N0M0, LN+) (Table 2). Most of the PC had apical lesion tumours (78.6%), similar to previous studies [16]. Prostate biopsy via the transrectal approach has some limitations with regards to underdetection and undergrading of clinically significant PC and the number of cores and location for systematic sampling due to the fact that the direction of the ultrasonographic probe is not easily accessible to the apex of the prostate, as well as the risk of bleeding at the hypervascular apical area [16,17]. Concurrent multiparametric MRI with transperineal prostatic biopsy was recently proposed as a solution to reduce overdiagnosis and subsequent overtreatment, with a 44%-87% detection rate of significant PC; this was similar to the 49.4% missed diagnosis rate from initial biopsy in this study [18,19]. These findings are notable as other studies have reported a 10%-22% detection rate on repeat biopsy [20]. However, a limitation exists for the multiparametric MRI, especially for detecting apical tumours. Lesions that are small in size and are located at the margin of the prostate are unnoticed on diffusion-weighted imaging protocols due to signals received from surrounding benign prostatic tissue that overshadows the lesion [21,22]. In response, Ukimura et al. [17] advised to obtain samples from the anterior apex, anterior lateral horn, and anterior transition zone in the repeat TRUS-Bx to increase the accuracy of detecting PC [23].
This study had several limitations, including its retrospective design and small-sized biopsied samples. Further imaging characteristics of MRI in the cancer group were not assessed to correlate with the HI degree of histologic slides for better understanding of the HI aspects on PC, and the insignificant inflammatory laboratory parameters were not discussed. However, this was the first study to evaluate the extent of HI degree in percentages in both initial and repeat biopsied prostate specimens, and the current debate and clinical dilemma of the significant role of HI of prostate biopsy have been proven in concordance with previous studies. Further studies with prospectively designed biopsies are warranted to solve the serum inflammatory parameters including cytokines and the degree of inflammation on prostate for those PC and non-PC patients.
This study showed a significantly close association between prostatic inflammation and PC on both initial and repeat biopsies. A finding of a lesser degree of HI in the initial and a greater degree of HI in the repeat biopsied specimens was associated with a higher probability of cancer diagnosis in patients with high PSA levels.