Introduction
Though the prognosis of metastatic gastric cancer is dismal, palliative chemotherapy prolongs survival duration and improves quality of life. Evaluation of chemotherapy effect is very important to consider when deciding if chemotherapy should be continued. Response Evaluation Criteria in Solid Tumors (RECIST) have been the standard measurement tool for evaluating of effect of chemotherapy (7). However, RECIST, in using anatomic information only (tumor size), significantly underestimates the initial tumor response to imatinib in patients with metastatic gastrointestinal stromal tumors (GISTs). [18F]-fluorodeoxyglucose ([18F]-FDG) uptake is enhanced in most malignant tumors, and this uptake can be measured using positron emission tomography (PET). [18F]-FDG-PET has been suggested as an early, sensitive marker of tumor response to anticancer drugs through the observation of changes in glucose metabolism in tumors. Recently, FDG-PET has been shown to be highly sensitive in detecting early responses in patients with GISTs; it has also been shown to be useful in the prediction of long-term responses to imatinib mesylate (1-6,8). However, FDG-PET has been rarely used to report liver metastases in gastric adenocarcinoma. We report a gastric adenocarcinoma patient with liver metastasis who showed progressive disease on computed tomography (CT), but who did not have true progression in terms of metabolic activity measured by FDG-PET.
Case Report
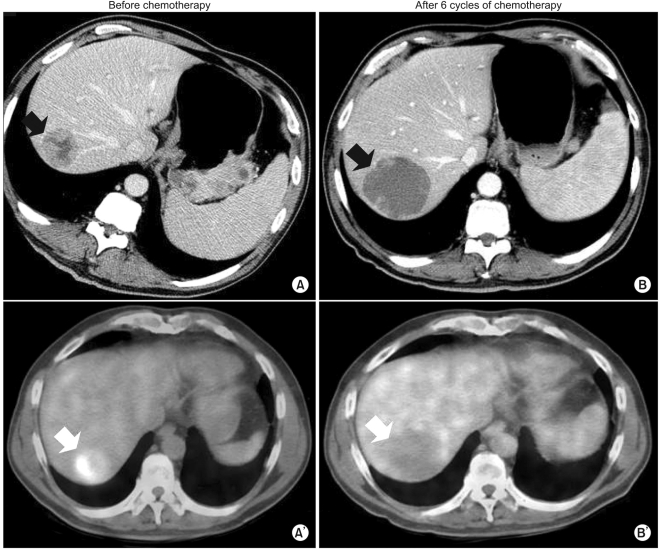
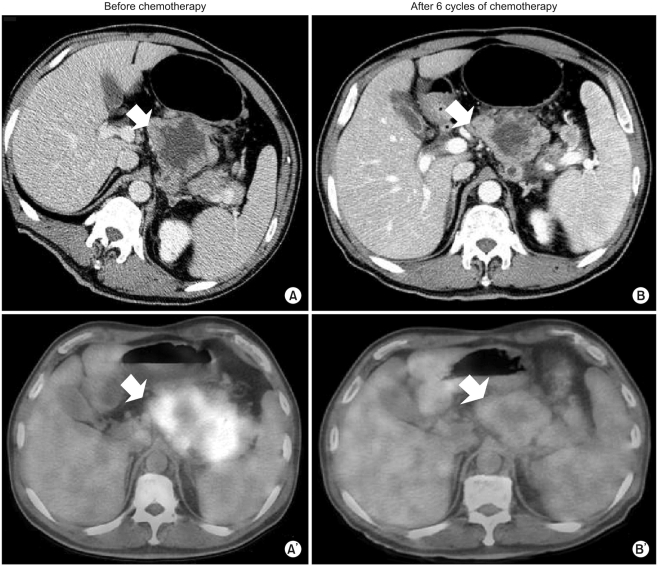
Our patient was a 54-year-old man diagnosed with gastric adenocarcinoma with multiple enlarged lymph nodes and liver metastases. His chief complaints were abdominal discomfort and easy fatigue. Baseline CT was performed before chemotherapy (Fig. 1A, 2A). Tumor markers such as αFP, CEA, and CA19-9 were within normal limits. Baseline FDG-PET was also performed (Fig. 1A', 2A'). The patient was treated with combination chemotherapeutic agents composed of oxaliplatin, 5-fluorouracil (5-FU), and leucovorin, called for in the modified FOLFOX-6 regimen (oxaliplatin 85 mg/m2 on day 1, leucovorin 75 mg/m2 on days 1 and 2, 5-FU IV bolus 400 mg/m2 on days 1 and 2, 5-FU continuous infusion 1,500 mg/m2 on days 1 and 2). This regimen was repeated every two weeks. After three cycles of chemotherapy (six weeks after the start of chemotherapy), CT scans were performed. The response was "stable disease" according to RECIST, though the sizes of the metastatic hepatic masses and lymph nodes had slightly increased (less than 20%). There were no new lesions. After six cycles of chemotherapy, the sizes of the metastatic liver masses had definitively increased more than 20% above the original tumor size according to CT scans (Fig. 1B). However, the maximum paraaortic lymph node diameter had decreased from 8.8 cm to 7.0 cm (Fig. 2). The hepatic masses had also developed a cystic and necrotic appearance, in contrast to the original masses, which contained mostly solid portions with little central necrosis (Fig. 1). We were not sure that this increase in diameter on CT represented true tumor progression in light of the metabolic activity of the tumor, because the patient showed clinical improvement. Abdominal discomfort and easy fatigue disappeared after chemotherapy. In addition to preservation of good performance status, the albumin level, cholesterol, and body weight reflected the clinical benefits of chemotherapy. Tumor markers such as αFP, CEA, and CA 19-9 remained at normal levels. We required more information to determine if we should change the chemotherapy regimen. The metabolic activity was checked using FDG-PET. Interestingly, we did not identify hypermetabolism in the hepatic metastases on FDG-PET images compared to the initial images, which showed a maximum standardized uptake value (SUV) of 5.2 (Fig. 1). The maximum SUV of the lymph nodes decreased from 7.6 to 2.4 (Fig. 2). Collectively, the patient showed metabolic partial remission (PR) according to the maximum SUV on FDG-PET. We decided to continue the same chemotherapy regimen because we regarded the overall tumor response as good. The patient successfully underwent palliative chemotherapy until the twelfth chemotherapy cycle, with the same regimen. The patient is still alive 12 months after diagnosis.
Discussion
RECIST is considered the standard method for evaluating responses in solid cancers. The main reason the RECIST criteria can be substituted for the WHO criteria is that the former is reliable and reproducible in the evaluation of tumor responses, despite its simplicity. It measures the uni-dimension of maximum diameter in each mass and compares it to the WHO criteria, which use bidimensional measurements (7).
However, there is increasing evidence to suggest that the RECIST criteria are limited in the evaluation of tumor responses when used in GISTs. Imatinib mesylate (Glivec) has elicited dramatic responses in GISTs with c-kit mutations, and it is now the standard treatment for unresectable or metastatic GISTs. By increasing the use of Glivec in hepatic GISTs, one can see that tumor size increases with treatment so that the RECIST criteria indicate progressive disease (PD) even though the solid portions of the tumor become cystic or necrotic. This change cannot be defined as tumor progression. Hence, it is not uncommon for there to be discordance between the RECIST criteria measured by CT and the metabolic response measured by FDG-PET in metastatic hepatic GISTs.
However, the CT evaluation of hepatic metastases of gastric adenocarcinoma correlates well with the true tumor response. To our knowledge, there have been few reports addressing the discordance between the RECIST criteria with CT and the metabolic activity with FDG-PET. Even though there have been some reports addressing inconsistency between the RECIST criteria with CT and the metabolic response with FDG-PET in liver GISTs, there have been no reports of liver metastasis in the setting of gastric adenocarcinoma. We described one patient who exhibited this discordance. To our knowledge, this is the first report to address this inconsistency in detail. The response evaluation of liver metastases should be conducted more carefully in the setting of gastric cancer, especially when the masses turn cystic or necrotic. A more thorough evaluation with FDG-PET and CT, in addition to tumor markers, could be helpful in determining effective chemotherapy.