Revolutionizing Non–Small Cell Lung Cancer Diagnosis: Ultra-High-Sensitive ctDNA Analysis for Detecting Hotspot Mutations with Long-term Stored Plasma
Article information

Abstract
Purpose
Circulating cell-free DNA (cfDNA) has great potential in clinical oncology. The prognostic and predictive values of cfDNA in non–small cell lung cancer (NSCLC) have been reported, with epidermal growth factor receptor (EGFR), KRAS, and BRAF mutations in tumor-derived cfDNAs acting as biomarkers during the early stages of tumor progression and recurrence. However, extremely low tumor-derived DNA rates hinder cfDNA application. We developed an ultra-high-sensitivity lung version 1 (ULV1) panel targeting BRAF, KRAS, and EGFR hotspot mutations using small amounts of cfDNA, allowing for semi-quantitative analysis with excellent limit-of-detection (0.05%).
Materials and Methods
Mutation analysis was performed on cfDNAs extracted from the plasma of 104 patients with NSCLC by using the ULV1 panel and targeted next-generation sequencing (CT-ULTRA), followed by comparison analysis of mutation patterns previously screened using matched tumor tissue DNA.
Results
The ULV1 panel demonstrated robust selective amplification of mutant alleles, enabling the detection of mutations with a high degree of analytical sensitivity (limit-of-detection, 0.025%-0.1%) and specificity (87.9%-100%). Applying ULV1 to NSCLC cfDNA revealed 51.1% (23/45) samples with EGFR mutations, increasing with tumor stage: 8.33% (stage I) to 78.26% (stage IV). Semi-quantitative analysis proved effective for low-mutation-fraction clinical samples. Comparative analysis with PANAMutyper EGFR exhibited substantial concordance (κ=0.84).
Conclusion
Good detection sensitivity (~80%) was observed despite the limited volume (1 mL) and long-term storage (12-50 months) of plasma used and is expected to increase with high cfDNA inputs. Thus, the ULV1 panel is a fast and cost-effective method for early diagnosis, treatment selection, and clinical follow-up of patients with NSCLC.
Introduction
The assessment of targetable driver mutations and treatment-resistance mutations in non-small cell lung cancer (NSCLC) can help to guide therapeutic decision-making [1-4] and real-time monitoring of treatment responses and disease progression in patients [5]. Moreover, it can aid in verifying the absence or presence of minimal residual disease after tumor resection surgery [6]. Therefore, the accurate identification of epidermal growth factor receptor (EGFR) mutations in patients with NSCLC is the first step in treatment decisionmaking and can be utilized as a critical indicator of patient health. While tumor tissue is considered the gold standard for the detection of oncogenic alterations, liquid biopsies have recently emerged as an alternative to tissue biopsies, with advantages including minimally invasive procedures, low risk of complications, and better representation of tumor heterogeneity [7]. Liquid biopsies can target circulating cell-free DNA (cfDNA). Notably, circulating tumor DNA (ctDNA) released from cancer patients can be used for the real-time monitoring of DNA mutations and tumor burden, providing useful information for predicting the condition of cancer patients [8,9]. However, the use of cfDNA for disease diagnosis and prognosis has several limitations, such as the admixture of excessive wild DNA, and the high variation in the fraction of ctDNA in total cfDNA which can range from 0.1% to 90% [10]. Thus, clinical samples with low variant allelic frequencies (VAFs), as low as ≤ 1%, are not suitable for detecting mutant alleles using methods with a low detection limit, such as low-coverage sequencing and Sanger sequencing.
In previous work, we developed an improved approach, the Onco Ultra-High-Sensitivity (OncoUHS) assay, based on a combination of the MassARRAY platform and amplification-refractory mutation system (ARMS)–polymerase chain reaction (PCR), which was applied for the detection of hotspot mutations in patients with colorectal cancer by using plasma samples with very low variant allele fractions [11]. In the present study, a new panel was designed, namely, the ultra-high-sensitivity lung version 1 (ULV1) panel, which comprised frequently mutated genes in patients with NSCLC. We evaluated the performance of this panel in the analysis of cfDNA from 104 patients with NSCLC. Our findings suggest that the ULV1 panel is a simple, rapid, highly sensitive, and cost-efficient method for the detection of somatic mutations in patients with NSCLC.
Materials and Methods
1. Plasma samples and positive control
The plasma cohort consisted of samples collected from 104 patients with NSCLC in various stages at Asan Medical Center between 2011 and 2018. cfDNA was extracted from only 1 mL of plasma using an STB cell-free DNA kit (Syntekabio, Seoul, Korea), according to the manufacturer’s instructions. Extracted cfDNA was quantified using Bioanalyzer High Sensitivity DNA Analysis (Agilent Technologies, Santa Clara, CA) and stored at −80°C until further use. Previously analyzed data on EGFR mutations in the matched tissue samples from the same patients, using targeted nextgeneration sequencing (NGS) assay or different diagnostic platforms at Asan Medical Center, were used to assess the concordance rate of EGFR mutations detected in cfDNA with the ULV1 panel or targeted NGS.
The ctDNA Complete Mutation mix (#0710-0531, SeraCare, Milford, MA), seven cell lines (AsPC1, H1975, HCC827, HCT-15, HT-29, SW900, and PC9), and four synthetic plasmids were used as positive controls for evaluating the analytical performance of ULV1 panel (S1 Table). Cell line-derived gDNA was extracted using a NEXprep FFPE tissue kit (#NexK-9000, Genes Laboratories Inc., Yongin, Korea), according to the manufacturer’s instructions and quantified using the Qubit dsDNA HS Assay kit (Thermo Fisher Scientific, Waltham, MA) and stored at −20°C until use. Genomic DNA extracted from HL-60 cells expressing wildtype BRAF, KRAS, and EGFR was used as a negative control. Each mutant allele positive DNA was serially diluted with HL-60 (wild-type control) genomic DNA to generate the following mutant-to-wild-type allele fractions: 100%, 10%, 5%, 1%, 0.5%, 0.25%, 0.1%, 0.05%, 0.025%, and 0%. Next, these DNA series were used as templates to determine the detection limits of each assay and compare the performance of the different methods.
2. Analysis of hotspot mutations using ULV1 panel
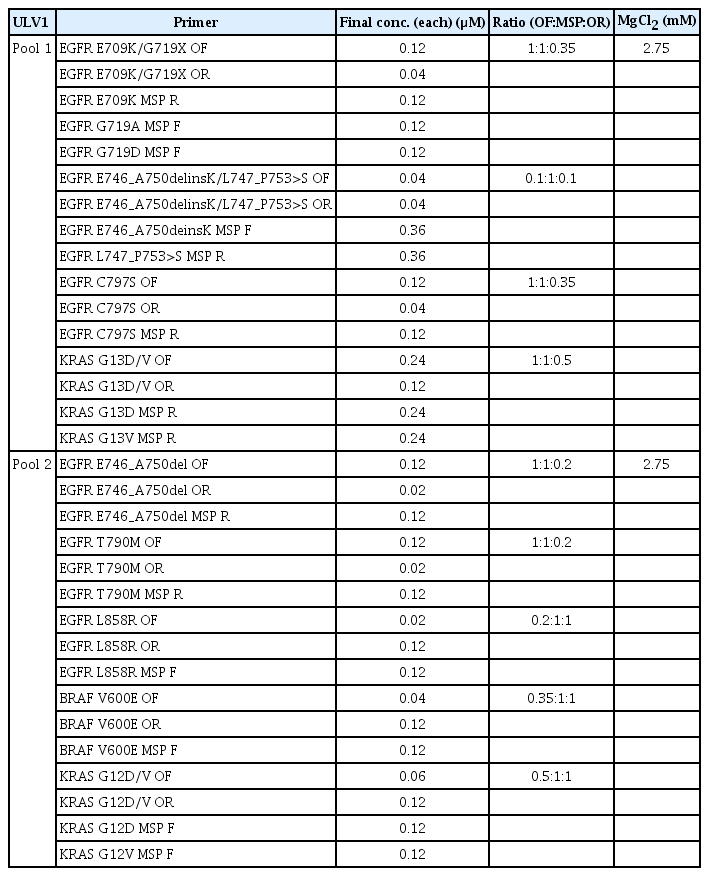
The ULV1 panel was designed to detect 14 hotspot mutations of BRAF, KRAS, and EGFR genes that were common in patients with NSCLC via a two-pool multiplexing method based on the ultrahigh sensitive (UHS) assay, combining additional mutant-specific primer (MSP) and common outer primer sets (Fig. 1A). Outer PCR primer sets and single base extension primers were designed using the Assay Designer of MassARRYA Typer 4.0 software (Agena Bioscience, San Diego, CA), according to the manufacturer’s instructions. MSPs containing mismatched bases between the first and fourth base positions from the 3′-termini of primer were manually designed in the opposite direction to the single base extension primer for each mutant locus. Primer sequences used in this study are listed in Table 1. PCR amplification was performed using 34.6 ng of input DNA under optimal conditions. After multiplex PCR amplification, serial sequential steps were followed according to the manufacturer’s instructions.

Performance of the ultra-high-sensitivity lung version 1 (ULV1) panel. (A) Diagrams illustrating the principles of ultrahigh sensitive polymerase chain reaction (PCR) applied to obtain Enriched variant allelic frequency (VAF) in the ULV1 panel compared with conventional PCR. (B) Direct comparison of ULV1 panel and conventional iPLEX sensitivity using serially diluted H1975 gDNA demonstrated stronger intensity of mutant signal with ULV1 panel (red arrow) compared to iPLEX in the same sample. Wild signal intensity indicated with black arrow. (C) Amplification efficiency and sensitivity of ULV1 panel. Assays had different cutoff values depending on multiplexing amplification efficiency. Red dashed line indicates the mean cutoff value. Blue and green dotted lines indicate the acceptable cutoff ranges. (D) Amplification curve shape of enriched VAF versus initial VAF. Initial and enriched VAFs of positive samples shown on the x- and y-axis, respectively. All assays showed enriched VAF saturation over 1% initial VAF.

Primer sequences of the ULV1 panel
3. Targeted NGS analysis of cfDNA using CT-ULTRA
To evaluate the somatic mutational profile of each cfDNA, NGS analysis was performed using the CT-ULTRA, which was developed specifically for specimens with low VAFs. DNA libraries of each cfDNA with various input amounts (1.9-10 ng) were prepared via sequential reactions of end repair, A-tailing, and ligation with a TruSeq adaptor using a SureSelectXT Reagent kit (Agilent Technologies).
Each library was denoted with a sample-specific unique sequencing barcode (6 bp) and quantified using the Qubit dsDNA HS Assay kit before pooling 12-20 libraries (yielding a total of 750ng) for target capture using the Agilent SureSelectXT custom kit (OP_AMC_ctV1.3 RNA bait; Agilent Technologies). A CT-ULTRA panel was designed to target a total of 118 genes, including the entire exons of 88 genes, the partial introns of four genes that are often rearranged in solid cancer. The captured libraries were enriched by limited PCR, followed by measurement using the Qubit kit then sequenced using the NextSeq 550 platform (Illumina, San Diego, CA) in paired-end mode. Sequenced reads were aligned to the human reference genome (NCBI build 37) using Burrows-Wheeler Aligner (0.5.9) in default mode, and PCR de-duplication was performed using a Picard’s MarkDuplicates package. After the initial alignment process, de-duplicated reads were re-aligned at known indel positions with the GATK4 BaseRecalibrator tool (ver. 4.1.3.0). Then, the base quality was recalibrated using the GATK4 ApplyBQSR tool and used as final BAM for variant calling. The Mutect2 tool was used for the somatic variant calling of single nucleotide variants (SNV) and short indels. Germline variants from the somatic variant candidates were filtered out using the Single Nucleotide Polymorphism database (dbSNP, build 141; found in > 1% of samples), Exome Aggregation Consortium database (ExAC; r0.3.1, threshold frequency 0.001), Korean Reference Genome database (KRGDB), and an in-house panel of normal controls. After additional filtering using GATK4 FilterMutectCalls tools, final somatic variants were annotated using the Variant Effect Predictor (ver. 86), which were then converted to the Mutation Annotation Format file format using vcf2maf. The manual curation of SNV and indel alterations were performed carefully using the Integrative Genomics Viewer (IGV).
4. Limit of detection comparison with PANAMutyper test for three hotspot mutations
The PANAMutyper R EGFR kit (Panagene, Daejeon, Korea) based on the real-time PCR analysis was used to verify that ULV1 had comparable performance to other platforms in terms of EGFR hotspot mutations. EGFR assays were performed according to the manufacturer’s instructions. For PCR amplification, 5 μL of DNA template, including 34.6 ng of DNA, was added to 19 μL of each master mix and 1 μL of Taq DNA polymerase. Next, PCR reactions were performed using the CFX96 real-time PCR detection system (Bio-Rad Laboratories Inc., Hercules, CA) following the thermal cycling program. Then, amplification and melting curves measured from each fluorescent dye were generated, and the genotype of each sample was determined according to each assay threshold and their melting temperature range. Sample analysis was repeated at least three times, and ULV1 tests were conducted simultaneously using the same samples for direct comparison with PANAMutyper. The agreement between ULV1 and PANAMutyper was assessed using Cohen’s kappa value.
5. Statistical analysis
Raw data produced by the MassARRAY system were further analyzed by assessing the signal-to-noise ratio (SNR) value for extension analytes. To clearly distinguish between mutant samples, enriched VAF was calculated using the following equation: Enriched VAF (%)=[Mutant peak SNR/(Mutant peak SNR+Wild-type peak SNR)]×100.
To evaluate the characteristics of diagnostic potential, the receiver operating characteristic (ROC) curve and the area under the ROC curve were determined for the highest sensitivity, specificity, and cutoff value using the pROC package in R (R Foundation for Statistical Computing, Vienna, Austria). Mean cutoff values with standard deviations (SDs) for each assay were measured using 10 possible combinations generated by extracting three replicate values from five replicates.
The concordance rate of EGFR hotspot mutations was measured by dividing the number of EGFR hotspot mutations in cfDNA identified in ULV1 and/or CT-ULTRA by the number of only EGFR hotspot mutations identified in tissues. The concordance rate of EGFR overall mutations was also calculated by dividing the number of EGFR mutations of cfDNA identified in ULV1 and CT-ULTRA by the number of total EGFR mutations identified in matched tumor tissue DNA.
Results
1. Mutant allele selective amplification using ULV1 panel
The optimal primer conditions for the ULV1 panel were determined based on the asymmetric primer concentration between the outer and MSP primers in a multiplexing manner. The detection limit of the EGFR L858R mutation using a conventional PCR product amplified with an outer primer set was only approximately 5%, which is consistent with the diagnostic sensitivity of iPLEX chemistry disclosed by the manufacturer. No mutation signal was detected in the positive samples with low mutant fractions (less than 5%) (Fig. 1B). However, the ULV1 product amplified by adding the appropriate concentration of MSP for selective enrichment of the mutant allele showed a clear mutation signal, even in a 0.1% positive sample. Furthermore, the mutation signal increased with the ratio of MSP compared with that of the outer primer in the same direction (S2A Fig.). For the EGFR L858R mutation, the ratio of the outer reverse primer (the same direction of MSP) to MSP was 0.2:1 (the final concentrations were 0.02 μM and 0.12 μM, respectively). In the wild-type control sample, no mutant signal was detected under any primer conditions.
Considering that the ULV1 panel is based on multiplex PCR, the effect of different MgCl2 concentrations (3.5 mM, 3 mM, 2.7 mM, 2.3 mM, and 1.875 mM) was investigated using a ctDNA Complete Mutation mix with a 0.5% mutant allele fraction. Although mutant signals were clearly detected in all mutations at MgCl2 concentrations of 2.3 mM to 3.5 mM, no signal was detected at low MgCl2 concentrations (1.875 mM) due to amplification failure (S2B Fig.). As such, the best conditions for maintaining the balance of wild-type amplification while having the highest intensity of the mutant signal without non-specificity were adopted as the final experimental conditions (Table 2).
Optimal conditions of the ULV1 panel
2. Performance of ULV1 panel with high analytical sensitivity and specificity
To examine the diagnostic performance of the ULV1 panel, a total of 180-250 DNA samples consisting of 35-70 positive (five replicates for each positive with mutant allele proportions of 5%, 1%, 0.5%, 0.25%, 0.1%, 0.05%, and 0.025%) and 145-215 negative controls (S1 Table) for each target hotspot mutation were tested depending on the pool of the ULV1 panel, followed by ROC curve analysis to determine the cutoff values for each mutation. The markedly increased mutant signal intensity by UHS assay was termed enriched VAF, which was calculated as the ratio of the mutant signal to the sum of mutant and wild signals. The cutoff values of enriched VAF for identifying each positive mutant were different for each mutation. Although the efficiency of mutant allele selective enrichment by the UHS assays showed slight differences between target mutations, all assays except KRAS G12D showed high sensitivity (85.7%-100%) and specificity (87.9%-100%) with a 0.025%-0.1% limit of dectection (LOD). In the case of KRAS G12D, the sensitivity and specificity were 80% and 91.7% with a 0.1% LOD, respectively (Tables 3 and 4).

Performance of EGFR assays in the ULV1 panel

Performance of BRAF and KRAS in the ULV1 panel
The amplification efficiency between the initial VAF of the positive samples, and the enriched VAF of the UHS products were evaluated for all 14 hotspot mutations in the ULV1 panel (Fig. 1C). Owing to the nature of the UHS assay designed for the selective enrichment of mutant alleles, all positive samples with a mutant fraction greater than 1% exhibited saturated enriched VAF (Fig. 1D).
3. Application of the ULV1 panel using cfDNA from patients with NSCLC
We assessed the diagnostic potential of the ULV1 panel for NSCLC by analyzing the mutational patterns of cfDNAs from 104 patients and comparing the results with matched tumor tissue DNA. We also performed targeted NGS analysis on the same cfDNAs and determined the concordance rate with ULV1 panel analysis. Patient characteristics are presented in Table 5, and the tumor tissue DNA had been previously screened for EGFR somatic mutations using various platforms. A total of 81 EGFR mutations were identified in 80 of 104 tumor tissue DNA samples (76.9%) consisting of 37 cases of exon 19 deletions (45.7%), 34 cases of L858R (42%), three cases of G719X (3.7%), one case of T790M (1.2%), and six cases of other EGFR mutations (7.4%). Overall, EGFR mutations in cfDNA were detected in 23/81 cases (28.4%) and 26/81 cases (32.1%) by the ULV1 and CT-ULTRA panels, respectively. The detection rate of EGFR mutations in cfDNA was significantly different depending on the tumor stage of the patients with NSCLC from whom cfDNA was extracted, regardless of the mutation detection method used or the location of the mutation. As the tumor stage progressed, the detection rates of EGFR mutations in cfDNA using the ULV1 or CT-ULTRA panels gradually increased. In the initial stages (stage I or II), few mutations were detected in most cfDNA (red boxes; detected by neither method). By contrast, the number of blue (detected by both methods), orange (detected by ULV1 only), and green (detected by CT-ULTRA only) boxes increased (Fig. 2A) in the late stages (stage III or IV). No EGFR mutations were detected in the remaining 24 patient samples, regardless of the testing methods applied to both FFPE tissue DNA and cfDNA (pink).

Characteristics of 104 patients for ULV1 and CT-ULTRA test

Validation of the ultra-high-sensitivity lung version 1 (ULV1) panel using 104 patient samples. (A) Mutational profiling and concordance between tumor tissue and matched plasma in 104 patients. The heatmap shows mutational concordance between tissue and plasma samples of each patient and between plasma methods. (B) Association of cell-free DNA (cfDNA) concentration with advanced cancer stage. (C) Comparison of epidermal growth factor receptor (EGFR) variant allelic frequency (VAF) between stages. High VAF of cfDNA is associated with advanced cancer. (D) Concordance rate comparison of EGFR hotspot mutations in tissue and matched plasma. Gray bars represent tissue EGFR hotspot mutations. Red and blue dotted lines show the concordance rate of EGFR hotspot mutations identified by ULV1 and CT-ULTRA compared to tissue. FFPE, formalin-fixed paraffin-embedded; ns, not significant; *p < 0.05, ***p < 0.001.
The average concentration of cfDNA extracted from the plasma of 104 patients with NSCLC was 11.4 ng/mL (range, 2 to 169 ng/mL), and the cfDNA concentration according to tumor stage showed a statistically significant difference only when comparing stages I and IV (p < 0.05). No differences were observed among the other stages (Fig. 2B). The median VAF of the EGFR mutation in cfDNA identified using CT-ULTRA was 5.0% (range, 0.8% to 50.2%), with a significantly higher VAF value at stage IV than at the other stages (Fig. 2C).
When limiting our analysis to the hotspot mutations included in the ULV1 panel, the concordance rates of the mutations detected in cfDNA by the ULV1 and CT-ULTRA panels, with the EGFR mutations detected in the patient’s tumor tissues were 51.1% (23/45) and 44.4% (20/45), respectively. As tumors progressed to stages I, II, III, and IV, the detection rates of the EGFR hotspot mutations in cfDNA using the ULV1 panel gradually increased to 8.33% (1/12), 25% (1/4), 50% (3/6), and 78.26% (18/23), respectively. Although a similar trend was observed in the CT-ULTRA analysis, it was relatively lower than that of the ULV1 analysis. In samples of tumors at stages II and III, ULV1 analysis showed a significantly higher concordance rate than that of CT-ULTRA analysis (Fig. 2D). The concordance rate of EGFR overall mutations between the patient’s tumor tissues and matched plasma samples gradually increased in the ULV1 panel compared to CT-ULTRA, while the concordance rate at stage IV was higher in CT-ULTRA (S3 Fig.). Three EGFR mutations, two L858R mutations, and one T790M mutation were only detected in the ULV1 panel analysis. A comparison of EGFR hotspot mutations detected by ULV1 and CT-ULTRA is provided in Table 6.

Variants detected in cfDNA by the ULV1 panel only
4. Feasibility of semi-quantitative analysis of ULV1 panel
Positive samples with low mutant allele fractions (less than 1%) showed a relatively good correlation between the initial VAF and the enriched VAF, with almost linear phased enrichment (Fig. 3A). These results indicated the feasibility of semi-quantitative analysis using the ULV1 panel for clinical samples with low mutation fractions, such as cfDNA extracted from the plasma of patients with cancer. Indeed, the enriched VAFs of EGFR mutations detected by the ULV1 panel in 104 NSCLC patient samples gradually increased as the initial VAFs identified by CT-ULTRA increased (Fig. 3B). Notably, in samples with less than 1% initial VAF, semi-quantitative analysis for prediction of initial VAF using enriched VAF was possible (Fig. 3C).

Feasibility of semi-quantitative analysis. (A) Semi-quantitative detection range. The linear relation between the initial variant allelic frequency (VAF) and the enriched VAF identified by positive samples was in the range of 0.025%-1%. (B) Amplification curve shape between the CT-ULTRA VAF and the enriched VAF in patient samples. The CT-ULTRA VAF and the enriched VAF in each patient sample are shown on the x-axis and y-axis as a percentage. The saturation of enriched VAF was shown in patient samples with CT-ULTRA VAF of more than 1%. (C) Correlation between initial VAF and expected VAF obtained by CT-ULTRA and ultra-high-sensitivity lung version 1 (ULV1), respectively. Expected VAF for each epidermal growth factor receptor (EGFR) mutation was measured using the respective equations shown in Fig. 3A.
5. Comparison of ULV1 and PANAMutyper R EGFR performances
To evaluate the diagnostic performance of the ULV1 panel and the Korean Food and Drug Administration-approved PANAMutyper kit, a total of 21 DNA samples consisting of 18 positive (3 replicates for each positive with mutant allele proportions of 1%, 0.5%, 0.25%, 0.1%, 0.05%, and 0.025%) and three negative (three replicates for each negative with mutant allele proportion of 0%) samples for each hotspot were tested. To ensure an accurate comparative analysis, the ULV1 panel was simultaneously tested using the same samples, the results of which are shown in Table 7. Assays for exon 19 deletions and L858R showed comparable detection rates regardless of the method used, whereas the detection rate of T790M was enhanced at low mutation fractions in ULV1. Cohen’s κ coefficient showed an almost perfect concordance between ULV1 and PANAMutyper R EGFR for EGFR detection (κ=0.84).

Direct comparison between ULV1 and PANAMutyper
Discussion
The ULV1 panel was developed to detect hotspot mutations in NSCLC patients with high sensitivity using cfDNA samples with low fractions of tumor-derived mutations. Selective amplification of minor mutant alleles from excess wild type was achieved by applying the ARMS method with optimization of additional MSP ratio to the outer primer (S2A Fig.) and the MgCl2 concentration (S2B Fig.). The enriched mutant products provided better sensitivity, as shown by the red arrow in Fig. 1B. Although several methods with high sensitivity have been developed, the detection of mutations in cfDNA is often limited by low levels of cfDNA amount [12]. To overcome limited amounts of cfDNA, DNA libraries were constructed from all limited samples, including clinical and positive materials, by ligating them with an NGS adaptor. This approach preserves limited clinical samples as amplified amounts, improves the detection rates of positive samples, and allows for further analysis, such as through NGS. The constructed cfDNA libraries were used as templates for the ULV1 panel and targeted NGS in this study. Sufficient cfDNA libraries were constructed in the range of 271 to 1,290 ng without bias to wild-type and mutant alleles using small amounts of cfDNAs (1.9-10 ng) from the plasma of 104 patients. The low amount of cfDNA used in this study may be due to the use of only 1 mL of plasma for extraction and the long-term storage of plasma (> 12 months) prior to extraction. Indeed, the storage term of plasma samples in stage IV tends to be shorter than that of plasma samples in stages I-III with low mutational concordance rates (Fig. 4). This result supports the observation that long-term storage of both extracted cfDNA and plasma samples induces DNA fragmentation, leading to reduced cfDNA yield [13]. Typically, studies involving cfDNA utilize specialized collection containers or prioritize swift extraction within a short timeframe (a few hours to days). This is due to the limited quantity of cfDNA obtainable from plasma (a few to tens of nanograms), its short half-life, and potential cfDNA fragmentation with prolonged storage. In contrast, our study aimed to demonstrate the applicability of the ULV1 panel even in challenging scenarios. We utilized cfDNA from 1 mL of plasma collected from 104 cancer patients stored for over 12 months. Our intention was to showcase that the ULV1 panel enables mutation analysis even with cfDNA extracted from samples subjected to suboptimal conditions. To accurately detect somatic alterations in samples with few target mutations, an optimal cutoff value is needed. ROC curve analysis was used to evaluate the efficiency of the ULV1 panel, and different cutoff values were set for each mutation. The cutoff value for each mutation was determined by the limitations of multiplex PCR, including uneven amplification, non-specific products, and interference between primers targeting mutations in the same or adjacent positions. These issues were identified in KRAS assays, except for the G12V assay. The KRAS G12D assay had the lowest amplification efficiency (Fig. 1D), resulting in the lowest enriched VAF in all ranges and hindering the distinction between positive and negative samples. The G13D and G13V assays exhibited relatively low specificity. The G13D assay identified sporadic non-specific products that were not biased toward specific samples in false positives, whereas the G13V assay showed low specificity due to the G13D-positive sample contributing to the non-specific product. Furthermore, non-specific products were generated for EGFR E746_A750delinsK positive samples with mutant fractions over 5% in the E746_A750del assay due to incorrect priming of the E746_A750del MSP to E746_A750delinsK, a similar mutation in the immediately adjacent region. Therefore, in cases where the mutation fraction of EGFR E746_A750delinsK is greater than 5%, falsepositive signals for the E746_A750del mutation may occur along with a true-positive signal for the E746_A750delinsK mutation. However, since the mutant signal of E746_A750del delinsK is considerably higher, and these two mutations rarely coexist, this would not represent an obstacle in distinguishing the types of exon-19 deletions (data not shown).

Distribution of plasma storage duration between stages in the cohort. Plasma samples from patients with advanced cancer showed that the plasma storage time was relatively short.
Next, to assess clinical applicability, we analyzed hotspot mutations in 104 NSCLC patients’ cfDNA and tumor tissue DNA using targeted NGS and ULV1 panel. Compared to the previous studies evaluating cfDNA as a diagnostic sample by assessing concordance of somatic alterations between matched cfDNA and tumor tissue using targeted NGS [14,15] our study has several limitations. First, as mentioned, the initial amount of cfDNA used in this study was low, explaining the lower mutation concordance rate between tumor tissue and cfDNA than previous studies. Fraction of ctDNA are typically < 0.1% VAF in stage I lung cancer patients [16], resulting in 2-3 mutant alleles copies in < 10 ng cfDNA. The limited sample volume of 1 mL affected early-stage plasma samples, which were stored longer than those in stage IV. In addition, such small ctDNA copies may be lost during clean-up steps in DNA library construction, possibly causing discordance in early stages, regardless of the method used. Higher input of cfDNA and advanced cancer stages have been reported to increase detection rates [16,17]. Therefore, increasing plasma volume may be required to improve the sensitivity of mutation detection using cfDNA from early-stage patients. Second, a sequencing depth of at least 1,000×is required to detect mutations with 0.1% VAF, whereas the mean target coverage of 300× used in this study resulted in false negatives for ctDNA below the NGS detection limit. Third, only 19 out of 104 tissue samples were tested using the NGS, while others were tested for EGFR-specific mutations with different diagnostic platforms. Notably, additional T790M and E709K mutations were detected in AMC075 and AMC077 patients in stage IV using both methods with cfDNA, but not in the tissue samples (Fig. 2A, purple), indicating that differences in detection methods between tissue and cfDNA affect concordance rate.
Interestingly, the ULV1 panel showed slightly better concordance with tumor tissue mutations than targeted NGS in analyses using the same cfDNA library (Fig. 2A, orange). ULV1 panel outperformed targeted NGS in stages II and III, where all identified mutations were L858R oncogenic drivers. However, the ULV1 panel had a lower concordance rate than targeted NGS in stage IV due to some mutations not being included in the ULV1 hotspot panel (S3 Fig.). The six cases highlighted in green in Fig. 2A represent such instances, and the detected EGFR mutations within these cases were all relatively rare types of EGFR variants, distinct from the hotspot mutations designed for detection by the ULV1 panel. By selecting only hotspot mutations included in the ULV1 panel, it was confirmed that the ULV1 panel resulted in a slightly higher concordance rate than targeted NGS in stage IV, along with stages II and III (Fig. 2D). Notably, in three patient samples (AMC036, 044, and 070), each EGFR mutation consistent with tumor tissue was detected in the ULV1 panel but not in the targeted NGS (Fig. 2A, orange). To determine ctDNA levels, VAFs of mutations were evaluated in cfDNA samples using targeted NGS (Table 6). Somatic alterations in cfDNA usually have lower VAFs than solid tumor tissues due to the low proportion of tumor-derived DNA in cfDNA [18,19]. In addition, as ctDNA is derived from the entire tumor, subclones with relatively low VAFs can also be detected. Consistent with this, only one alteration with a VAF of less than 5% detected by the automatic pipeline in each of the three samples (Table 6), and manual review of BAM files confirmed very low VAFs (0.23%-1.1%) for EGFR mutations detected only in the ULV1 panel. These results suggest that differences in detection sensitivity between cfDNA-targeted sequencing and the ULV1 panel may have resulted in the detection of subclonal mutations.
In this study, we used semi-quantitative analysis of the ULV1 panel results to estimate the ctDNA fraction containing EGFR hotspot mutations, including three false-negative mutations (L858R, n=2; T790M, n=1) in cfDNA targeted NGS. Linear regression analyses were performed to estimate the fraction, with the R2 value indicating the suitability of each assay for this analysis. The L858R assay was found to have a relatively low R2 value compared with that of the T790M assay. The enriched VAFs of EGFR mutations detected in AMC044 (L858R) and AMC070 (T790M) using the ULV1 panel were within the dynamic range of semi-quantification using linear regression, yielding 0.08% and 0.2% of the input VAF, respectively. By contrast, the enriched VAF of the AMC036 (L858R) sample was found to be above the maximum value of the dynamic range, confirming that only the input VAF was over 1%. The EGFR C797S, EGFR L858R, and BRAF V600E assays had relatively low R2 values. Over 60% of the enriched VAFs were created in 0.1% positive samples due to the high amplification efficiency. The absence of a gradual correlation between the initial VAF and enriched VAF may have been the reason for the poor R2 value. Although ULV1 is a qualitative and semi-quantitative method, it may be more suitable as a qualitative method in some assays with a high amplification efficiency.
Furthermore, we assessed the potential of refining the semi-quantitative approach by investigating various regression analysis models. S4 Table provides insights into our exploration of equations derived from various regression models to enhance the precision of expected VAF estimates. Remarkably, the 4PL regression model consistently exhibited the highest R2 values across all 14 assays, suggesting that equations generated through this approach better align with our goal of accurate estimation. Nonetheless, it’s important to acknowledge that certain assays exhibited relatively high SD in the enriched VAF obtained from five repeated measurements. In such cases, the conventional recommendation favors employing linear regression analysis over the 4PL model. Thus, for the semi-quantitative approach depicted in Fig. 3A of our study, we opted to employ equations derived from linear regression analysis, given their well-established applicability.
In addition, we evaluated the performance of ULV1 via direct comparison using commercial kits. PANAMutyper is a technology that combines PANAClamp and PANARealTyper, which induces mutant-specific amplification while suppressing wild-type DNA amplification of the target region. Therefore, a positive result from PANAMutyper could be easily determined using the threshold and melting temperature range for each assay, while a negative result was indirectly determined. However, ULV1 selectively amplifies mutant-type DNA from excess wild-type DNA, which could be more conducive to determining sample genotypes. As a result of the direct comparison between positive samples using these two methods, we found that the detection rate was higher in samples with low mutant fractions in ULV1. This suggests that ULV1 can be used to screen multiple EGFR mutations.
Limitations of this study include its single-institution design, which may affect the generalizability of the findings to other settings. In addition, the ULV1 panel used did not include targetable mutations such as KRAS G12C or MET exon14 skipping mutations that are clinically important in NSCLC. Future research should develop an updated version of the UHS panel that includes these mutations to enable a more comprehensive analysis of their clinical utility. Multi-institutional clinical trials involving larger patient populations are also necessary to validate the clinical significance of the updated ULV1 panel system in diverse clinical settings. Onco-UHS is a simple, highly sensitive, and cost-effective multiplex profiling method for detecting driver mutations in various carcinomas. In particular, the ULV1 panel may be useful for the identification of somatic alterations in plasma samples from patients with NSCLC, enabling the monitoring of the responsiveness of patients treated with EGFR-TKI, as well as the validation of NGS.
Electronic Supplementary Material
Supplementary materials are available at Cancer Research and Treatment website (https://www.e-crt.org).
Notes
Ethical Statement
All procedures performed in studies involving human participants were approved by the Ethics Committee at the Asan Medical Center (approval no. 2016-0692) and the 1964 Helsinki declaration and its later amendments or comparable ethical standards. As this study was retrospective, the Institutional Review Board waived the requirement for informed consent based on the study design.
Author Contributions
Conceived and designed the analysis: Sung CO, Jang SJ, Choi CM, Chun SM.
Collected the data: Choi CM, Chun SM.
Contributed data or analysis tools: Lee JY, Jun HR, Chun SM.
Performed the analysis: Lee JY, Jeon S, Chun SM.
Wrote the paper: Lee JY, Chun SM.
Conflicts of Interest
Conflict of interest relevant to this article was not reported.
Acknowledgements
This study was supported by the Korean government grants, NRF-2017M3A9G5061671, NRF-2017M3A9G5061673, and NRF2019R1F1A1061436, and the Asan Institute for Life Sciences at the Asan Medical Center in Seoul, Korea (2019IP0836).