Clinical Significance of Tyrosine Hydroxylase mRNA Transcripts in Peripheral Blood at Diagnosis in Patients with Neuroblastoma
Article information
Abstract
Purpose
The purpose of this study is to investigate the clinical significance of tyrosine hydroxylase (TH) expression in peripheral blood (PB) at diagnosis in patients with neuroblastoma.
Materials and Methods
TH mRNA expression in PB was measured by reverse transcription quantitative real-time polymerase chain reaction in 210 patients who were newly diagnosed with neuroblastoma from July 2005 to June 2015 and the clinical significance of TH expression in PB at diagnosis was evaluated.
Results
TH expression was positive in 60 patients (28.6%). Fifty of 60 TH-positive patients had metastatic tumors and the remaining 10 had localized tumors. TH expression was associated with high-risk features (i.e., advanced stage, older age, unfavorable pathology, and MYCN amplification) at diagnosis. Among TH-positive patients, higher TH expression level was observed in high-risk patients than in low- or intermediate-risk patients (p=0.035). The probability of 5-year progression-free survival (PFS) was lower in TH-positive patients than in TH-negative patients (63.8±6.9% vs. 94.7±2.1%, p < 0.001). In analysis confined to high-risk patients, the 5-year probability of PFS remained lower in TH-positive patients (55.7±8.2% vs. 89.6±5.8%, p < 0.001). Among TH-positive patients, a higher expression level of TH was associated with a worse outcome. In multivariate analyses, positive TH expression in PB at diagnosis was an independent poor prognostic factor for PFS.
Conclusion
The treatment intensity should be tailored according to TH expression in PB at diagnosis.
Introduction
Neuroblastoma (NB) is a common childhood solid tumor that presents with clinical heterogeneity. The presentation of NB can range from localized tumors to disseminated forms, which have different prognoses and require different treatment [1,2]. Therefore, determining the disease extent and stage at the time of diagnosis is important. A number of genetic and biological markers have been investigated for detection of minimal levels of NB cells [3]. Tyrosine hydroxylase (TH), which is mainly expressed in sympathetic nervous tissues [4], has been suggested as a candidate marker for detecting minimal levels of neuroblastoma cells in bone marrow (BM) and peripheral blood (PB) [5]. Molecular detection of TH mRNA using reverse transcription quantitative real-time polymerase chain reaction (RT-qPCR) has been proposed as a specific and sensitive method for detection of minimal disease in NB [5-8].
According to our preliminary reports, positive TH expression in PB at diagnosis is a poor prognostic factor [9]. However, the number of patients was small and the follow-up duration was short. In the current study, we evaluated the significance of TH expression in a larger cohort of patients with a longer follow-up period as well as the clinical implications of the level of TH expression among TH-positive patients.
Materials and Methods
Written informed consent for TH analysis was obtained at diagnosis from all patients or guardians. This retrospective study was approved by the Institutional Review Board (IRB) of Samsung Medical Center and the requirement for informed consent was waived (IRB 2014-12-090).
1. Patients
Medical records of all patients who were newly diagnosed with NB over a 10-year period from July 2005 to June 2015 were reviewed retrospectively. Patients were staged according to the International Neuroblastoma Staging System [10] and disease extent was evaluated using computerized tomography (CT), magnetic resonance imaging (MRI), technetium-99 bone scans, bilateral BM aspirates and biopsy specimens, and 131I- or 123I-metaiodobenzylguanidine (MIBG) scanning. Measurement of TH expression in PB was included in routine evaluation at diagnosis. MYCN amplification was determined using competitive polymerase chain reaction (PCR), RT-qPCR, or fluorescence in situ hybridization. Tumors were classified as histologically favorable or unfavorable according to the International Neuroblastoma Pathology Classification [11]. Measurement of serum lactic dehydrogenase (LDH), ferritin, neuron-specific enolase (NSE), and urine vanillylmandelic acid (VMA) was also included in routine evaluation at diagnosis. Patients were stratified into low-risk, intermediate-risk, and high-risk groups based on age, stage, and MYCN status. Stage 1, 2, and 4S tumors without MYCN amplification were stratified as low-risk tumors whereas stage 4 tumors in patients older than 12 months or any tumors with amplified MYCN were stratified as high-risk tumors. All other tumors were stratified as intermediate-risk.
2. Treatment
Excisional biopsy of the primary tumor was performed at diagnosis for resectable tumors. Otherwise, incisional or percutaneous needle biopsy was performed with definitive surgery after six chemotherapy cycles. Alternating CEDC (cisplatin+etoposide+doxorubicin+cyclophosphamide) and ICE (ifosfamide+carboplatin+etoposide) regimens were used for chemotherapy (Table 1). Patients with low-risk localized tumors underwent surgery with (stage 2) or without (stage 1) six cycles of preoperative or postoperative chemotherapy. Patients with low-risk stage 4S tumors were treated only when there were life-threatening symptoms or the tumor progressed during observation. Patients with intermediaterisk tumors received six cycles of preoperative chemotherapy, surgery, three cycles of postoperative chemotherapy, and 12 cycles of 13-cis-retinoic acid (125 mg/m2/day for 14 days every 4 weeks). Local radiotherapy to the primary site was administered if gross residual tumor remained after surgery. Patients with high-risk tumors received tandem high-dose chemotherapy and autologous stem cell transplantation (HDCT/auto-SCT) after induction treatment (six cycles of preoperative chemotherapy, surgery, and three cycles of postoperative chemotherapy). The CEC (carboplatin+ etoposide+cyclophosphamide) regimen was used for the first HDCT. The second HDCT regimen was TM-TBI (thiotepa+melphalan+total body irradiation) for patients diagnosed up to December 2008. For patients diagnosed from January 2009 onwards, TBI was replaced with high-dose 131I-MIBG (12 or 18 mCi/kg) to reduce late adverse effects. Local radiotherapy was applied to the primary site in all high-risk patients approximately 6 weeks after the second HDCT/auto-SCT. Differentiation therapy involving 13-cis-retinoic acid with immunotherapy using interleukin 2 (2×10⁶ U/m2/day for 5 days every 4 weeks) was administered until 1 year after HDCT/auto-SCT to reduce relapse from minimal residual tumor cells [12].
3. RT-qPCR for TH expression analysis
PB samples were collected at diagnosis in ethylenediaminetetraacetic acid tubes and mononuclear cells were separated and lysed in TRIzol reagent (Invitrogen Corporation, Carlsbad, CA). RNA was extracted according to the manufacturer’s instructions and 1 μg of RNA was used to generate 20 μL of complementary DNA using an RNA PCR kit (Applied Biosystems, Foster City, CA). RT-qPCR was performed using Real-Q TH Quantification Kits (BioSewoom, Seoul, Korea) on a LightCycler (Roche Diagnostics, Mannheim, Germany). RT-qPCR was performed under the following cycling conditions: denaturation at 95°C for 10 minutes, 45 cycles at 95°C for 10 seconds, 60°C for 10 seconds, and 72°C for 30 seconds, followed by a cooling step at 40°C for 30 seconds. Reactions were performed in a 20-μL volume containing PCR reaction mixture, TaqMan probe (5'-FAM AGCGCAGGAAGCTGATTGCTGAGTAMRA-3'), primer mixture (forward, 5'-TCATCACCTGGTCACCAAGTT-3'; reverse, 5'-GGTCGCCGTGCCTGTACT-3'), 2 μL cDNA, and sterile water. The ABL gene was used as a control gene in RT-qPCR. If the expression value of ABL in the RT-qPCR amplification was less than a copy number of 104, the sample was considered inadequate for RT-qPCR analysis and the RNA extraction was repeated. The quantity of TH transcripts was normalized to the ABL transcript level, and the result was expressed as the ratio of the TH to ABL transcript copy number.
4. Statistics
Pearson’s chi-squared test was used for comparison of frequencies between groups. The Mann-Whitney U test was used for comparison of continuous variables between groups. Progression-free survival (PFS) and overall survival (OS) rates with standard errors were estimated using the Kaplan-Meier method. Relapse was regarded as progression in the statistical analysis. Differences in PFS rates between groups were compared using the log-rank test. Multivariate analyses of prognostic factors for PFS and OS were performed using Cox regression analysis. p-values less than 0.05 were considered significant.
Results
1. Patient characteristics
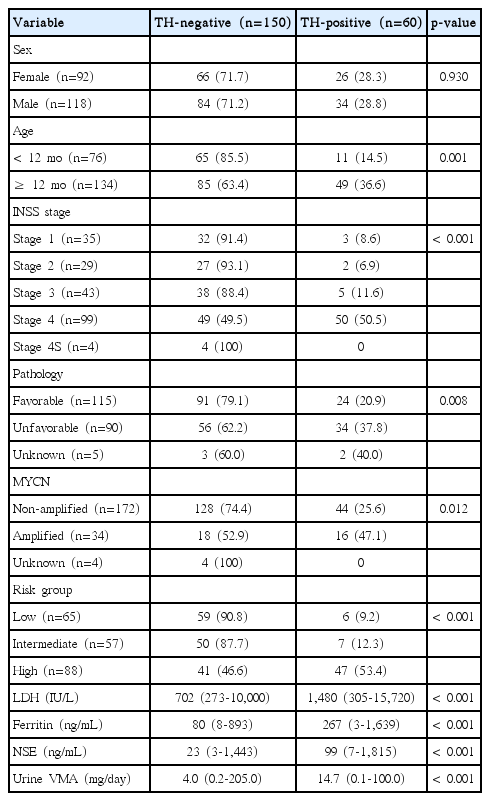
A total of 210 patients (118 boys and 92 girls) were evaluated for the presence of TH mRNA in PB at diagnosis. The clinical and biological characteristics of patients are shown in Table 2. The median age at diagnosis was 22 months (range, 0 to 232 months) and median follow-up duration was 51 months (range, 1 to 122 months). At diagnosis, 134 patients were older than 12 months, 103 patients had metastatic tumors including four stage 4S tumors, 90 had histologically unfavorable tumors, and 34 had MYCN amplified tumors. Among 89 patients with high-risk tumors, 30 patients used TM-TBI regimen in the second HDCT/auto-SCT and the remaining 59 patients used 131I-MIBG-TM regimen.
2. RT-qPCR analysis of TH expression in PB
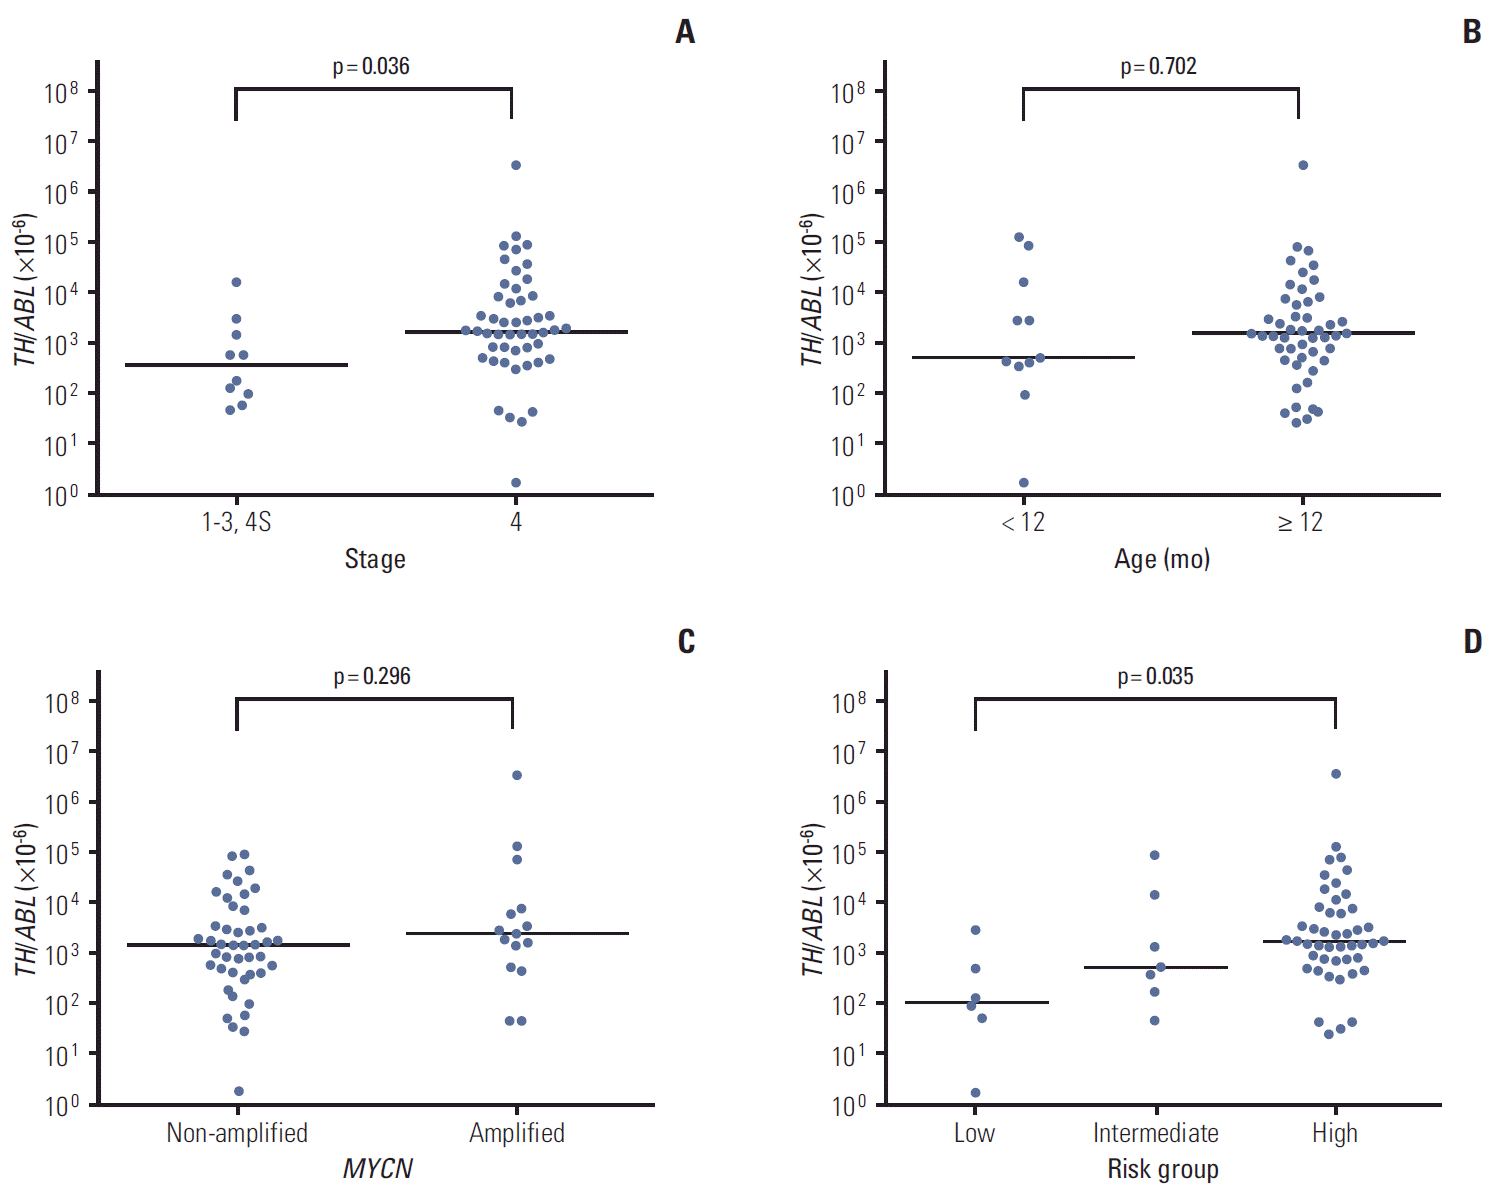
TH expression was positive in PB at diagnosis in 60 of 210 patients (28.6%). The median expression level (TH/ABL ratio) of TH mRNA transcript detected in PB was 1,580×10-6 (range, 2×10⁻⁶ to 3,711,864×10-6). Positive TH expression was associated with high-risk features (i.e., advanced stage, older age, unfavorable pathology, and MYCN amplification). The levels of serum LDH, ferritin, NSE, and urine VMA were also higher in TH-positive patients (Table 2). Among 60 TH-positive patients, 50 had metastatic tumors and the remaining 10 had localized tumors (stage 1 in three, stage 2 in two, and stage 3 in five patients). Among the TH-positive patients, a higher TH expression level was associated with advanced stage and high-risk tumor, but not with older age (≥ 12 months) or MYCN amplification (Fig. 1A-D).

Association between tyrosine hydroxylase (TH) expression level and clinicopathologic features. (A-C) Among 60 TH-positive patients, a higher level (TH/ABL ratio) of TH mRNA transcript was associated with advanced stage (A), but not older age (≥ 12 months) (B) or MYCN amplification (C). (D) TH expression level was higher in high-risk patients than in low- or intermediate-risk patients (p=0.035).
3. Survival according to TH expression at diagnosis
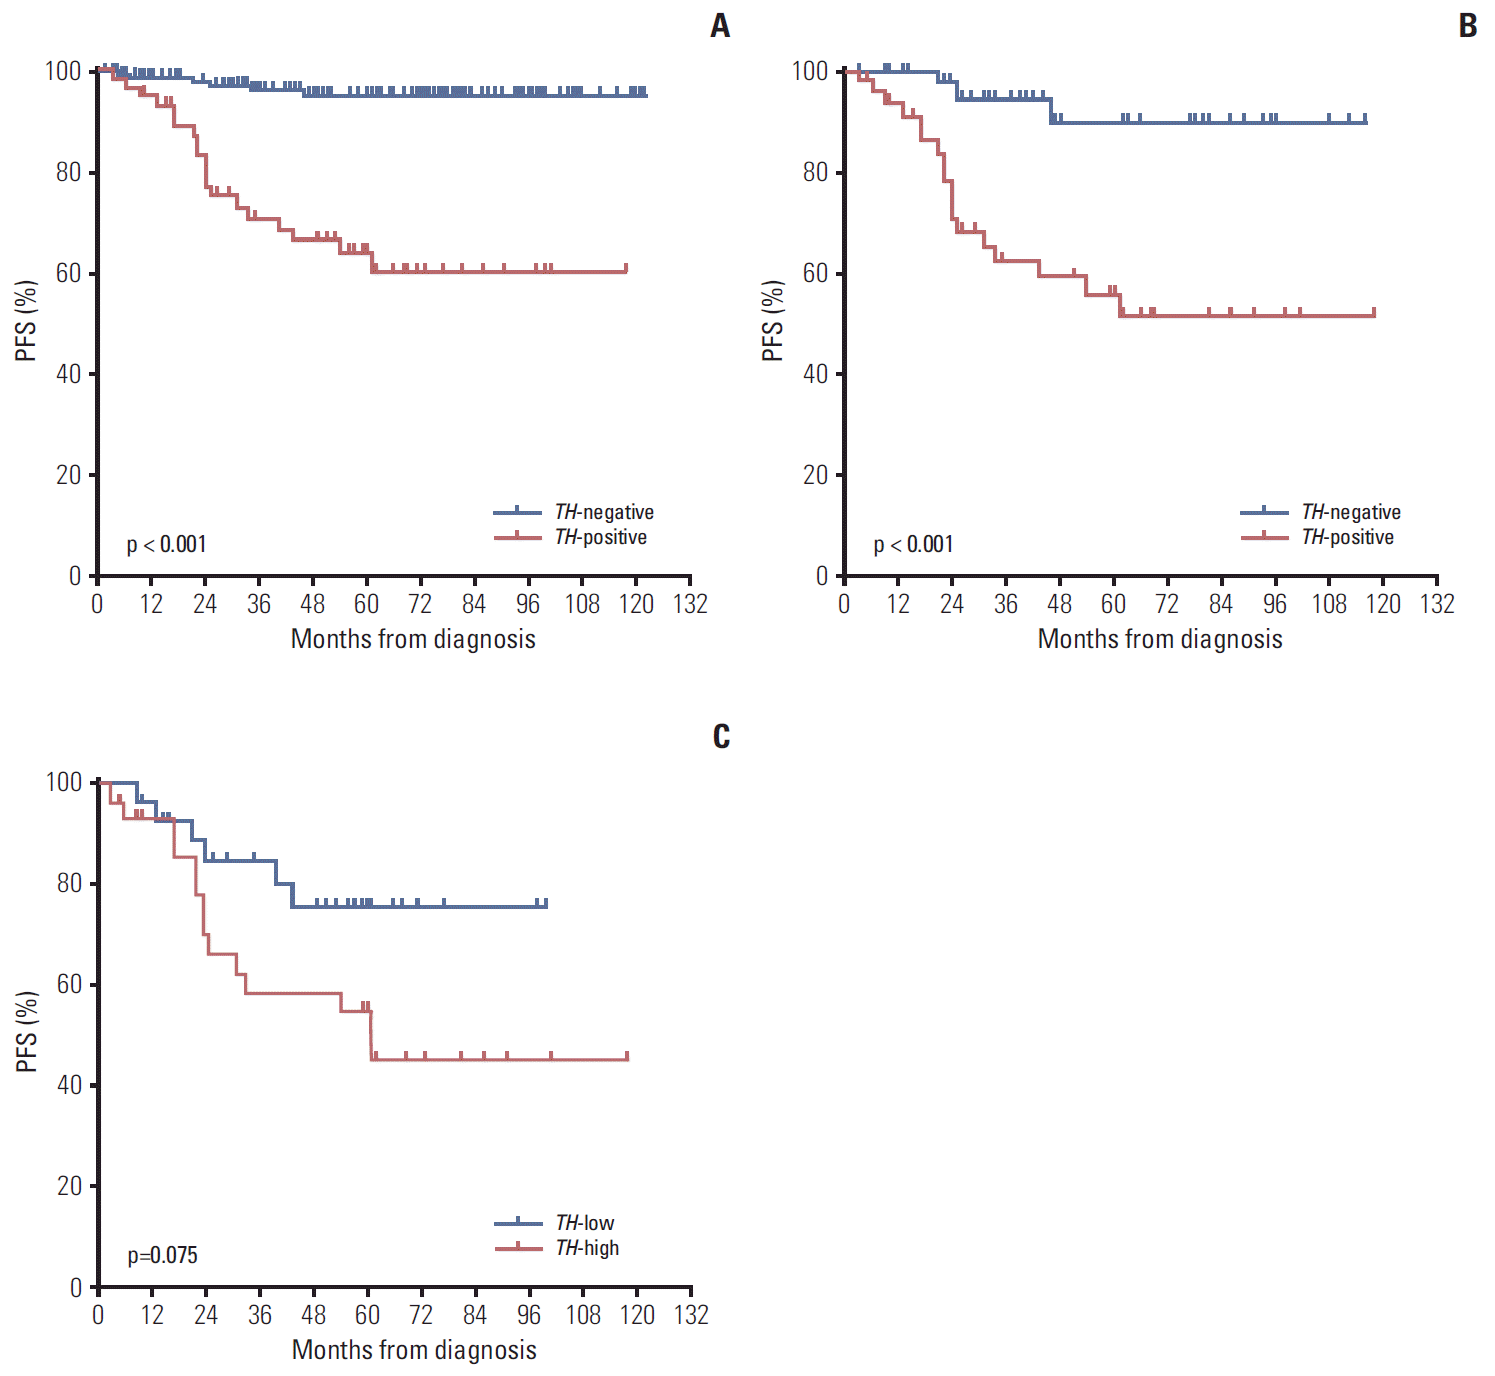
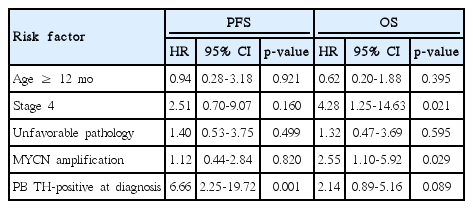
Relapse or progression occurred in 19 of 60 TH-positive patients (31.7%), compared with only six of 150 TH-negative patients (4.0%). Lower 5-year probabilities of PFS and OS were observed in TH-positive patients than in TH-negative patients (PFS: 63.8±6.9% vs. 94.7±2.1%, p < 0.001; OS: 70.2± 6.7% vs. 92.4±2.5%, p < 0.001) (Fig. 2A). In analysis confined to only high-risk patients, the 5-year probabilities of PFS and OS remained lower in TH-positive patients (PFS: 55.7±8.2% vs. 89.6±5.8%, p=0.001; OS: 61.4±8.1% vs. 87.2±6.1%, p=0.064) (Fig. 2B). However, in low- and intermediate-risk patients, no difference in the 5-year probabilities of PFS and OS was observed between TH-positive patients and TH-negative patients (PFS: 96.8±1.9% vs. 90.0±8.7%, p=0.447; OS: 100% vs. 94.5±2.5%, p=0.725). Among high-risk patients, there was no difference in the 5-year probabilities of PFS and OS according to the HDCT regimen (TM-TBI vs. 131I-MIBG-TM) (PFS: 63.3±8.8% vs. 78.7±6.6%, p=0.184; OS: 70.0±8.4% vs. 76.7± 6.4%, p=0.745). In analysis confined to only TH-positive high-risk patients, there was also no difference in survival rates according to the HDCT regimen (PFS: 50.0±12.5% vs. 61.2± 10.5%, p=0.523; OS: 56.3±12.4% vs. 67.0±9.3%, p=0.923). One of 10 TH-positive patients with localized tumors experienced relapse. The results of multivariate analysis for PFS and OS are shown in Table 3. Positive TH expression in PB at diagnosis was an independent factor for PFS (hazard ratio, 6.35; 95% confidence interval, 2.10 to 19.25; p=0.001). The results were similar when the analysis was confined to high-risk patients (hazard ratio, 9.02; 95% confidence interval, 2.06 to 39.50; p=0.004) (Table 4). Among TH-positive patients, a higher expression level of TH was associated with a worse outcome (above median level vs. below median level: 52.9± 10.0% vs. 75.7±8.8%, p=0.075 for 5-year PFS; 55.9±9.6% vs. 89.2±5.9%, p=0.047 for 5-year OS) (Fig. 2C).

Survival rates according to tyrosine hydroxylase (TH) expression in peripheral blood at diagnosis. (A) The 5-year progression-free survival (PFS) was lower in TH-positive than in TH-negative patients (63.8±6.9% vs. 94.7±2.1%, p < 0.001). (B) In analysis confined to high-risk patients, the probability of 5-year PFS was lower in TH-positive than in TH-negative patients (55.7±8.2% vs. 89.6±5.8%, p=0.001). (C) Among TH-positive patients, a higher expression level of TH was associated with a worse outcome (above median level vs. below median level: 5-year PFS, 52.9±10.0% vs. 75.7±8.8%, p=0.075).
Discussion
A number of genetic markers have been investigated for detection of minimal levels of NB cells [13-17]. Viprey et al. [18] reported that the TH, DCX, and PHOX2B genes are the best candidates for detection of circulating NB cells. Corrias et al. [19], who investigated the advantages of measuring multiple molecular targets over a single molecular target, reported that combinations of multiple targets did not add to the predictive power of TH analysis alone. Gilbert et al. [20] also reported that TH might be the one of the most useful molecular targets. In this context, in the current study we measured TH mRNA alone for molecular detection of minimal disease in all patients who were newly diagnosed with NB.
Positive TH expression in PB at diagnosis was associated with high-risk features and worse outcome. More importantly, positive TH expression in PB at diagnosis was an independent poor prognostic factor for PFS. The results were similar when the analysis was confined to high-risk patients. Current staging systems use conventional diagnostic modalities such as CT, MRI, BM biopsy, and various radioisotope scans. Patients are stratified into risk groups based on these staging systems and patients within each risk group are treated uniformly. However, our study showed that outcomes within the high-risk group differ according to TH expression in PB at diagnosis. Previous studies also reported that positive TH expression was a poor prognostic indicator in metastatic NB [13,21,22]. These findings suggest that TH expression at diagnosis might be a significant factor in future methods of risk stratification for NB. Some studies examined the clinical implication of positive TH expression in non-metastatic NB [19,23]. Yanez et al. [23] reported an association of positive TH expression in PB at diagnosis with a higher probability of relapse in patients with non-metastatic NB. These findings suggest that some patients with localized tumors (by conventional diagnostic modalities) might have disseminated micrometastatic disease and therefore might benefit from upstaging and more aggressive treatment [24]. However, in the current study, because only one of 10 TH-positive patients with localized tumor experienced relapse, the significance of TH expression in patients with localized tumors was unclear. Further studies including more patients are needed to evaluate the prognostic importance of TH expression in the PB of patients with localized tumors.
Among TH-positive patients, higher TH expression was associated with advanced stage and high-risk tumor, but not with older age or MYCN amplification, and a higher TH expression level at diagnosis was associated with a worse outcome. Yanez et al. [25] reported that a high level of TH mRNA in PB was a significant independent predictor of event-free survival and OS when detected at diagnosis, post-induction therapy, and at the end of treatment. They proposed inclusion of TH mRNA monitoring throughout the disease course by RT-qPCR as a standard method of disease evaluation that would be helpful in predicting differences in outcome and identify children for whom current treatment is failing or insufficient [25]. The European HR-NBL1/SIOPEN study defined patients with very high TH expression as ultrahigh-risk. These ultrahigh-risk patients showed very poor outcome among the group of high-risk NB patients (PFS, 0%), most of whom underwent single HDCT/auto-SCT following short induction treatment. The authors suggested that patients with very high TH expression are candidates for alternative treatment strategies [22]. In the current study, the prognosis of patients with high TH expression was also poorer than for those with low TH expression, but was not dismal. The relatively better outcome in our patients with high TH expression compared to those in the European HR-NBL1/SIOPEN study might be attributable to the longer induction treatment and more intensive consolidation treatment using tandem HDCT/auto-SCT.
Conclusion
In conclusion, positive TH expression in PB at diagnosis of neuroblastoma is associated with high-risk features and is an independent prognostic factor for poor PFS. Results of the current study suggest that treatment intensity should be tailored according to TH expression in PB at diagnosis.
Notes
Conflict of interest relevant to this article was not reported.
Acknowledgements
This study was supported by a grant from the Korean Health Technology R&D Project, Ministry of Health & Welfare, Republic of Korea (No. HI13C1521).


