Recent Trends of Medical Expenses Associated with Radiation Therapy in Korea Based on HIRA Big Data
Article information

Abstract
Purpose
We aimed to determine the trends in the use of radiotherapy (RT) and the expenses associated with it in South Korea.
Materials and Methods
The statistical data of the claims and reimbursement records provided on the Health and Insurance Review and Assessment Service website were utilized. This included information such as the number of patients, fractions, medical expenses according to treatment codes, in/outpatient, sex, age, and regions of hospitals. We analyzed data from 2016 to 2020.
Results
With a growing RT infrastructure and an increase in the number of radiation oncologists, the expenses for RT were 605.5 million USD in 2020, which had increased 1.5 times from 394.7 million USD in 2016. This growth was mainly because of the increased usage of advanced RT techniques. Furthermore, the proportion of intensity-modulated radiation therapy (IMRT) expenses in the total expenses increased by 1.6 times from 48.8% in 2016 to 76.9% in 2020. Advanced techniques were used more commonly in older individuals or children. However, the proportion of IMRT expenses increased mostly in young women. Additionally, geographical differences in RT use and expense were observed, although the gap in the IMRT fractions decreased among the regions.
Conclusion
Recent medical expenses associated with RT in Korea have increased in tandem with technological advances and changes in demographics.
Introduction
The incidence of cancers in South Korea continues to increase [1]. As an important tool for cancer treatment, radio-therapy (RT) has been widely used for curative and palliative purposes [2–4]. In Korea, 36.1% of all patients with cancer were treated with RT in 2019 [5]. Furthermore, recent technological advances in RT have been recognized after their successful use in the management of various types of cancers [6,7].
In 2007, growing manpower and infrastructure for RT were reported, although the size of the infrastructure compared to the size of the population was still insufficient [8]. Furthermore, another study about the geographical distribution of RT in Korea revealed a process of centralization toward the metropolitan areas, which is different from the situation in Japan [9]. In addition, it was reported that the use of intensity-modulated radiation therapy (IMRT) had increased 18 times in 2018 compared to that in 2011 [10]. Studies have reflected rapid changes in the clinical use of RT and suggested the need for analysis and assessment of the increased expenses associated with advanced RT techniques, especially IMRT, which is commonly used for the management of breast cancers.
We, therefore, analyzed the total expenses associated with RT based on open data resources regarding the patterns of RT use from the National Health Insurance Service (NHIS) of South Korea.
Materials and Methods
We used information on claims and reimbursements records from the Health and Insurance Review and Assessment Service (HIRA) Big data based on the NHIS, which provided pre-processed statistics, including the annual number of patients receiving RT, usages or fractions, and the amount of total medical expenses according to treatment codes for RT, sex, age, and the geographical regions of hospitals (http://opendata.hira.or.kr/op/opc/olapDiagBhvInfo.do). Total medical expenses include the amount paid by the insurer (NHIS) and patients. We analyzed the data from 2016 to 2020. Most data used in this study are available in the Excel file (S1 Datafile). The review exemption of this study using the publicly available information was approved by the Institutional Review Board (SMC 2022-06-067).
We used the treatment and planning codes related to RT to gather the data (S2 Table). The treatment codes were categorized as 2-dimensional radiotherapy (2D-RT), 3-dimensional conformal radiotherapy (3D-CRT), IMRT, proton beam therapy (PBT), techniques for hematologic malignancy including total body irradiation, total lymph node irradiation, total skin irradiation, and stereotactic radiosurgery (SRS; single fraction)/stereotactic body radiotherapy (SBRT; 2–4 fractions), which are the available RT types using linear accelerators (Linac), Tomotherapy (Tomo), Cyberknife, and PBT. Other machines using radioactive isotopes such as Gammaknife, brachytherapy, permanent implantation, and intra-operative RT were excluded. To calculate the total expenses for RT, we added the expenses for planning, which included simulation, as well as treatment. However, the planning codes (HD019 and HD419) for SRS/SBRT are shared with Linac, Cyberknife, and Gammaknife. Therefore, the expenses for planning were estimated excluding the number of patients associated with Gammaknife.
For international communication, the expenses in Korean Won were converted into U.S. dollars (USD) using the annual average exchange rate announced by the Bank of Korea (https://ecos.bok.or.kr). Additional information such as the number of hospitals performing RT, radiation oncologists, and RT machines was obtained through the Korean Society for Radiation Therapy (https://kosrt.krta.or.kr) and the Korean Statistical Information Service (https://kosis.kr). Further, general data, such as age distribution in the population and prevalence and incidence of cancer in Korea were obtained from the national statistics (http://kosis.kr).
To compare the present value of the annual total expense and the expense of IMRT, sensitivity analysis for the discount rates was performed. As of 2016, the discount rates of 0%, 3.0%, and 4.5% per year were used as per the guidelines for the Economic Evaluation of Pharmaceuticals in Korea (https://repository.hira.or.kr/handle/2019.oak/2541).
Results
1. Status of radiation oncologists and infrastructure for RT in Korea
As shown in Table 1, the updated number of centers operating the department of radiation oncology in 2020 was 97 in Korea. This was 1.6 times more than the 61 centers in 2006 [8]. The number of radiation oncologists was 280 in 2020, which was 2.1 times more than the 132 radiation oncologists in 2006 [8]. The average number of radiation oncologists per RT center was 2.9 (280/97) in 2020, as against 2.2 (132/61) in 2006. Recently, from 2016 to 2020, the number of radiation oncologists increased by 8.8 persons per year.
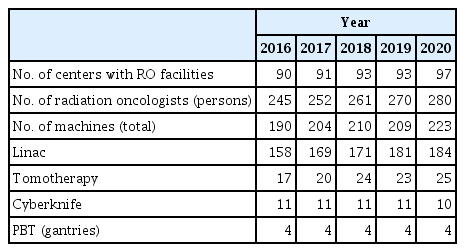
The annual number of centers operating the department of radiation oncology, the number of radiation oncologists, and the machines for radiotherapy
The number of machines using X-ray beams such as Linac, Tomo, and Cyberknife was 186 in 2016 and 219 in 2020 (Table 1), which showed an increase of about 2 times from 101 in 2006 [8]. As of 2020, the average number of X-ray machines per RT center was 2.3. Furthermore, the number of machines for PBT had not changed from 2 units to 4 gantries in the last 4 years.
2. Overview of claim data for RT
The annual numbers of patients and fractions and the total expenses for RT are shown in Fig. 1. While the number of patients has not changed much, the fractions in 2020 decreased by 8.1% from 2016. The total expenses, however, increased 1.5 times from 394.7 million USD in 2016 to 605.5 million USD in 2020. The total expenses for RT in 2020 were approximately 0.72% of the total national insurance claims, and this rate had increased slightly from 0.62% in 2016 (S1 Datafile). The expense per patient or per fraction also increased annually by 5%–22% (Fig. 1).
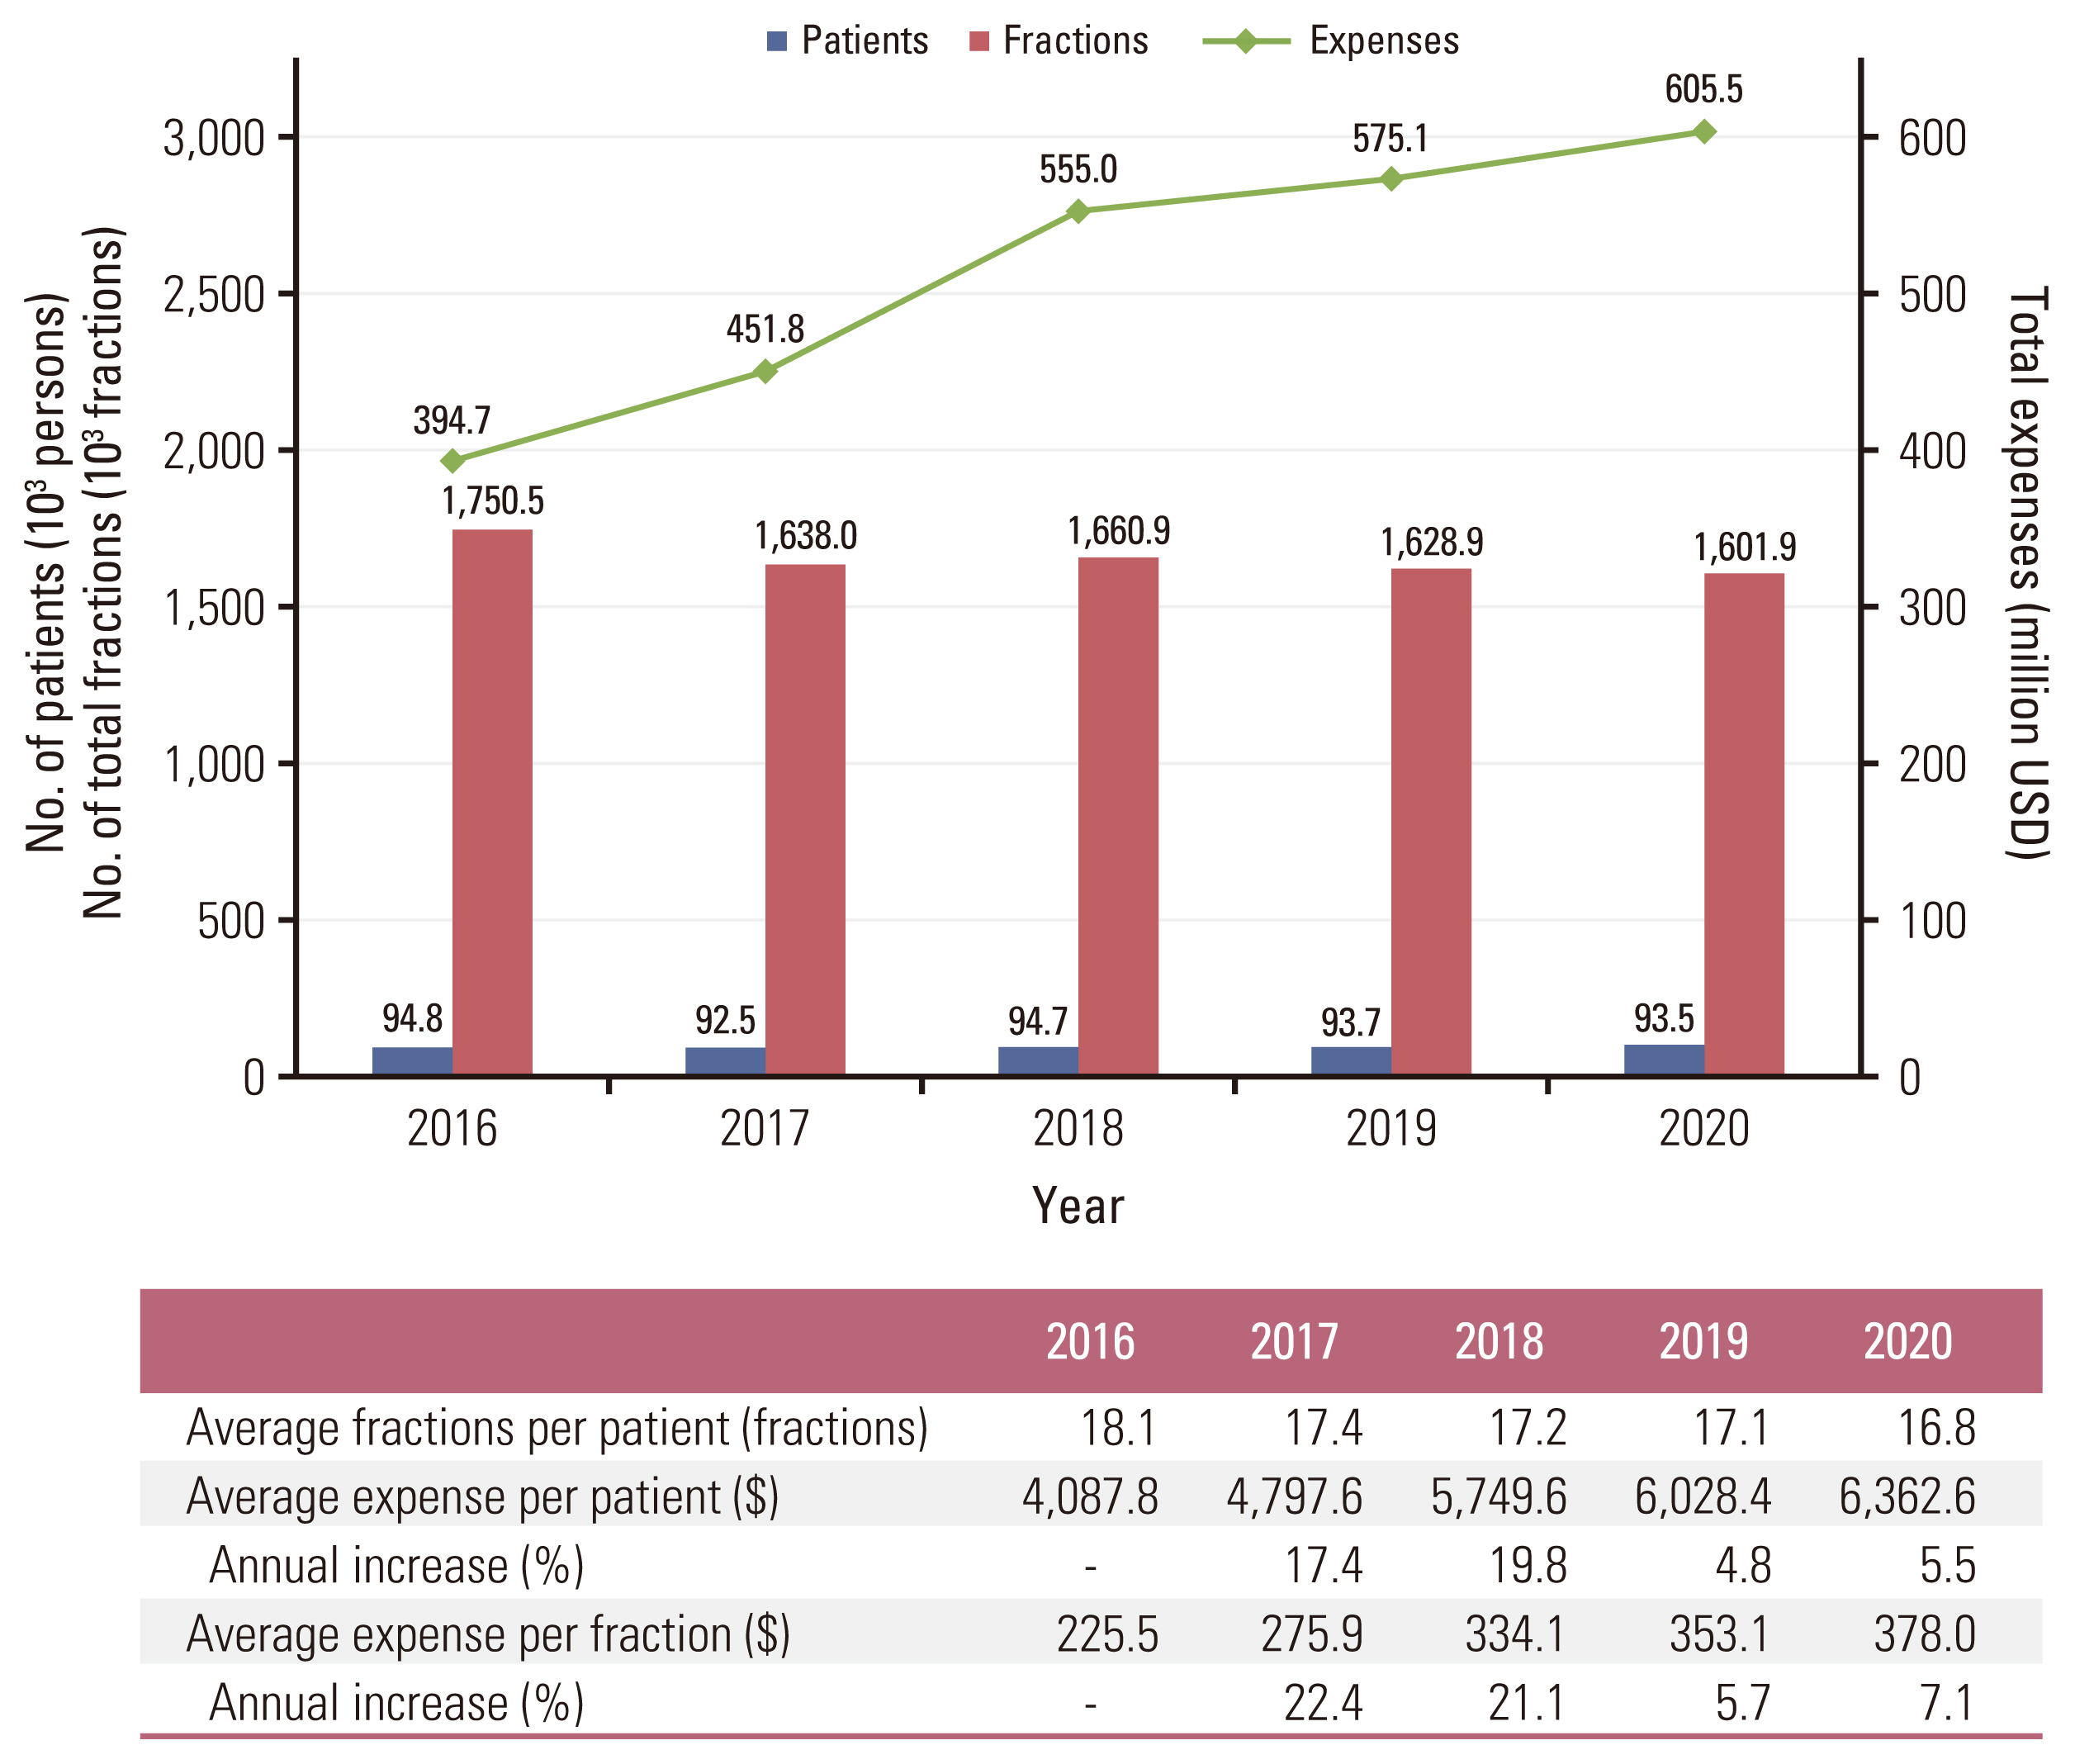
Trends of use of radiotherapy and its associated expenses in Korea.
3. Use and expenses according to RT techniques
The most prominent aspect in the trend of claim data according to RT techniques was concerning IMRT (Fig. 2). The ratio of IMRT in the annual number of fractions was 24.7% in 2016, increasing by 2.4 times to 60.4% in 2020. The expense ratio also increased by 1.6 times from 48.8% in 2006 to 76.9% in 2020. In addition, advanced techniques such as SRS/SBRT and PBT also increased slightly, although the overall proportions were small. Conversely, the uses of 2D-RT and 3D-CRT decreased gradually. Overall, the proportion of fractions for advanced techniques excluding 2D-RT and 3D-CRT increased from 26.2% to 62.9%, and expenses increased from 55.2% to 83.7% in 2016 and 2020, respectively.
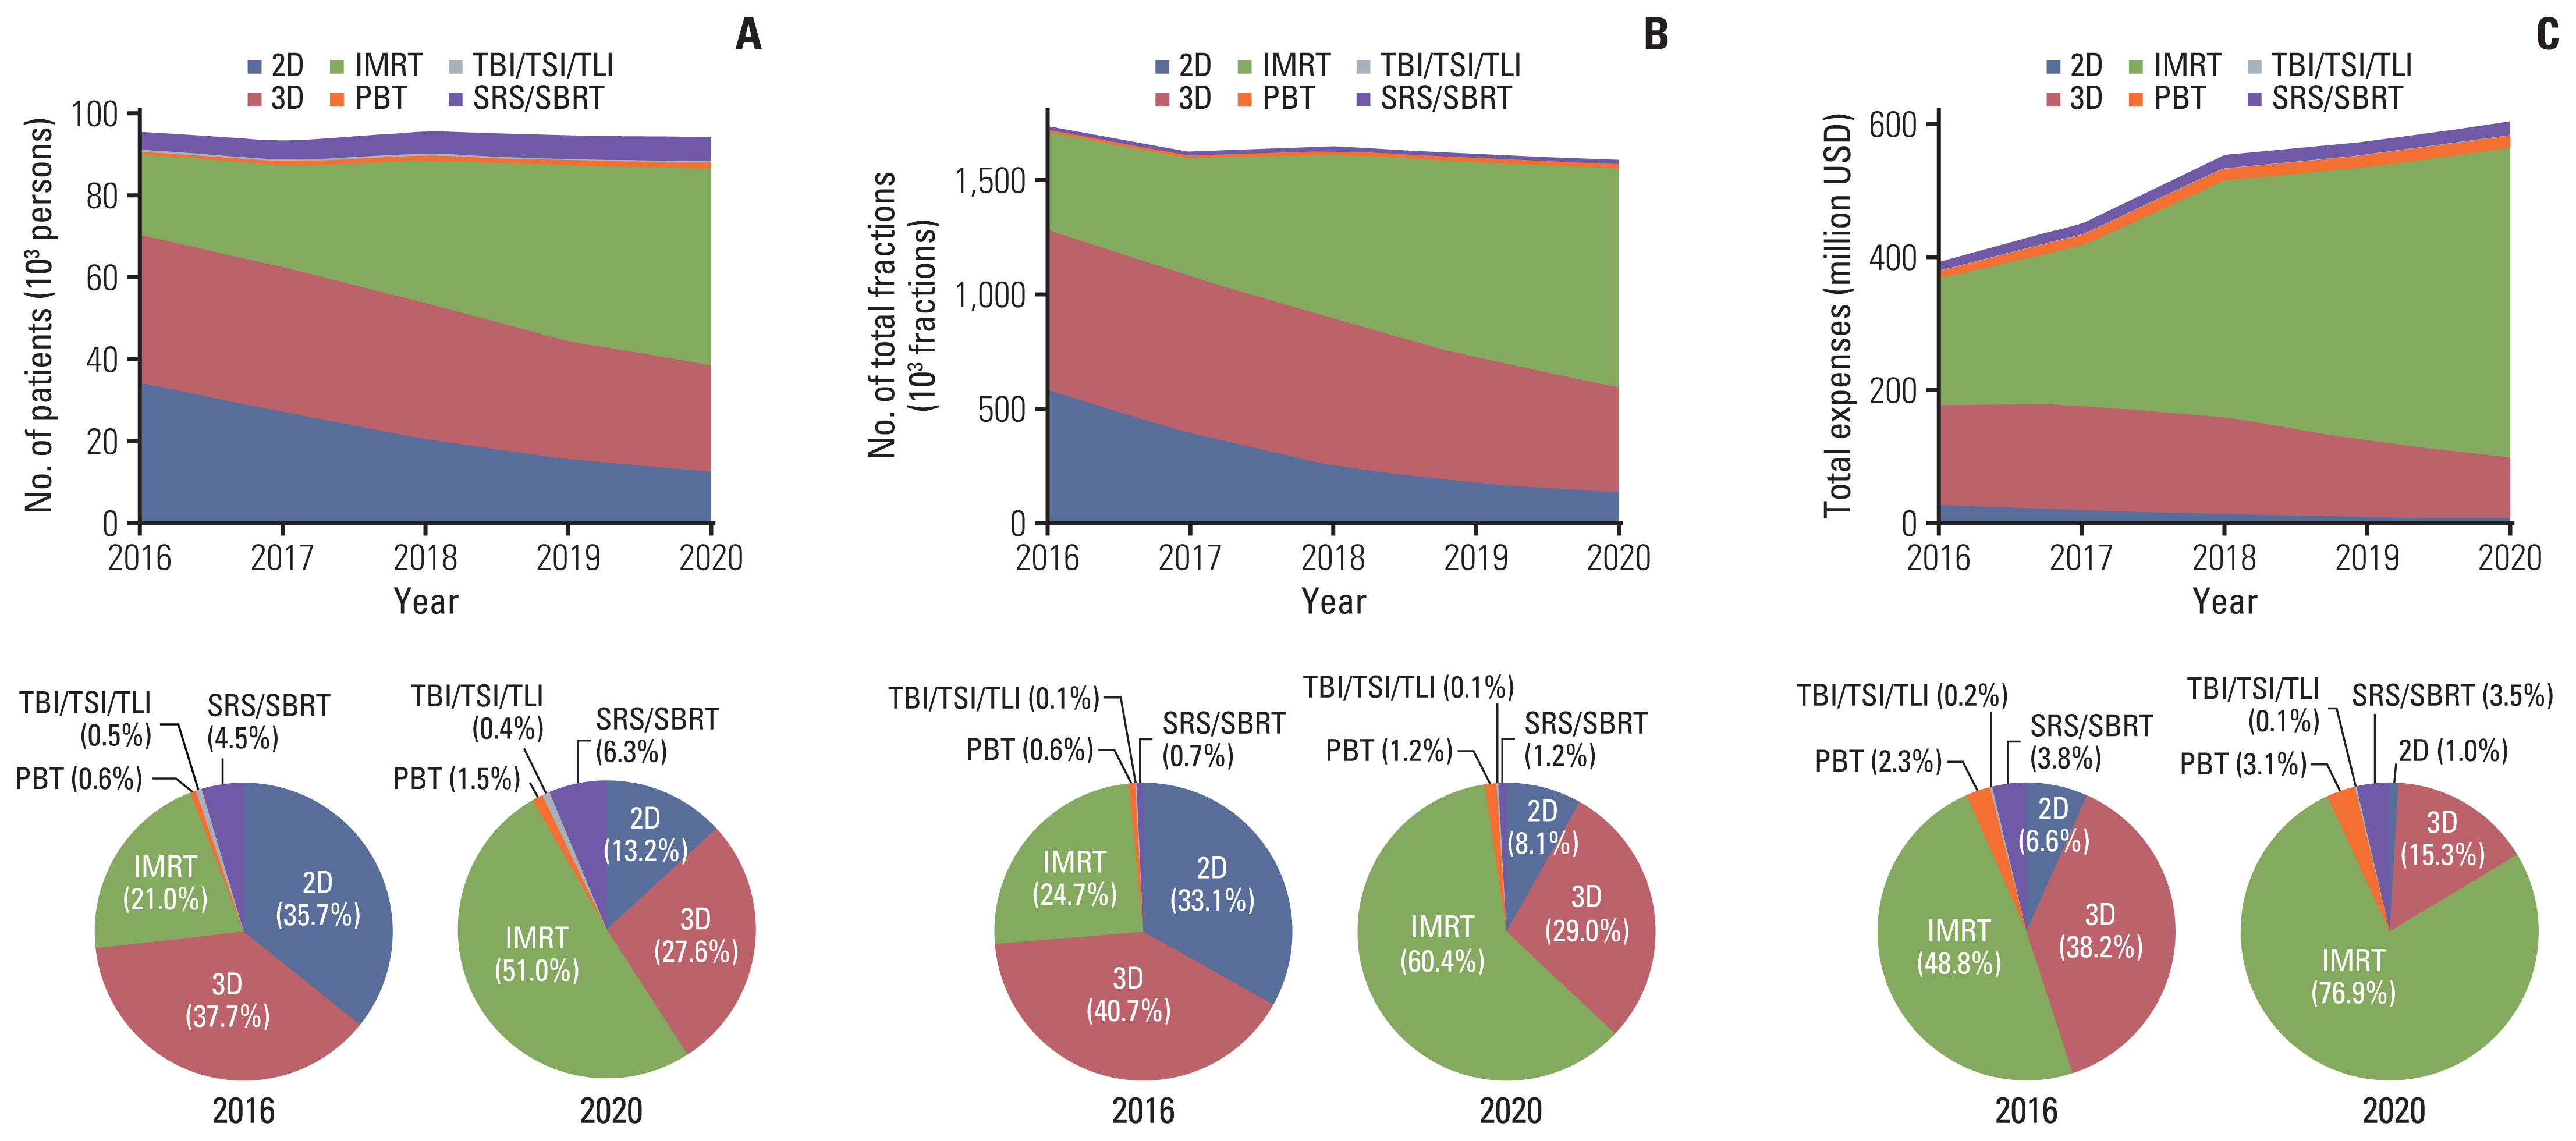
Number of patients (A), fractions (B), and expenses (C), according to radiotherapy techniques and the ratio of the techniques in 2016 and 2020. IMRT, intensity-modulated radiation therapy; PBT, proton beam therapy; SBRT, stereotactic body radiotherapy; SRS, stereotactic radiosurgery; TBI, total body irradiation; TLI, total lymph node irradiation; TSI, total skin irradiation.
4. Sensitivity analyses of the total and IMRT expenses
Fig. 3 shows the trends of the total and IMRT expenses with the discount rates of 0%, 3.0%, and 4.5% per year. Although the actual total expenses gradually increased, the total expenses with the discount rate of 4.5% per year changed little after 2018. However, contrary to the total expense, IMRT expenses continued to increase despite the discount rates.
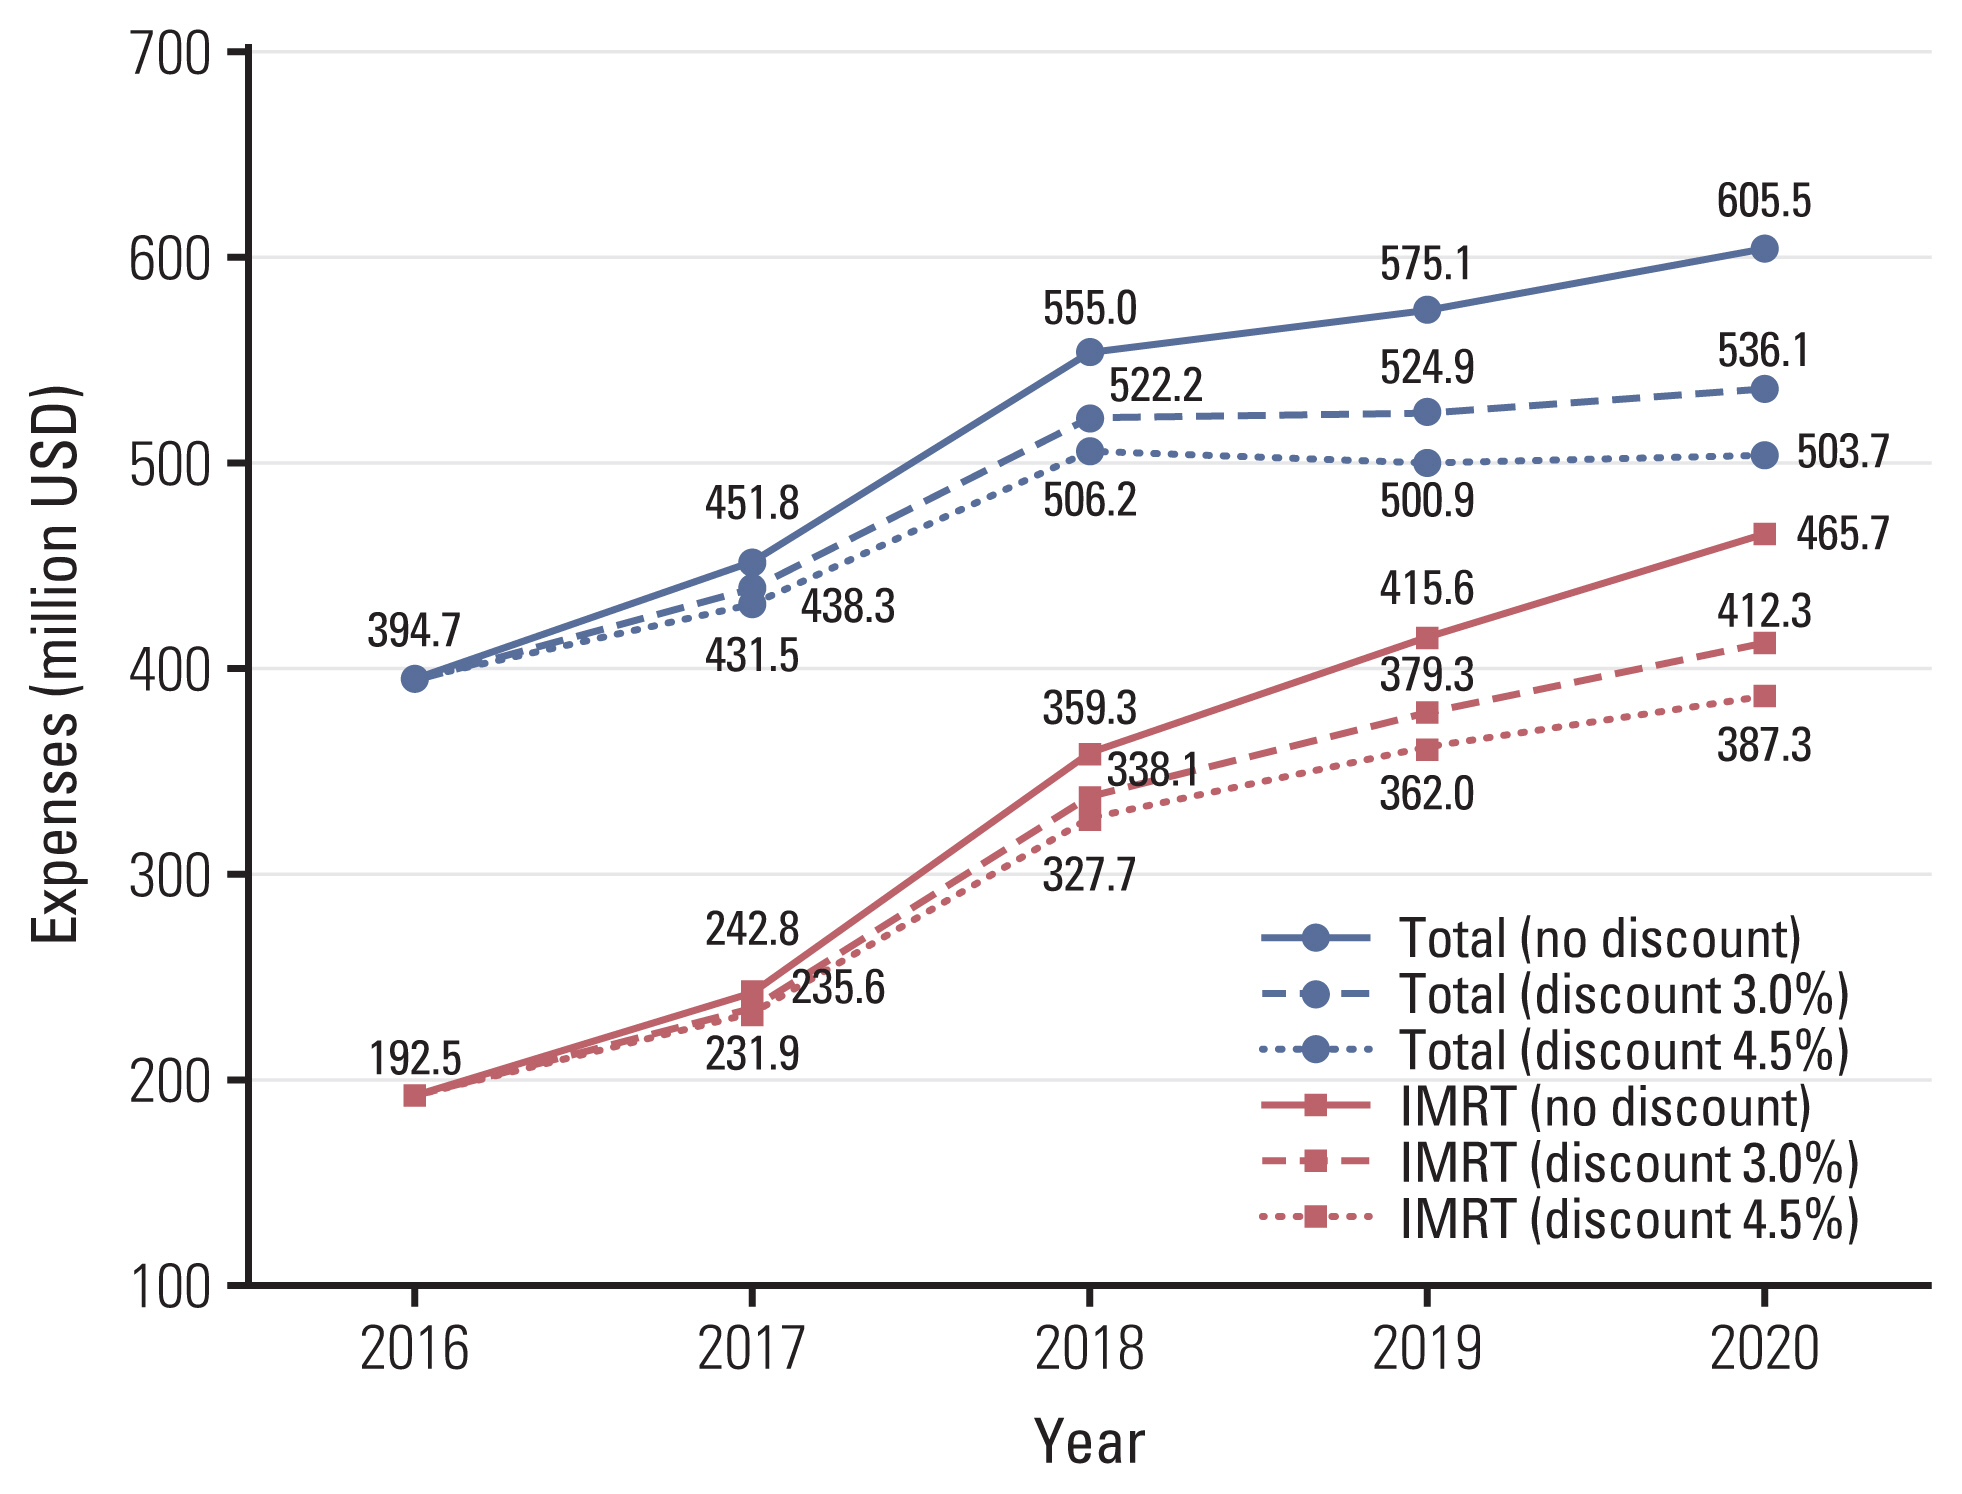
Sensitivity analyses of the total and intensity-modulated radiation therapy (IMRT) expenses with the discount rates of 0%, 3.0%, and 4.5% per year.
5. Aging society and older patients with cancer
Regarding the trend of age composition, the proportion of patients aged 60 years or older increased gradually, from 44.6% in 2016 to 53.5% in 2020 (Fig. 4A). Accordingly, the expenses for patients over 60 years of age increased from 50.0% in 2016 to 56.8% in 2020 (S1 Datafile). Of all groups, young patients under the age of 20 years and older patients were associated with the highest rate of use of advanced techniques, especially PBT in the young and IMRT in the elderly patients (S1 Datafile). The age composition by gender was similar every year, and the composition in 2020 is shown in Fig. 4B. The largest age groups were 60–70 years in male patients and 40–60 years in female patients.
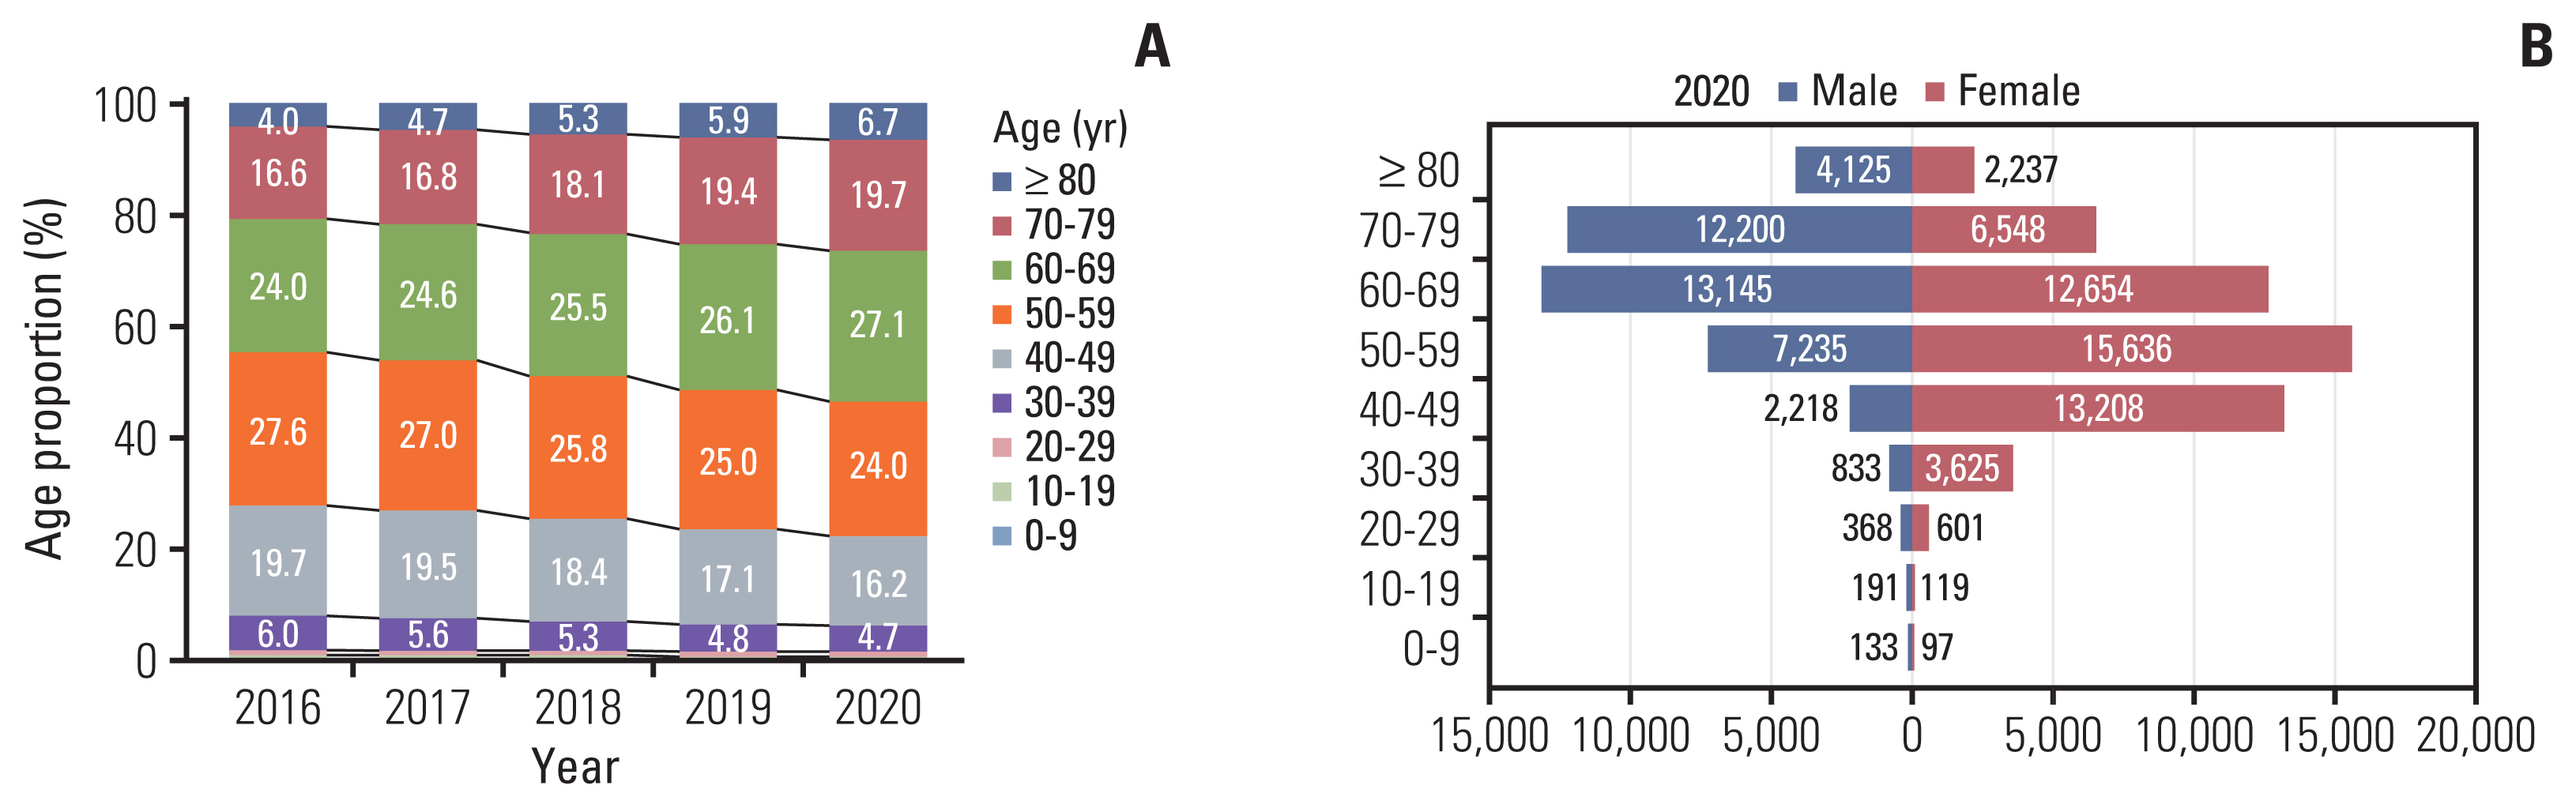
Trend of age composition from 2016 to 2020 (A) and age composition by sex in 2020 (B).
6. Geographical distribution
RT data exhibited a similar regional distribution by year, and the number of patients, fractions, and expenses in relation to the number of radiation oncologists are shown in Table 2. Per RT center, the average number of radiation oncologists was 2.0–2.8, except Seoul, which had 4.0. Expenses per radiation oncologist were 2.3 million USD in the metropolitan areas (2.5 in Seoul and 2.1 in non-Seoul) and 1.9 in the non-metropolitan areas (range, 1.4 to 2.1). According to the regions in Korea, the proportion of advanced techniques was 19.1%–29.4% in 2016; however, this increased to 58.5%–64.8% in 2020, with decreased regional differences (S1 Datafile). Of the advanced techniques, IMRT accounted for 25.5%–87.7% of the total number of fractions in 2020, from 5.6%–36.6% in 2016 (S1 Datafile).
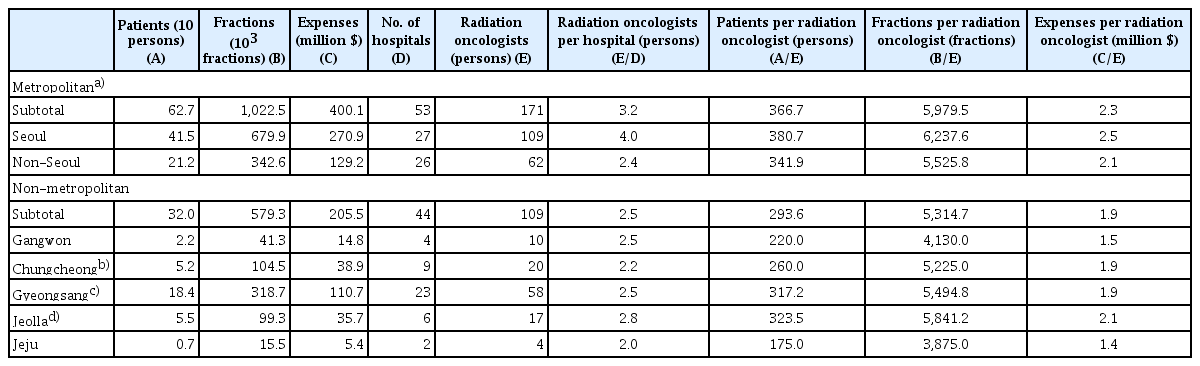
Geographical distribution of use and expenses for radiotherapy in 2020
Discussion
This is the first report of RT expenses in Korea using national insurance data. In Korea, over 98% of patients with cancer are registered in the national cancer registry system [11], and approximately 95% of the costs for cancer treatment, including RT expenses, are supported by national insurance. This study yielded unclear results, as the total medical expenses included the medical expenses borne by the insurer (NHIS) and patients. Nevertheless, the expenses for cancer were fixed at approximately 5%. In addition, although this exemption calculation for patients with cancer is applicable only for 5 years from the diagnosis of cancer, no change in the co-payment rate is expected because the exemption calculation is re-applied if the cancer treatment, such as RT, is required again. Therefore, the results of this study are close to the insurer’s point of view.
We reviewed HIRA data with regard to RT from 2016 to 2020, focusing on its use and expense. The expenses for RT were over 600 million USD in 2020, having increased 1.5 times over 4 years in tandem with a growing RT infrastructure. The proportion of RT expenses in total insurance claims in Korea also increased from 0.62% in 2016 to 0.72% in 2020. This was mainly because of the increased usage of advanced techniques, especially IMRT. It is suggested that the following changes have affected RT clinics. Since 2015, the coverage of national insurance has been expanded to include advanced techniques for most types of solid tumors [5]. Furthermore, given the evidence regarding the benefits of advanced techniques in the management of various tumors, these methods appear to have been rapidly applied in clinics [10,12]. Expenses for IMRT increased stiffly, constituting 76.9% of total RT expenses in 2020. Further, the sensitivity analysis of expenses showed that the total expenses with a 4.5% discount rate had been maintained at the same level since 2018; however, the IMRT expenses continue to increase (Fig. 3). Expenses for RT have also increased recently in Japan, and the increase rate is similar to that in Korea [13]. However, Korean IMRT use was higher compared to the 20%–30% increase in Japan [13,14].
Contrary to the increase in expenses, the number of patients has not changed, and the number of fractions has decreased over 4 years. Decreased fractions might be caused by recent clinical trends such as fewer fractionations including SBRT over traditional palliation and the protocol of hypofractionation in early breast cancer management [4,15]. However, despite the increase in infrastructure for RT and the total number of patients with cancer, the number of patients per radiation oncologist and machines has decreased continuously. The lack of detailed reasons provided for this phenomenon in this study is because advanced techniques generally need more time and resources per fraction when compared to those of 2D-RT and 3D-CRT, and this may limit the capacity of RT [16]. Therefore, we could not conclude the current number of radiation oncologists and the RT infrastructure are sufficient since IMRT has been used universally. In 2020, the number of RT machines was 4.1 megavoltage machines per million in Korea, and it was still much lesser than that in Japan, which is approximately 8–9 per million [9]. Furthermore, the total RT equipment, including machines using megavoltage X-rays or radionuclides, is lesser in Korea than that in other developed countries. In 2019 or 2020, there were 6.1, 8.1, 11.5, and 19.1 per million inhabitants in Korea, the United Kingdom, the United States, and Switzerland, respectively [17]. Therefore, we suggest that Korea has the potential to increase the number of RT machines. Most new RT machines can use the IMRT technique, and its usage is expected to increase further owing to the greater utilization of advanced techniques.
Regarding characteristics, the proportion of older individuals was high and increased gradually (Fig. 4). This may be caused by the aging of the population and longer life expectancy [1]. From 2016 to 2020, the population of individuals aged over 65 years increased by 21.5 % in Korea (http://kosis.kr) (S1 Datafile). The registered patients with cancer aged 60 years or above also increased by 8.6% from 2016 to 2019 (http://kosis.kr) (S1 Datafile). These would have influenced the use of RT. Furthermore, old age is associated with impaired functioning and comorbidities, and these may contraindicate the use of radical surgery. Hence, RT can be utilized more frequently in older individuals. Aging has caused higher medical expenses in developed countries such as the United States, France, England, and Japan [13]. Aging in the Korean population is presumed to show a similar trend as that of Japan, and expenses for RT are likely to be affected. Additionally, although the use of advanced techniques was relatively higher in children and older patients, the expenses of IMRT increased the most in the 30–40 year age-group. It was considered that this was because of the wide application of IMRT in the management of breast cancers in Korea [10]. The medical fees of the planning and treatment for IMRT in 2020 were approximately 4.0 and 2.3 times higher than those for 3D-CRT, respectively (S2 Table). Therefore, increased IMRT use can have a greater impact on increased costs.
In terms of geographical distribution, the number of patients seemed to be dependent on the extent of infrastructure available rather than to the actual population of patients with cancer in the various regions. A previous study has confirmed that several big hospitals in Seoul dominate patient care services, and this regional concentration was also shown with regard to RT [9]. This trend was also reflected in this study. We found regional differences when comparing the number of patients undergoing RT to the regional population, the number of regionally registered patients with cancer, and that of patients who were newly diagnosed with cancer based on the hospitals where their condition was diagnosed (S1 Datafile). An average of 1,800 patients per million people underwent RT in Korea; however, the average in Seoul was 4,331 patients per million. Furthermore, compared to 40–50 per 1,000 registered patients with cancer in each region, Seoul had 88 per 1,000 registered cancer patients. However, the ratio of patients receiving RT per 1,000 patients who were newly diagnosed with cancer, identified based on the hospitals where they were diagnosed with cancer, was similar throughout most regions (S1 Datafile). Although preference for big hospitals is a feature of Korean health care, regional balancing might be required considering the extra charges for transportation, accommodation, as well as medical issues.
There were some limitations in this study. The number of patients may have been overestimated as summarized data with the varying codes of HIRA were used. Nevertheless, it was considered that the overall trend of patients associated with RT was worth reviewing. In addition, we did not distinguish between cancer types in our assessment of clinical trends; different patterns according to cancer types may have been revealed if the cancer types had been distinguished. We are undertaking future research based on the claim data linked with RT. This will include information on the major cancer types.
In Korea, recent medical expenses for RT have increased. Furthermore, expenses for RT in the future are expected to increase in accordance with the technological advances and their clinical acceptance, as well as the requirements of the aging population.
Electronic Supplementary Material
Supplementary materials are available at Cancer Research and Treatment website (https://www.e-crt.org).
Notes
Ethical Statement
The review exemption of this study using the publicly available information was approved by the Institutional Review Board (SMC 2022-06-067).
Author Contributions
Conceived and designed the analysis: Lee JE, Yang K, Ahn YC, Park W, Huh SJ.
Collected the data: Lee JE, Yang K.
Performed the analysis: Lee JE, Yang K.
Wrote the paper: Yang K.
Revision of the draft: Lee JE, Park W, Huh SJ.
Conflicts of Interest
Yong Chan Ahn, the editor-in-chief of the Cancer Research and Treatment, was not involved in the editorial evaluation or decision to publish this article. All remaining authors have declared no conflicts of interest.