Cost Utility Analysis of a Pilot Study for the Korean Lung Cancer Screening Project
Article information
Abstract
Purpose
The aim of this study was to evaluate the cost utility of a pilot study of Korean Lung Cancer Screening Project.
Materials and Methods
We constructed a Markov model consisting of 26 states based on the natural history of lung cancer according to the Surveillance, Epidemiology, and End Results summary stage (localized, regional, distant). In the base case, people aged 55–74 years were under consideration for annual screening. Costs and quality-adjusted life years were simulated to calculate the incremental cost utility ratio. Sensitivity analyses were performed on the uncertainty associated with screening target ages, stage distribution, cost, utility, mortality, screening duration, and discount rate.
Results
The base case (US$25,383 per quality-adjusted life year gained) was cost-effective compared to the scenario of no screening and acceptable considering a willingness-to-pay threshold of US$27,000 per quality-adjusted life years gained. In terms of the target age of screening, the age between 60 and 74 years was the most cost-effective. Lung cancer screening was still cost-effective in the sensitivity analyses on the cost for treatment, utility, mortality, screening duration, and less than 5% discount rates, although the result was sensitive to a rise in positive rates or variation of stage distribution.
Conclusion
Our results showed the cost-effectiveness of annual low-dose computed tomography screening for lung cancer in high-risk populations.
Introduction
Lung cancer is the most leading cause of death and the second most common cancer in both sexes, globally [1]. In Korea, the incidence and mortality of lung cancer are the highest among cancers, despite the fact that the number of new cases and 5-year mortality rates (due to lung cancer) have been decreased since the early 2000s [2,3]. The big burden of disease, attributed from high incidence and mortality rates, was probably due to persistent smoking rates and the absence of a national lung cancer screening program. The smoking rate in Korean men was the highest in all Organization for Economic Co-operation and Development countries about 15 years ago and the rate did not significantly decline [4]. Although the cost-effectiveness of current national screening programs (breast, cervical, colon, and stomach cancers) was reported according to the principles of the national health screening program, the evidence for lung cancer screening has not been reported in South Korea [5–9].
There has been cumulative evidence on the benefit of lung cancer screening. The National Lung Cancer Screening Trial utilizing low-dose computed tomography (LDCT) led to a mortality reduction and showed cost-effectiveness in the screening of lung cancer in the United States [10,11]. The Dutch-Belgian Randomized Lung Cancer Screening Trial also showed that reduced lung cancer mortality in the LDCT screening group [12]. In addition, lung cancer screening with LDCT was cost-effective in heavy smokers [13]. Nevertheless, the cost-effectiveness of lung cancer screening programs varies across different screening designs [14,15].
In 2017, the Korean Lung Cancer Screening Project (K-LUCAS) was launched [16]. The K-LUCAS is a nationwide, multicenter, prospective study to determine the effectiveness and feasibility of screening for lung cancer using LDCT [16,17]. The interim results of the K-LUCAS showed promising evidence to detect early stage lung cancer in Korean populations [16]. We aimed to provide evidence on the cost-effectiveness of the lung cancer screening program with LDCT to relevant stakeholders such as policymakers, administrators or academics in the field of the healthcare sector. Therefore, we conducted a cost–utility analysis of a pilot study of the K-LUCAS.
Materials and Methods
1. Model structure and assumptions
We constructed a Markov model for economic evaluation of lung cancer screening using LDCT consisting of 26 Markov states, including the states where no lung cancer case or lung cancer death have been reported (i.e., the absorbing state) (Fig. 1). Whether an individual is a candidate for lung cancer screening or not, the simulation of our Markov chain starts from the state without cancer before a diagnostic test. Once an individual in the cohort is diagnosed with lung cancer, they are classified according to the Surveillance, Epidemiology, and End Results (SEER) summary stage (i.e., localized, regional, or distant) and follow the natural history of cancer: the initial treatment (index year), follow-up (follow-up year 1–7), and the period after follow-up [18]. The transitions between states were treated as being irreversible, referring to the previous study [19]. We did not consider a stage shift according to the disease severity. For example, if an individual is diagnosed with localized lung cancer, they neither move backward or forward between cancer progression stages. A hypothetical population of 10,000 individuals was simulated until they died or reached the age of 100 years. The length of cycle was one year, and a 5% annual discount rate was applied.
2. Base case scenario
We defined the strategy used in the K-LUCAS as a base case. The eligibility criteria for the K-LUCAS were as follows: current or former heavy smokers (at least 30 pack-year smoking history) and individuals aged 55–74 years [16]. The eligible individuals for screening were subjected to annual LDCT screening. We assumed that treatment rates for lung cancer follow the rates of lung cancer patients from the Korean Central Cancer Registry (KCCR), a census of cancer cases [20].
3. Model parameters: positive rate and mortality
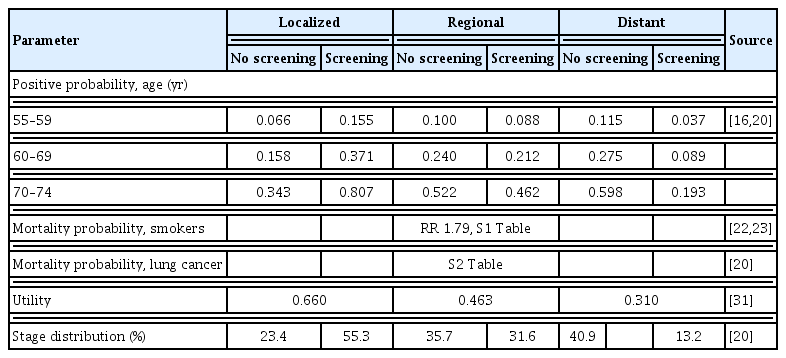
Positive rates by the SEER summary staging and age groups (i.e., 55–59, 60–69, 70–74) for screening and non-screening populations were calculated using the first year data from the K-LUCAS and the KCCR, respectively (Table 1) [16,20]. A positive rate was transformed into probabilities using the formula for converting rates to probabilities, and vice versa [21]. The mortality rate of smokers was calculated by multiplying the general mortality rate (by age group from the life tables of Statistics Korea) and the relative risk for all-cause mortality for smokers (relative risk, 1.79) (S1 Table) [22,23]. Lung cancer annual mortality according to the SEER summary stage was obtained from the KCCR data (S2 Table) [20]. Considering the skewness attributed to insufficient data, we replaced the annual mortalities with the pooled mortalities for seven years between 2006 and 2012. We assumed that the mortalities would be similar with those of general population after 7 years of diagnosis.
4. Model parameters: costs associated with lung cancer care
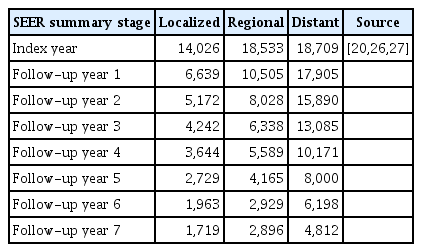
According to Korean guidelines for economic evaluation of pharmaceuticals, we included medical costs (including out-of-pocket expenses) and non-medical costs (for patient time, transportation, and caregivers) from the limited societal perspective [24,25]. Table 2 describes total costs according to the SEER summary stages. In particular, the medical costs consisted of initial screening and treatment costs (including further workups). The screening cost per test (US$165) was determined using the K-LUCAS data. To estimate total medical costs, we summed the national health insurance (NHI) payment and out-of-pocket expenses (including cost sharing payment and non-payments). Both the NHI payment and the cost sharing payment were obtained from the KCCR data and the NHI claim data. There have been no official reports or data on non-payment expenses in Korea. Therefore, we estimated the non-payment expenses from the survey on the benefit coverage rate of the NHI in 2006 [26]. The transportation costs were calculated from the 2008 Korea Health Panel Study (KHPS) [27]. While the caregiving costs for admitted patients were also derived from the 2008 KHPS, the costs for patients at home were estimated at one-third of the caregiving costs for admitted patients [28]. All cost values were adjusted for annual inflation and recalculated in 2015 dollars (US$1=KR₩1,131.52) [29].
5. Model parameters: utilities of lung cancer-related health states
The utility weights of smokers (i.e., utilities of initial target populations) were obtained from the Korean National Health and Nutrition Examination Survey (KNHANES) data set in 2015 [30]. The weights as follows: age 55–59, 0.942; age 60–64, 0.944; age 65–69, 0.916; age 70–74, 0.880; age 75–79, 0.887; age ≥ 80, 0.829. The utility weights of health states in each cancer stage were obtained from the utility study for lung cancer-related health states in Korea (Table 1) [31].
6. Sensitivity analyses
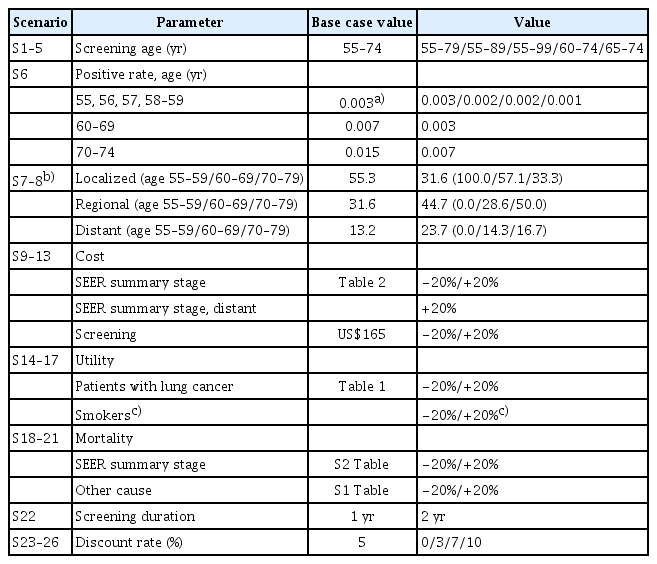
Alternative scenarios for the sensitivity analysis were designed based on the following criteria: a target age group, epidemiological parameters such as positive rates or mortalities, distributions of the summary stages by the SEER, costs associated with healthcare service or screening, a utility, a screening cycle, and a discount rate (Table 3). We included various target age groups taking into account the initiation and discontinuation of screening: age 55–79, 55–89, 55–99, 60–74, 65–74 (S1–5, ‘S’ denoted scenario). In terms of epidemiological parameters, we applied a reduced rate of positive rates, considering the result that additional confirmation tests reduce confirmatory positive rates [11]. Based on positive rates in the base case, we reduced 20% every year from age 55 to 57 and applied a 50% reduction thereafter (S6). The distribution of the SEER summary stages was also considered in the sensitivity analyses. In the base case, we classified the stage by the SEER from the seventh TNM classification as follows: localized matched to TNM I, regional matched to TNM II–III, and distant matched to TNM IV reflecting translation between TNM classification and the SEER summary stages and overall survival by TNM stage [32,33]. For the sensitivity analysis on the stage distribution (S7), while we extended the scope of distant stage, localized stage was only confined to TNM Ia considering survival rates and clinical advice from physicians (localized, TNM Ia; regional, TNM Ib–IIIa; distant, TNM IIIb–IV) [33]. We also included the distribution by age group (S8) using the SEER summary stage. In terms of costs and utilities, we simulated with values increased or decreased by 20% (S9–17). The uncertainty of mortalities was included in the sensitivity analyses as follows: (1) ±20% mortality of the patients depending on the stage by the SEER (S18–19), (2) ±20% mortalities due to diseases other than lung cancer (S20–21). In terms of screening interval, biennial screening was used instead of annual screening (S22). We simulated the model with 0%, 3%, 7%, and 10% of discount rates (S23–26). The incremental cost-utility ratios (ICURs) were compared with the willingness-to-pay (WTP) threshold of US$27,000 per quality-adjusted life year (QALY) gained in Korea [34].
Results
1. Base case analysis
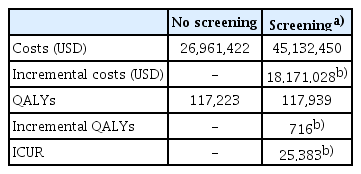
The results of the cost utility analysis are presented in Table 4, which compares the cost utility ratio (ICUR) between screening (base case) and no screening (S0). The total healthcare costs and QALYs gained of the no screening scenario were US$26,961,422 and 117,223 QALYs gained, respectively. The total costs including a screening fee were US$45,132,450 and the total QALYs gained were 111,939 in the base case scenario. The incremental values of the base case (target age 55–74, annual, discount rate 5%) were US$18,171,028 and 716 QALYs gained in the costs and QALYs, respectively. The ICUR of the base case scenario, compared to the scenario of no screening, was US$25,383 per QALY gained.
2. Sensitivity analysis
We performed sensitivity analyses to deal with the uncertainty associated with our assumptions on the model parameters. In the variation of screening target ages (base case, age 55–74; S0, no screening; S1, age 55–79; S2, age 55–89; S3, age 55–99; S4, age 60–74; S5, age 65–74), base case, S1, and S5 were extended dominated (Fig. 2). The most cost-effective choice was to screening the age between 60 and 74 years. However, there was no noticeable difference between screening age groups starting from age 55, compared to no screening: base case (age 55–74, US$25,383 per QALY gained), S1 (age 55–79, US$25,450 per QALY gained), S2 (age 55–89, US$25,616 per QALY gained), and S3 (age 55–99, US$25,630 per QALY gained), respectively.
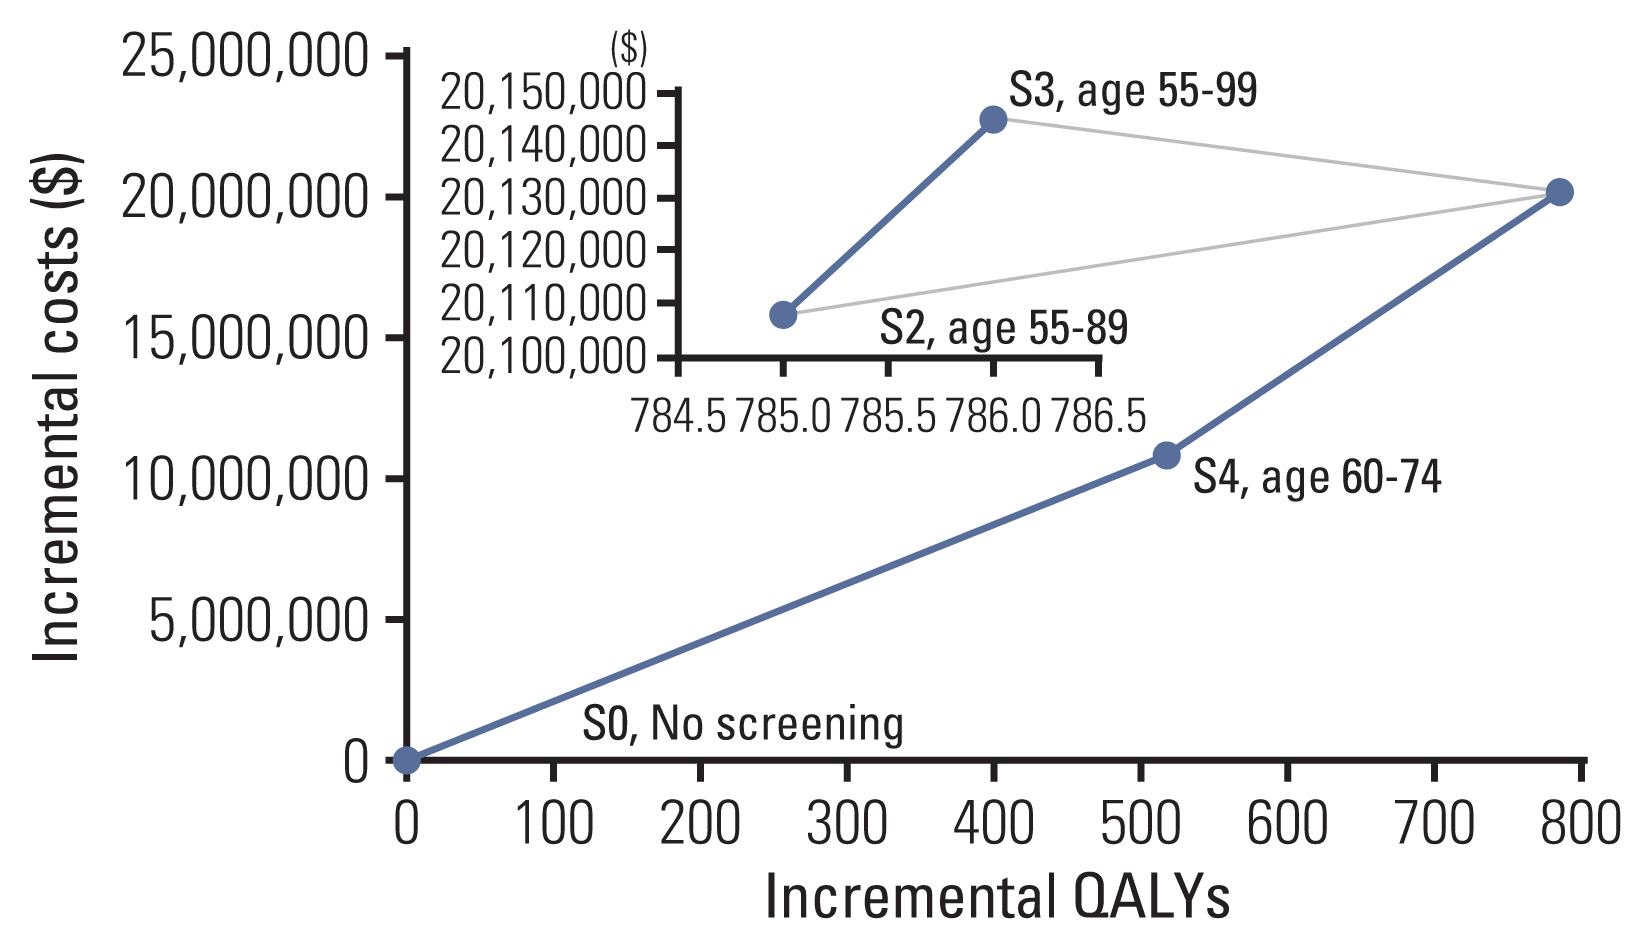
Cost utility efficiency frontier. S, Scenario; S0, No screening; S1, age 55–79, S2, age 55–89; S3, age 55–99; S4, age 60–74; S5, age 65–74. Base case, S1, and S5 were excluded due to extended dominance.
The results of the sensitivity analyses on parameters other than screening ages are shown in the tornado diagram in Fig. 3 and the specific values are presented in S3 Table. When the positive rates were lower than the base case (S6), the ICUR (US$45,898 per QALY gained) increased significantly, exceeding the threshold of the WTP estimated in Korea (US$27,000 per QALY gained). There was also a significant rise in the ICUR when changing the distribution of the SEER summary stage (S7, US$63,911 per QALY gained). However, the ICUR was still below the threshold when applying the distribution of the SEER summary stage according to the age groups (S8, US$20,957 per QALY gained). In the variation of the cost parameters, lung cancer screening with LDCT remained cost-effective (S9, US$25,290 per QALY gained; S10, US$25,477 per QALY gained; S11, US$23,768 per QALY gained; S13, US$20,213 per QALY gained), except for a scenario of 20% rise in screening costs (S12, US$30,553 per QALY gained). Subtle changes in the ICUR were observed when varying the utility values (S14, US$22,797 per QALY gained; S15, US$28,624 per QALY gained; S16, US$23,895 per QALY gained; S17, US$27,795 per QALY gained). In terms of mortality probabilities, our conclusions changed only when the mortalities according to the SEER summary stage increased by 20% (S18, US$30,236 per QALY gained). Biennial screening also showed cost-effectiveness, though the ICUR slightly increased (S22, US$26,672 per QALY gained). Lung cancer screening with LDCT showed cost-effectiveness under a discount rate of 5% (S23, a discount rate of 0%, US$16,419 per QALY gained; S24, a discount rate of 3%, US$21,382 per QALY gained).
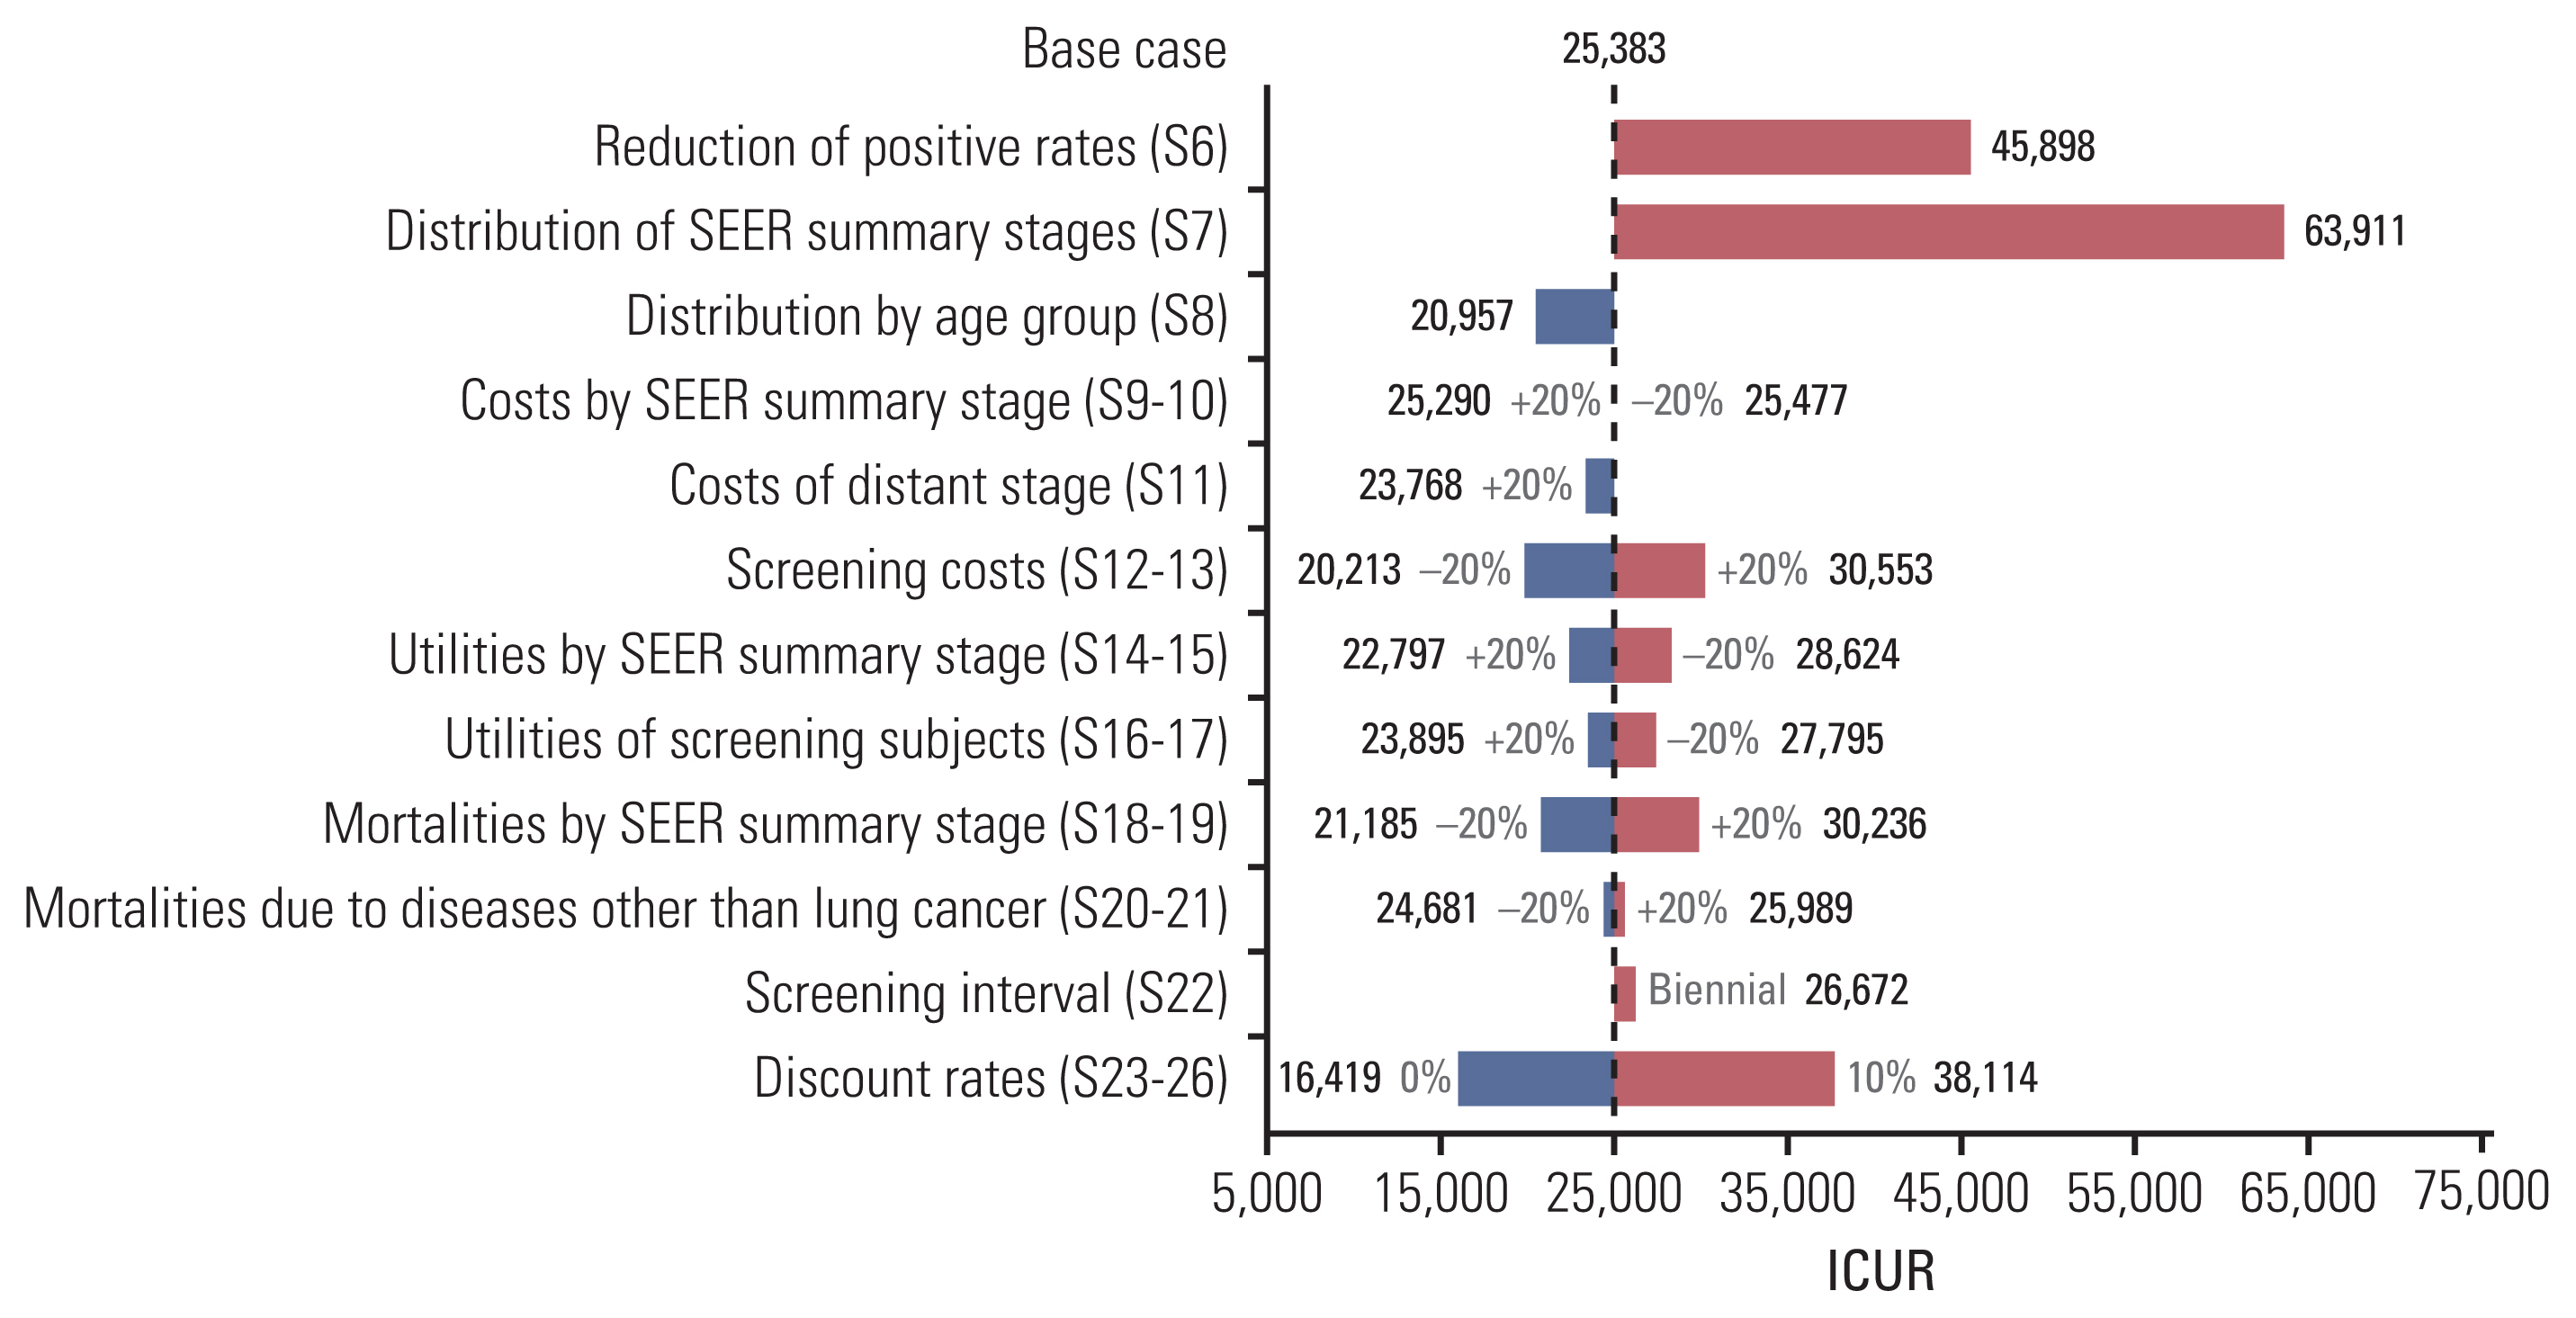
Sensitivity analyses, tornado diagram of ICUR. ICUR, incremental cost-utility ratio; S, Scenario; S6, reduction of positive rates (age 55–57, −20%; age ≥ 58, −50%); S7, distribution of SEER summary stages (localized, TNM Ia; regional, TNM Ib–IIIa; distant, TNM IIIb–IV); S8, distribution of SEER summary stages by age group (age 55–59: localized 100.0%, regional 0.0%, distant 0.0%; age 60–69: localized 57.1%, regional 28.6%, distant 14.3%; age 70–79: localized 33.3%, regional 50.0%, distant 16.7%).
Discussion
We provided evidence on the economic evaluation of the pilot results of the K-LUCAS in a high-risk population of lung cancer. The lung cancer program (i.e., base case) cost more, but also gained more in QALYs from the limited societal perspective. Considering the cost-effectiveness threshold in Korea (US$27,000 per QALY gained) [34], an annual screening program with heavy smoker populations aged between 55 and 74 (US$25,383 per QALY gained) would be regarded as an appropriate healthcare intervention for lung cancer in Korean health system. The cost per QALY gained in our study was relatively lower compared to the previous outcomes, ranging between US$27,756 and US$243,077 [35]. Although the results of the sensitivity analyses supported the robustness of our findings, there were several considerations to maximize cost-effectiveness. Concerning screening starting age, it might be suggested that the initiation of screening should be delayed to age 60 (instead of age 55) for cost-effectiveness. There was no significant change in the cost-effectiveness in terms of costs, utilities, mortalities, and screening cycles. Our sensitivity analyses also showed the robustness of our conclusions considering a WTP of Korea US$30,000 per QALY gained [36].
In our model, we did not consider the different types of lung cancer, although there were differences in distribution and survival rates between non–small cell lung cancer and small cell lung cancer [37]. These differences between lung cancer types can be reflected in the model by defining states of types of cancer as seen in the previous study [19]. The study also incorporated a stage shift between cancer stages in the model, although these transitions were not dealt with in other economic evaluation studies on lung cancer screening [14,15,19]. Once patients were diagnosed with a certain stage, we assumed that the patients remained in the same stage throughout the natural history of lung cancer. The inclusion of the transitions representing deterioration (e.g., from localized to regional) might have decreased the QALY gained and increased costs attributed to cancer treatments. Moreover, the transitions denoting recovery might have led to opposite effects (i.e., increased QALY gained and decreased costs).
It is natural that the cancer stage distribution is the most influential factor on the cost-effectiveness of lung cancer screening program. Like other screening programs, a lung cancer screening test aims to detect an early stage lung cancer, when it is operable, to reduce mortality by decreasing the incidence of advanced stage cancer [38]. Therefore, we took a conservative assumption in the sensitive analysis on the stage distribution (S7). A localized stage was limited to TNM Ia according to the TNM staging system, though TNM II also could be categorized to the localized stage [32]. We also applied the distribution stratified by age group under the conservative assumption (S8). In these assumptions, the impact on the ICUR was considerable (S7, US$ 63,911 per QALY gained; S8, US$ 20,957 per QALY gained). Accordingly, it should be noted that the cost-effectiveness of lung cancer screening could be worse when early detection rate is low.
We used accessible population data regarding epidemiological parameters such as mortality of cancer patients from the KCCR and stage distribution of cancer from the K-LUCAS. The annual mortalities of lung cancer patients were calculated between 2006 and 2012 in the KCCR. Then, we adjusted mortality rates by substituting with 7-year average mortality rates in the situation as follows: zero mortality attributable to annual fluctuations; zero denominator due to no survival in the previous year; irrational figures from the clinical point of view (i.e., decreasing mortalities despite increasing disease severity). We used several estimated parameters, including the mortalities of smokers, due to a lack of recent data sources. In addition, we could not obtain the latest figures on the costs of transportation or caregiving, hence inflation rates were applied to adjust the cost to year 2015.
Our study has several limitations. Firstly, we did not consider smoking cessation effects in patients who detected in the screening program because there was no information. Mortality was doubled when the patient did not stop smoking after early detection of lung cancer [39]. Given that additional benefits of smoking cessation have been reported in several cost-effectiveness studies of lung cancer screening [40,41], introduction of the smoking cessation is worth to consider in subsequent studies. Secondly, adherence to lung cancer screening was not the parameter of interest, so it was not included in the simulation model. The cancer stage distribution was the main parameter to figure out the impact of lung cancer screening on cost-effectiveness. In addition, variation in adherence to lung cancer screening did not change ICUR due to the same proportionate value change in incremental costs and QALYs. Considering that overall cancer screening adherence rates ranged were from 48.9% (cervical cancer) to 59.1% (medical checkup), a model including the change of adherence rates needs to be examined for future works [42]. Thirdly, the ability of diagnostic tests, such as sensitivity or specificity, was not dealt with in the model due to model simplicity and data availability. Recent interim results from K-LUCAS reported a 14.6% of false-positive rate of lung cancer screening [16]. A more sophisticated model could handle the cost attributed to the false-positive results. Fourthly, there was discordance in the data source used to derive positive or mortality probabilities. Although it was inevitable in this modelling simulation using pilot study, data linkage or accumulated data from a nationwide screening can alleviate the limitation. Lastly, we used aggregate values, regardless of sex. There was a study constructing separate models for men and women based on sex differences in the occurrence and survival of lung cancer [13]. According to the Korean Statistical Information, a big difference was observed in lung cancer cases between the sexes in 2018 (men 76.3 per 100,000, women 35.4 per 100,000) [43]. In further studies, sex differences in epidemiological features should be dealt with accessible data.
In conclusion, our results support the adoption of annual LDCT screening for lung cancer in heavy smokers. The base case (aged 55–74) showed the cost-effectiveness of the lung cancer screening program but the scenario targeting age between 60 and 74 years would be the most cost-effective in the context of Korea. Considering the economic benefits of lung cancer screening and the high incidence and mortality of lung cancer, annual LDCT screening with a target age of 60 years and above may be a favorable choice in countries with high disease burden due to lung cancer.
Electronic Supplementary Material
Supplementary materials are available at Cancer Research and Treatment website (https://www.e-crt.org).
Notes
Ethical Statement
This research was approved by the Institutional Review Board of Asan Medical Center (2018-0593). Informed consents are not required for this modeling study using secondary data.
Author Contributions
Conceived and designed the analysis: Jo MW.
Collected the data: Kim J, Cho B, Kim SH, Choi CM, Kim Y, Jo MW.
Contributed data or analysis tools: Kim J, Cho B, Kim SH, Choi CM, Kim Y, Jo MW.
Performed the analysis: Kim J, Cho B, Kim SH.
Wrote the paper: Kim J, Cho B, Kim SH, Choi CM, Kim Y, Jo MW.
Supervision and revision of the manuscript: Kim J, Cho B, Kim SH, Choi CM, Kim Y, Jo MW.
Conflicts of Interest
Conflict of interest relevant to this article was not reported.
Acknowledgements
This study was supported by a grant from the National R&D Program for Cancer Control, Ministry of Health & Welfare, Republic of Korea (1720310).


