Expression of Estrogen and Progesterone Receptors in Papillary Thyroid Carcinoma in Korea
Article information
Abstract
Purpose
The aim of this study was to examine the rate of expression of estrogen receptor α (ERα) and β1 (ERβ1), progesterone receptor (PR), and rate of overexpression of epidermal growth factor receptor (EGFR) in a relatively large cohort of patients with papillary thyroid carcinoma (PTC). We also aimed to examine whether each receptor influenced clinicopathological characteristics and prognosis of PTC.
Materials and Methods
We made a microarray of paraffin-embedded PTC surgical tissues from 436 patients. We compared the results of the immunohistochemical staining for each hormone receptor with clinicopathological characteristics.
Results
The positive expression rate of hormonal receptors was 40.4% for ERα, 83.7% for ERβ1, and 71.3% for PR in patients with PTC. Overexpression of EGFR was shown in 19.3% of patients with PTC. The age was lower (44.6±12.1 years vs. 47.1±12.5 years, p=0.040) and tumor smaller (0.96±0.69 cm vs. 1.13±0.82 cm, p=0.020) in the ERα positive group, which also showed higher PR positivity (80.7% vs. 65.0%, p < 0.001) and overexpression of EGFR (27.3% vs. 13.8%, p < 0.001). However, neither the positivity of hormone receptors nor overexpression of EGFR affected the recurrence of PTC.
Conclusion
In conclusion, most (94.6%) patients with PTC were found to exhibit positive expression for ERs or PR. We also found that neither the positive expression of hormone receptors nor overexpression of EGFR were associated with the recurrence of PTC.
Introduction
Thyroid cancer is the most common cancer among Korean women, along with breast cancer [1]. Many women have been diagnosed with thyroid cancer after being diagnosed with breast cancer, or vice versa. Several studies have been published on the relationship between these two cancers [2–4] and revealed that the rate of co-occurrence is significantly higher than that expected by chance [5]. Several theories explaining the relationship between breast and thyroid cancer have been suggested, among which the most predominant ones consider the effect of sex hormones. Estrogen and progesterone are major hormones known to be involved in the regulation of breast tumor growth and in the control of physiological functions through the estrogen receptor (ERα and β) and progesterone receptor (PR) [6].
Interestingly, it was confirmed that both ER [7] and PR [8] were also expressed in thyroid cancer. However, the rates of expression for each receptor were found to vary in previous studies, and thus the role of each receptor in the prognosis of thyroid cancer remains controversial. The cause of variations in the results might be due to differences in the applied methodology, such as the use of immunohistochemical (IHC) staining or polymerase chain reaction (PCR). Even in cases where the IHC staining method was used, the types and concentrations of antibodies used, and the criteria for positive staining (PS) were different in each study. In addition, in the evaluation of differentiated thyroid cancer, both papillary and follicular thyroid carcinomas are often included in the analysis; however, the ratio of these two cancers might differ.
In addition to ER, members of the epidermal growth factor receptor family (EGFR, HER2) have also been considered as factors affecting the progression and prognosis of breast cancer. In particular, EGFR is a tyrosine kinase receptor whose activation and initiation of signaling has been known to be associated with increased proliferation and resistance to apoptosis [9]. Interestingly, a bidirectional crosstalk has been shown to exist between EGFR and ER [10], with its effects having been confirmed in nonsmall cell lung cancer [11] as well as breast cancer [12,13]. Recently, a study suggested that the overexpression of EGFR could serve as an important biomarker of aggressive papillary thyroid carcinoma (PTC) [14], but the crosstalk between ER and EGFR in PTC has not been confirmed.
In this study, we examined the rate of expression of ERα, ERβ1, and PR and the distribution and correlation of each receptor in a relatively large cohort of patients with PTC. In addition, we explored whether overexpression of EGFR was correlated with the expression of each receptor. We also examined whether each receptor influenced the prognosis of PTC.
Materials and Methods
1. Patients
This study was designed as a retrospective observational study. We only included patients with available formalin-fixed paraffin-embedded (FFPE) tumor sections after surgery and with available clinical data. A total of 436 patients with PTC were included in this study. In order to confirm the positive rate of each receptor in normal thyroid tissue, we additionally checked samples from 29 patients who underwent surgery with nodular hyperplasia during the same period. Patients underwent thyroid surgery at Chung-Ang University Hospital from January 1, 2011 to December 31, 2012, and the median follow-up was 6.8 years (interquartile range, 6.2 to 7.0 years). Among all patients, 412 (94.5%) had total thyroidectomy, whereas the remaining 24 (5.5%) had lobectomy as the first treatment. We examined the age at the time of surgery, sex, tumor size, lymph node metastasis, lymphatic and blood vessel invasion, multiplicity, extrathyroidal extension, BRAFV600E mutation, and recurrence of each patient. Recurrence was defined as the case of finding new lymph node metastasis on thyroid ultrasound during follow-up and confirmed by biopsy and surgery, or when distant metastasis was found by bone scan or computed tomography.
2. Tissue microarray preparation
Tissues obtained from patients were fixed in 10% buffered formalin and embedded in paraffin. After screening the available samples obtained from each patient, a paraffin block that was well-fixed and contained a representative tumor section was selected. A single tissue column (2.0 mm in diameter) was obtained from each selected paraffin block and samples were separately arranged in new 60-hole recipient paraffin blocks using a trephine apparatus (SuperBioChips Laboratories, Seoul, Korea).
3. Immunohistochemistry
Briefly, 4 μm-thick sections of the FFPE tissue microarray blocks were prepared for immunohistochemistry. These sections were incubated with primary antibodies against ERα (rabbit monoclonal, catalog No. 790-4324, clone: SP1, Ventana Medical Systems, Tucson, AZ), ERβ1 (mouse monoclonal, catalog No. GTX70174, clone: 14C8, Ventana Medical Systems), PR (rabbit monoclonal, catalog No. 790-2223, clone: 1E2, Ventana Medical Systems), EGFR (mouse monoclonal, catalog No. 790-2988, clone: 3C6, Ventana Medical System, Inc.), and p27Kip1 (rabbit polyclonal, catalog No. E2604, Spring Bioscience, Pleasanton, CA) using the Ventana Benchmark ULTRA automated staining system (Ventana Medical Systems) as recently described [15]. Slides were read by a single pathologist (H.S.K with 20 years of experience) who was blinded to the clinical data of the patients.
4. Scoring system
We examined both the intensity of staining (IS) and the percentage of PS of cells. The IS value expressed the average IS, as follows: 0, none; 1, weak; 2, intermediate; and 3, strong (Fig. 1). The PS value expressed the estimated rate of tumor cells that stained positive for ERα, ERβ1, PR, and EGFR, as follows: 0, none; 1, < 1%; 2, 1%–10%; 3, 10%–33%; 4, 34%–66%; and 5, 67%–100%. The PS and IS values were then added to obtain a total score (TS), which ranged between 0 and 8. Tumors were classed as positive for the expression of ERα, ERβ, and PR if they possessed a TS ≥ 3. The overexpression of EGFR was defined as 3 (strong) staining of any percentage or 2 (intermediate) of > 50 % of tumor cells [14].

Immunohistochemical staining of estrogen receptor (ER) α, ERβ1, progesterone receptor (PR), and epidermal growth factor (EGFR) in papillary thyroid carcinoma (PTC) lesions. Formalin-fixed and paraffin-embedded PTC tissue sections were stained using the Ventana Benchmark ULTRA automated staining system with specific antibodies. (A) Normal thyroid tissue with negative ERα staining. (B) PTC tissue with negative ERα staining. (C) PTC tissue with weak positive ERα staining. (D) PTC tissue with intermediate positive ERα staining. (E) PTC tissue with strong positive ERα staining. (F) Normal thyroid tissue with negative ERβ1 staining. (G) PTC tissue with negative ERβ1 staining. (H) PTC tissue with weak positive ERβ1 staining. (I) PTC tissue with intermediate positive ERβ1 staining. (J) PTC tissue with strong positive ERβ1 staining. (K) Normal thyroid tissue with negative PR staining. (L) PTC tissue with negative PR staining. (M) PTC tissue with weak positive PR staining. (N) PTC tissue with intermediate positive PR staining. (O) PTC tissue with strong positive PR staining. (P) Normal thyroid tissue with negative EGFR staining. (Q) PTC tissue with negative EGFR staining. (R) PTC tissue with weak positive EGFR staining. (S) PTC tissue with intermediate positive EGFR staining. (T) PTC tissue with strong positive EGFR staining (A–T, ×200).
5. Real-time PCR
Hematoxylin and eosin–stained slides were reviewed, and the appropriate areas were marked. QIAmp DNA mini kits (Qiagen, Chatsworth, CA) were used for genomic DNA extraction.
Dual-priming oligonucleotide-based PCR analysis was performed using the Anyplex BRAFV600E Real-time Detection (v2.0) system (Seegene, Seoul, Korea). Each PCR reaction mixture contained 2 μL 5× BRAF primer, 3 μL 8-methoxypsoralen solution, 5 μL extracted DNA, and 10 μL 2× Anyplex PCR master mix for a total volume of 20 μL. PCR was performed using a GeneAmp 7500 Real-time PCR System (Applied Biosystem, Foster City, CA). Reactions underwent an initial 15-minute incubation at 94°C, followed by 35 cycles of denaturation at 94°C for 30 seconds, annealing at 62°C for 30 seconds, extension at 72°C for 60 seconds, and a final extension at 72°C for 10 minutes. If the Ct value of the internal control or V600E was ≥ 30 or undetermined, it was interpreted as negative. If the ΔCt was ≤ 13, it was regarded as positive for the BRAFV600E mutation. The ΔCt value was calculated as the difference in the cycle threshold between the target (BRAFV600E) and the internal control.
6. Statistical analysis
The student t test was used for comparisons of quantitative variables between groups, whereas the chi-square test was used for comparisons of qualitative variables between groups. The relationships between the ER subtype and the expression of PR were assessed using Spearman’s correlation analysis. Cox’s proportional hazard analysis was performed to identify the risk factor for the recurrence of PTC.
All statistical analyses were performed using the SPSS software ver. 17.0 (SPSS Inc., Chicago, IL). Differences were considered statistically significant if p < 0.05.
Results
1. Expression status and clinicopathological characteristics of estrogen and progesterone receptors in PTC
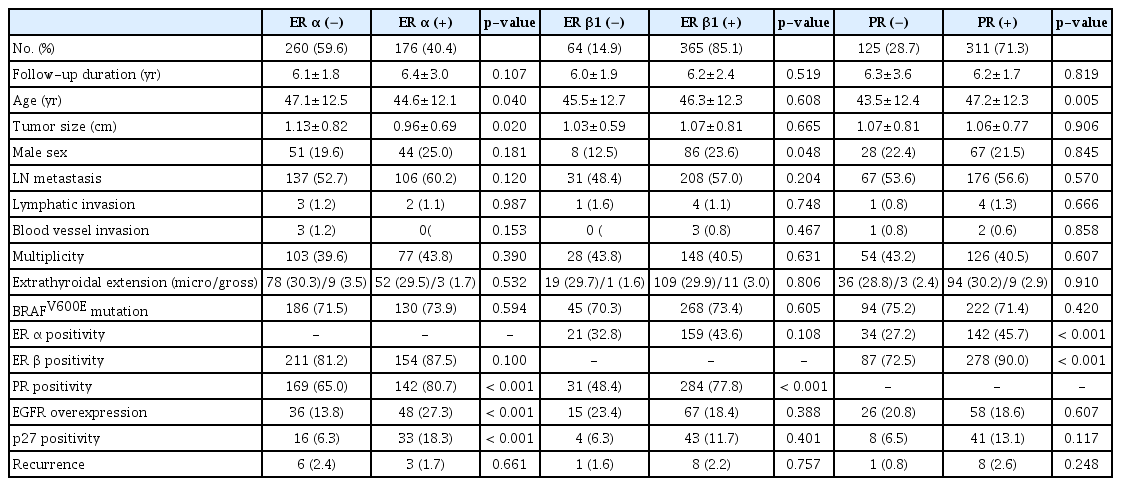
As shown in Table 1, staining for ERα, ERβ1, and PR was positive in 176 (40.4%), 365 (83.7%), and 311 (71.3%) patients with PTC, respectively. Overexpression of EGFR was observed in 84 (19.3%) patients with PTC. In 29 normal thyroid tissues, ERα was positive in 3 (10.3%), ERβ1 in 24 (82.8%), PR in 17 (58.6%), and EGFR overexpression was not found. Clinicopathological characteristics according to positivity of hormone receptors were shown in Table 2. The median age of patients was shown to be lower in the ERα (+) than in the ERα (−) group (44.6±12.1 years vs. 47.1±12.5 years, p=0.040). In contrast, the median age was higher in the PR (+) compared with the PR (−) group (47.2±12.3 vs. 43.5±12.4 years, p=0.005). Tumor size was smaller in the ERα (+) relative to the ERα (−) group (0.96±0.69 cm vs. 1.13±0.82 cm, p=0.020). Proportion of male sex was found to be higher in the ERβ1 (+) compared with the ERβ1 (−) group (23.6% vs. 12.5%, p=0.048).

Clinicopathological features of total study subjects
Clinicopathological characteristics according to the positivity of estrogen and progesterone receptors in papillary thyroid carcinoma
We observed that both the positivity of expression of ERα (45.7% vs. 27.2%, p < 0.001) and ERβ1 (90.0% vs. 72.5%, p < 0.001) were higher in the PR (+) group relative to the PR (−) group. In addition, the overexpression of EGFR was demonstrated to be higher in the ERα (+) than the ERα (−) group (27.3% vs. 13.8%, p < 0.001). Finally, we found that p27 expression was higher in the ERα (+) group (18.3% vs. 6.3%, p < 0.001).
2. Clinicopathological characteristics displayed by the co-occurrence of ERα and ERβ1 expression
Next, we aimed to identify whether there was a difference in the clinical features and prognosis when grouping patients according to their ERα and ERβ1 status (positive or negative). According to previous studies, when a tumor showed positive expression of ERα and negative expression of ERβ1, it was associated with a worse prognosis [16]. In our results, we observed a significantly lower PR expression and higher overexpression of EGFR in the ERα (+) ERβ1 (−) group (Table 3). However, none of the patients of the ERα (+) ERβ1 (−) group showed any recurrence during follow-up. In addition, we did not observe any significant difference in the rate of recurrence between groups. Further, the p27 expression was demonstrated to be the highest in the ERα (+) ERβ1 (+) groups.

Clinicopathological characteristics according to the combination of ER α and β1 positivity
3. Expression of ERs, PR, and EGFR based on sex and menopause
Because the levels of estrogen are known to differ according to sex and menopausal status, we analyzed the expression for ERs and PR, as well as the rate of overexpression of EGFR according to the sex and age of female patients using the age of 50 as a cutoff (Table 4). We observed that ERβ1 expression was higher among males (91.5% vs. 83.3%, p=0.048). When we determined the difference in the receptor expression using the age of 50 in the female group as a cutoff, the expression of PR was demonstrated to be higher in females over 50 y compared with younger females (78.3% vs. 66.7%, p=0.019). In contrast, we found that the rate of overexpression of EGFR was higher in the younger (23.2% vs. 14.7%, p=0.050) than the older female group.

Positivity of ER, PR, and EGFR according to sex and age of female
4. Relationship and distribution between each receptor
Because the expression of ERβ1, PR, and EGFR were shown to be higher in the ERα (+) group (Table 2), we analyzed the correlation between expression of the ERs and PR, overexpression of EGFR, and BRAFV600E mutation. As a result, we observed that ERα was positively correlated with PR (ρ=0.170, p < 0.001) and EGFR (ρ=0.167, p < 0.001). Likewise, ERβ1 was found to be positively correlated with PR (ρ=0.220, p < 0.001). However, the overexpression of EGFR did not show any correlation with the BRAFV600E mutation, with 55 patients (12.6%) exhibiting both overexpression of EGFR and the BRAFV600E mutation.
To confirm the distribution of the expression of ERs and PR, we created a BenDiagram according to the status of the receptors (Fig. 2). The distribution was confirmed in 429 patients except for seven patients whose ERβ1 status was not available. Briefly, 131 of 429 patients (30.5%) demonstrated to be positive for both ERs and PR. In contrast, we noted only 23 patients (5.4%) to be negative for both ERs and PR.
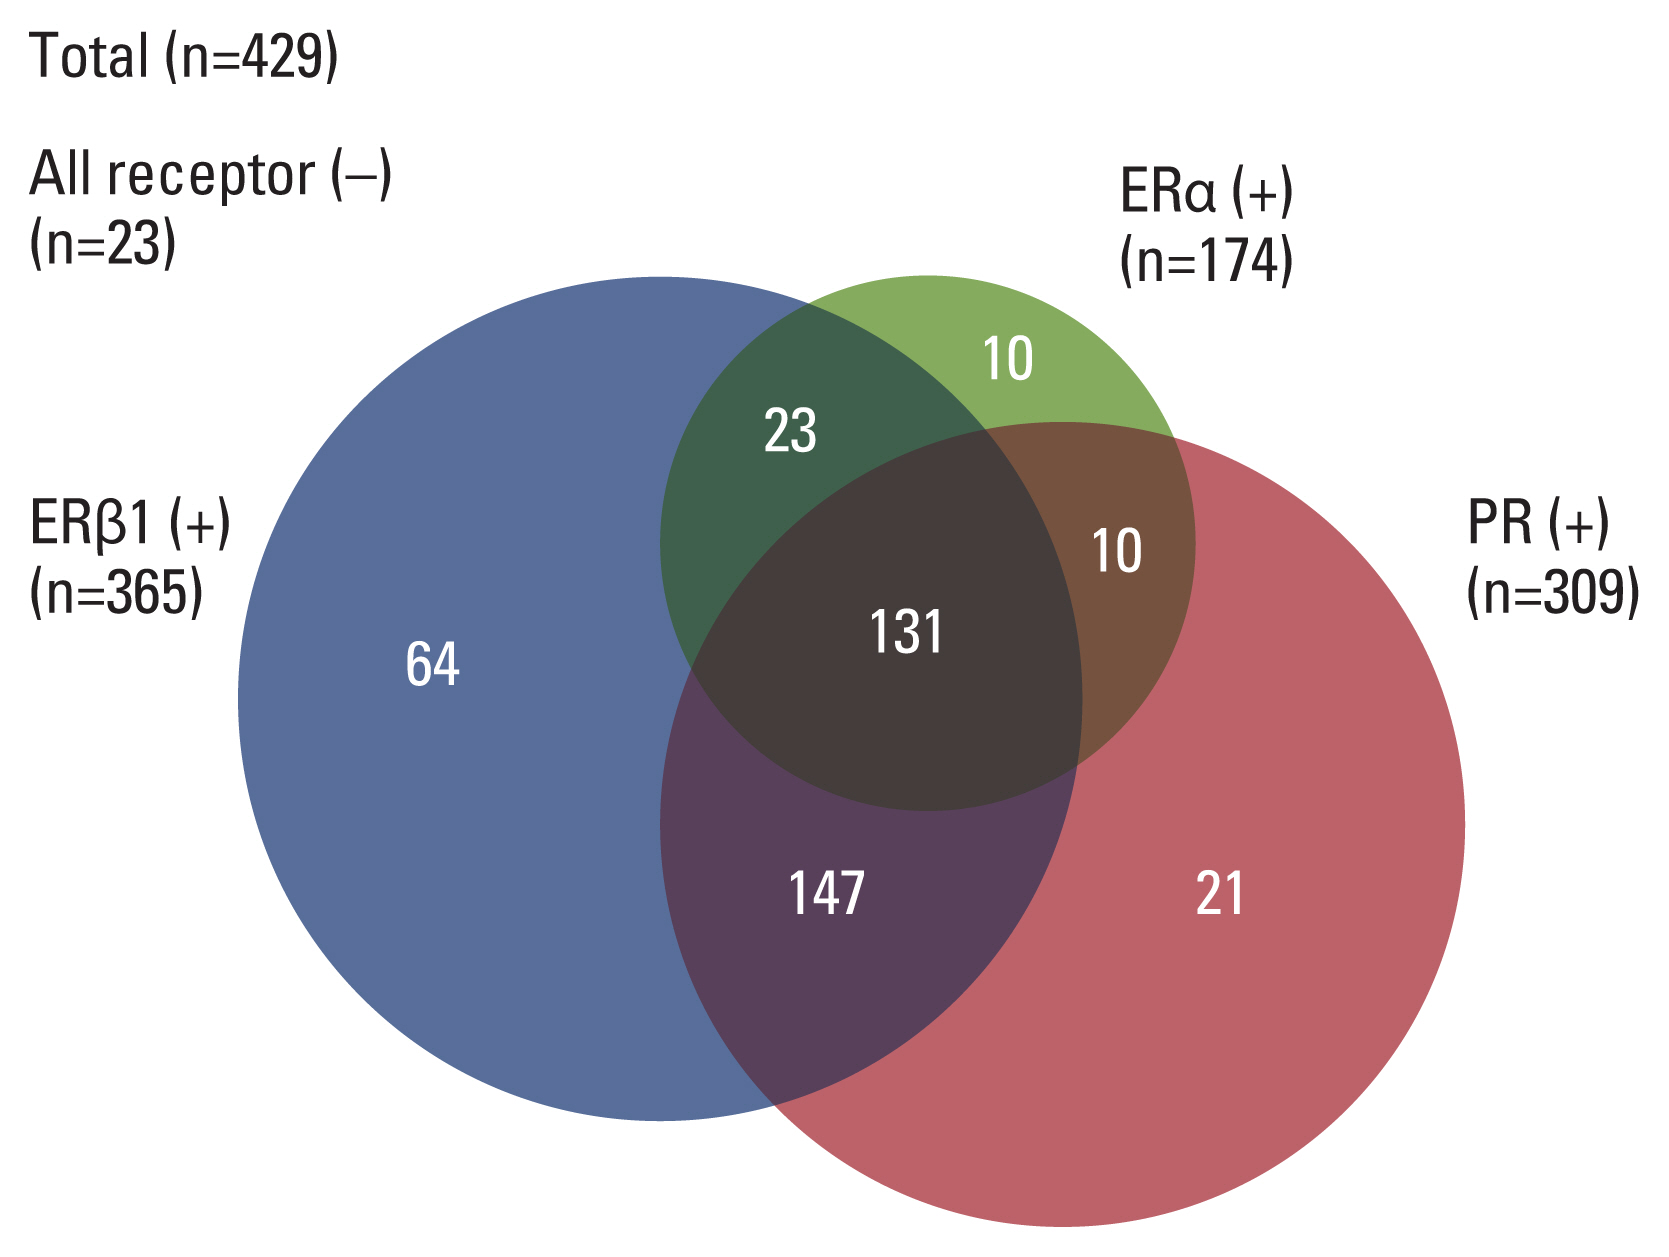
Venn diagram of the positive rates of estrogen receptors (ERs) and progesterone receptor (PR). The distribution was confirmed in 429 patients except for seven patients whose ER β1 status was not available.
5. Prognostic factors affecting the recurrence of papillary thyroid carcinoma
We performed survival analysis using Cox’s proportional hazard analysis to determine the effects of several parameters, including the expression of ERs and overexpression of EGFR on the recurrence of PTC (Table 5). We accordingly identified recurrences in nine patients (2%) during the average 6-year follow-up period. Interestingly, we observed that the expression of ERs and overexpression of EGFR did not affect the recurrence of PTC. However, the risk of recurrence was shown to be high in male patients (hazard ratio [HR], 5.864; 95% confidence interval [CI], 1.462 to 23.523), and the tumor size was also found to increase the risk of recurrence (HR, 1.867; 95% CI, 1.174 to 2.970). Further, we observed that lymphatic invasion also increased the risk of recurrence (HR, 15.810; 95% CI, 1.537 to 162.626).

Multivariate Cox’s proportional hazard analysis for the recurrence of papillary thyroid carcinoma
Discussion
In this study, we confirmed the positive rate of expression and distribution of hormonal receptors, and the overexpression of EGFR in a relatively large cohort of patients with PTC and examined the correlation and prognostic roles of these receptors.
Overall, we found that the rate of expression of hormonal receptors was 40.4% for ERα, 83.7% for ERβ1, and 71.3% for PR in patients with PTC. In total, 94.6% of cases were demonstrated to be positive for either ERs or PR. In several previous studies, the rate of positive expression of ERs and PR were reported to vary presumably due to differences in the immunohistochemistry methodology used. For instance, it has been reported that ERα was not detected in PTC in some previous studies [17,18]. However, recently published studies report that the positive rate for ERα expression was 25.6%–66.5% in PTC [19–22]. In our results, rate for ERα expression was 40.4%, consistent with recent studies. We assumed that this difference was due to the accuracy of the ERα antibody used in the previous study. Likewise, the positive rate of ERβ expression in thyroid cancer was reported to be 80%–100% [17–19,23], while the positive rate of PR expression was 45.3%–75.8% [21,22,24]. Our data also showed similar ERβ and PR expression with that obtained in previous results.
We also observed that the rate of expression of these hormone receptors did not differ according to sex except for that of ERβ1. Loss of ERβ1 has been shown to be more frequent in female patients with PTC compared with male patients with PTC. ERα has been well characterized as a mediator of cell proliferation, especially in breast cancer cells, driving cell proliferation in the presence of estrogen. In contrast, ERβ has been found to exert opposing actions to ERα, inhibiting ERα-mediated proliferation in many cell types, including PTC [20,25]. In addition, it has been reported that the increased level of expression of ERα and decreased level of expression of ERβ1 might play important roles in the pathogenesis of PTC among female patients of reproductive age [20]. However, there has been no research on whether women are characterized by increased loss of ERβ1 relative to men, so further studies are needed.
We evaluated the prognostic role of ERα and ERβ1 to recurrence of PTC. Because, in previous studies, nuclear ERα expression was associated with more extrathyroidal invasion in PTC [20] and ERβ (−) tumors showed vascular invasion more frequently [26]. However, contrary to our expectations, the level of hormone receptor expression did not affect recurrence, and only male sex, tumor size, and lymphatic invasion were associated with recurrence. Therefore, according to our findings, the effect of hormone receptors on prognosis of PTC do not seem to be significant. For the impact of EGFR overexpression on the prognosis of PTC, the overexpression of EGFR was reported to correlate with increasing stage, extrathyroidal extension, tumor capsule invasion, and adverse pathologic features in PTC [14]. It has been well established that the expression of EGFR is associated with poor prognosis and decreased survival rates in head and neck, ovarian, cervical, esophageal, gastric, breast, lung, and colorectal cancers [27]. In our study, we did not observe any difference in the aggressive features or prognosis of the ERα (+) ERβ1 (−) group, which showed about 50% of overexpression of EGFR, compared with other groups. Considering these results, because differentiated thyroid carcinoma itself has a very good prognosis, it is likely that the effect of ERs or EGFR overexpression on the prognosis might not be significant, unlike what has been expected in previous studies.
Our data showed that overexpression of EGFR was significantly lower, whereas PR positivity was significantly higher in older compared with younger female patients with PTC. Similarly, lower overexpression of EGFR has been shown to be more common in breast tumors of young women and has been associated with lower levels of hormone receptors, higher proliferation, genomic instability, and overexpression of HER2 [28].
Interestingly, in this study, we identified 16.5 % of patients with thyroid cancer exhibiting both overexpression of EGFR and the BRAFV600E mutation. BRAF is one of the three RAF proteins and a component of the mitogen-activated protein kinase (MAPK; ERK) signaling pathway, which is a complex of RAS and three protein kinases, namely RAF, MAPK/ERK kinase (MEK), and ERK [29]. When EGFR, a tyrosine kinase receptor, is activated by growth factors, it stimulates RAS and leads to the sequential activation of RAF and MEK [30]. The activation of the MAPK pathway signaling by either ligands or an activating mutation of one of the components is known to induce cell proliferation and survival by increasing transcription factors and gene expression [31]. It has been believed that the combination of overexpression of EGFR and other driver mutations would be mutually exclusive. However, previous studies showed that overexpression of both EGFR and the BRAFV600E mutation were present in the same patients in almost a quarter of patients with PTC [14], suggesting that this phenomenon might occur in PTC.
There were several limitations in our study. First, because this was a retrospective study that only included patients treated at a single hospital, selection bias cannot be excluded. Second, expression of each hormone receptor and overexpression of EGFR were evaluated using only the IHC staining technique. As there are no established criteria for the evaluation of the positivity of each receptor, inaccurate results could have been derived. In order to compensate for these limitations, we tried to apply the same criteria as the ones used in previous studies. Third, as only patients with relatively good prognosis were included in this study, and as only nine out of 436 (2%) had any recurrence, it was difficult to confirm the effect of hormone receptors or overexpression of EGFR on the recurrence of PTC. However, considering that the majority of PTCs are slowly progressing cancers with a very good prognosis, presence of hormone receptors or overexpression of EGFR might not have a significant prognostic role in PTC unlike in other cancers.
In conclusion, most (94.6%) patients with PTC were found to exhibit positivity for expression of ERs or PR, whereas overexpression of EGFR was found in only 19.3% of patients. In this study, we also found that the positive expression of hormone receptors or overexpression of EGFR were not associated with the recurrence of PTC. In summary, the ERα positive group was mainly younger and the average size of thyroid cancer was less than 1cm, and the ERβ negative group was mainly female. EGFR overexpression was highly related to ERα positivity and was also high in female under the age of 50. These results can be interpreted as being related to characteristics of thyroid cancer, which occurs mainly in young women in their 30s and 40s.
Notes
Ethical Statement
The study protocol was approved by the institutional review board of Chung-Ang University Hospital (IRB No 1900-004-389). Patients agreed to use their tissues for molecular study and secondary use in the other studies.
Author Contributions
Conceived and designed the analysis: Ahn HY, Song RY, Ahn HS, Kim HS.
Collected the data: Ahn HY, Kim HS.
Contributed data or analysis tools: Ahn HY, Kim HS.
Performed the analysis: Ahn HY.
Wrote the paper: Ahn HY, Kim HS.
Conflicts of Interest
Conflict of interest relevant to this article was not reported.