Early Metabolic Response Assessed Using 18F-FDG-PET/CT for Image-Guided Intracavitary Brachytherapy Can Better Predict Treatment Outcomes in Patients with Cervical Cancer
Article information
Abstract
Purpose
This study aimed to identify the prognostic value of early metabolic response assessed using 18F-fluorodeoxyglucose positron emission tomography/computed tomography (FDG-PET/CT) during radiation therapy (RT) for cervical cancer.
Materials and Methods
We identified 116 patients treated with definitive RT, including FDG-PET/CT–guided intracavitary brachytherapy, between 2009 and 2018. We calculated parameters including maximum (SUVmax) and mean standardized uptake values (SUVmean), metabolic tumor volume (MTV), and total lesion glycolysis (TLG) for baseline FDG-PET/CT (PETbase) and image-guided brachytherapy planning FDG-PET/CT (PETIGBT). Multivariable analyses of disease-free survival (DFS) and overall survival (OS) were performed.
Results
We observed a time-dependent decrease in PET parameters between PETbase and PETIGBT; ΔSUVmax, ΔSUVmean, ΔMTV, and ΔTLG were 65%, 61%, 78%, and 93%, respectively. With a median follow-up of 59.5 months, the 5-year DFS and OS rates were 66% and 79%, respectively. Multivariable analysis demonstrated that ΔSUVmax ≥ 50% was associated with favorable DFS (hazard ratio [HR], 2.56; 95% confidence interval [CI], 1.14 to 5.77) and OS (HR, 5.14; 95% CI, 1.55 to 17.01). Patients with ΔSUVmax ≥ 50% (n=87) showed better DFS and OS than those with ΔSUVmax < 50% (n=29) (DFS, 76% vs. 35%, p < 0.001; OS, 90% vs. 41%, p < 0.001, respectively). Adenocarcinoma was frequently observed in ΔSUVmax < 50% compared to ΔSUVmax ≥ 50% (27.6% vs. 10.3%, p=0.003). In addition, models incorporating metabolic parameters showed improved accuracy for predicting DFS (p=0.012) and OS (p=0.004) than models with clinicopathologic factors.
Conclusion
Changes in metabolic parameters, especially those in SUVmax by > 50%, can help improve survival outcome predictions for patients with cervical cancer treated with definitive RT.
Introduction
18F-fluorodeoxyglucose–positron emission tomography (FDG-PET) imaging plays a key role in determining disease stages at diagnosis in patients with cervical cancer. With the revised Fédération Internationale de Gynécologie et d’Obstétrique staging, precise evaluation of lymph nodes and distant metastasis with FDG-PET has become important. In addition to its use for diagnostic purposes, FDG-PET can be used for prognoses prediction and radiation therapy (RT) planning [1]. However, magnetic resonance imaging (MRI) is most frequently used for image-guided brachytherapy (IGBT) in clinical practice. We have previously reported the feasibility of PET-based IGBT [2,3]. Biological information on FDG-PET could help visualize metabolic active region that could complement the poor contrast resolution of computed tomography (CT)–guided IGBT. The traditional response criteria—response evaluation criteria in solid tumors—is often limited due to cystic or necrotic changes of tumors, obscured margins, and post-inflammatory changes in the cervix [4]. In this context, tumor metabolic response assessed using FDG-PET can be valuable for treatment response evaluations [1,5].
Several studies have also suggested the potential role of FDG-PET in the early detection of treatment response during RT in other solid tumor [6–9]. Herein, we aimed to determine the predictive value of metabolic parameters obtained using pretreatment FDG-PET and IGBT planning FDG-PET.
Materials and Methods
1. Patient population
Data or medical records of patients with cervical cancer who received definitive RT with PET-based IGBT between 2009 and 2018 were retrospectively reviewed. Patients were excluded if the baseline PET (PETbase) was performed at another institution or not available (n=48), if planning data for IGBT was not available (n=42), and if follow-up details were missing (n=6). After implementing the inclusion and exclusion criteria, data on 116 patients were analyzed (S1 Fig.). This study was approved by the institutional review board (SMC. 2020-10-052), which waived the need for informed consent due to the retrospective nature of the study. All patients underwent complete clinical staging, including physical examination, abdominopelvic CT, pelvic MRI, and FDG-PET.
2. Treatment
All patients were treated with external beam RT (EBRT) using three-dimensional conformal RT and high-dose-rate IGBT. Eighty-seven patients (75.0%) were treated with whole pelvic EBRT with an upper field border of the L4-L5 interspace. For 28 patients with retroperitoneal lymph node involvement at diagnosis, extended-field EBRT was delivered with an upper field border of the T12-L1 interspace. After administering 45 Gy in 25 fractions, a parametrial boost of 5.4 Gy was performed using a midline block with 4-cm central shielding. The median total dose of EBRT was 50.4 Gy (interquartile range [IQR], 50.4 to 50.4). PET-based IGBT with an Iridium-192 source started with a parametrial boost with a total dose of 24 Gy in six fractions. The median overall treatment time and the interval between EBRT and IGBT were 51 days (IQR, 49.0 to 54.5) and 33 days (IQR, 30.0 to 39.0), respectively. The detailed procedure of PET-based IGBT has been described previously [2,3].
After the gross tumor volume was delineated based on IGBT planning FDG-PET (PETIGBT), high-risk clinical target volume (HRCTV) was defined according to the GEC-ESTRO guidelines [10]. Briefly, the HRCTV included the gross tumor volume with a 1-cm margin, clinically suspected lesion, and entire cervix. Planning for EBRT and PET-based IGBT was calculated using the Pinnacle (V6.5, Philips, Madison, WI) and PLATO (V14.3, Nucletron, Veenendaal, Netherlands), respectively. From CT and FDG-PET/CT obtained during planning, we could retrospectively calculate a dose of 90% HRCTV (D90). The biologically equivalent dose in 2 Gy fractions (EQD2) at D90 HRCTV were calculated using EBRT and IGBT.
Concurrent chemotherapy was administered to 108 patients (93.1%) as follows: cisplatin 40 mg/m2 weekly (n=77, 66.4%) or cisplatin 60 mg/m2 (day 1) and 5-fluorouracil 1,000 mg/m2/day (days 1–5) every 3 weeks (n=31, 26.7%).
3. 18F-FDG-PET/CT
Both PETbase and PETIGBT were obtained 45 minutes after injecting FDG (370 MBq) using a Discovery Ste scanner (GE Healthcare, Milwaukee, WI). Prior to each scan, patients fasted for 6 hours before FDG administration with a glucose level of < 200 mg/dL. After a tracer uptake time of 45 minutes, a low-dose, non-contrast, whole-body CT was performed using a continuous spiral technique with a 16-slice helical CT (140 keV, 30–170 mAs with an AutomA mode, section width of 3.75 mm). PET images with a voxel size of 4.29×4.29×4.25 mm were reconstructed using an iterative ordered-subsets expectation-maximization algorithm (28 subsets, two iterations).
4. PET metrics
All primary cervical tumors, defined as the region of interest, were delineated on PETbase and PETIGBT consistently by a single radiation oncologist (N.K.) with the PET Edge algorithm in MIM software (Mim Software Inc., Cleveland, OH), which sets the contour boundary at the location where the signal gradient is the highest. Images of each cervical tumor were evaluated semi-quantitatively by measuring and calculating the maximum activity concentration in the tumor (SUVmax) and mean concentration of FDG in the tumor (SUVmean) normalized to patient body weight. The average SUV plus two standardized deviations of the metabolic tumor volume (MTV) was calculated from the sum of the areas with two-dimensional tumor contours by multiplying the corresponding slice thickness. Total lesion glycolysis (TLG) was calculated by multiplying the SUVmean with the MTV. The relative change in each parameter between PETbase and PETIGBT was calculated using the following equation:
5. Follow-up
After the completion of the planned treatment, all patients were followed up for 1 month after treatment, every 3 months during the first 2 years, and every 6–12 months thereafter. Local failure was defined as progressive disease at the cervix, vagina, or parametrium based on either radiological evaluation or histological confirmation. Regional and distant failures were defined as regional lymph node recurrence within the RT field and metastases to lymph nodes or other organs outside the RT field, respectively.
6. Statistical analysis
Disease-free survival (DFS) and overall survival (OS) were the primary study endpoints. DFS and OS rates were measured from the date of RT commencement to the date of any failure or death from any cause. Survival curves were estimated using the Kaplan-Meier method and compared using the log-rank test. Since there was a significant variation in the optimal cutoff value for PET parameters, receiver operating characteristics curve analyses for DFS were performed to identify the cutoff thresholds for parameters (S2 Fig.). Multivariable analysis was performed using the Cox proportional hazards model with variables that were significant in univariable analysis. In addition, Delong’s test was performed to compare the predictive value of the final selected model for DFS and OS. Differences between metabolic responders and non-responders were compared using Pearson’s chi-square test for categorical variables and the Mann-Whitney U test for continuous variables. All statistical analyses were performed using R (ver. 3.6.4, R Foundation for Statistical Computing, Vienna, Austria). A p-value of < 0.05 was considered statistically significant.
Results
1. Patients
With a median age of 55 years (IQR, 48 to 64), most patients (n=99, 85.3%) were diagnosed with squamous cell carcinoma (Table 1). The median tumor size was 5.1 cm (IQR, 4.0 to 6.3), and more than half of the patients (n=86, 74.1%) had a tumor measuring > 4 cm; 31 patients (26.7%) had tumors measuring > 6 cm. According to the 2018 revised staging, 89 patients (76.7%) were diagnosed with stage III–IV disease. The median total EQD2 to D90 HRCTV was 77.9 Gy (IQR, 75.5 to 81.2).

Baseline characteristics
2. PET metrics
The median SUVmax, SUVmean, MTV, and TLG of PETbase were 13.4 (IQR, 10.4 to 17.6), 6.4 (IQR, 5.1 to 8.5), 40.4 mL (IQR, 18.9 to 64.7), and 264.9 (IQR, 110.0 to 544.6), respectively (Table 1, Fig. 1). Except for three patients who showed an increased SUVmax, all parameters generally decreased on PETIGBT: the median ΔSUVmax, ΔSUVmean, ΔMTV, and ΔTLG were 65.4% (IQR, 50.3 to 73.0), 60.5% (IQR, 48.1 to 66.9), 78.3% (IQR, 64.5 to 88.5), and 92.9% (IQR, 84.2 to 96.0), respectively. In addition to each cutoff value for PET parameters of PETbase and PETIGBT, a threshold of 50%, 60%, 85%, and 95% was calculated as the optimal cutoff value for ΔSUVmax (area under curve [AUC], 0.702), ΔSUVmean (AUC, 0.711), ΔMTV (AUC, 0.568), and ΔTLG (AUC, 0.621), respectively (S3 Fig.).
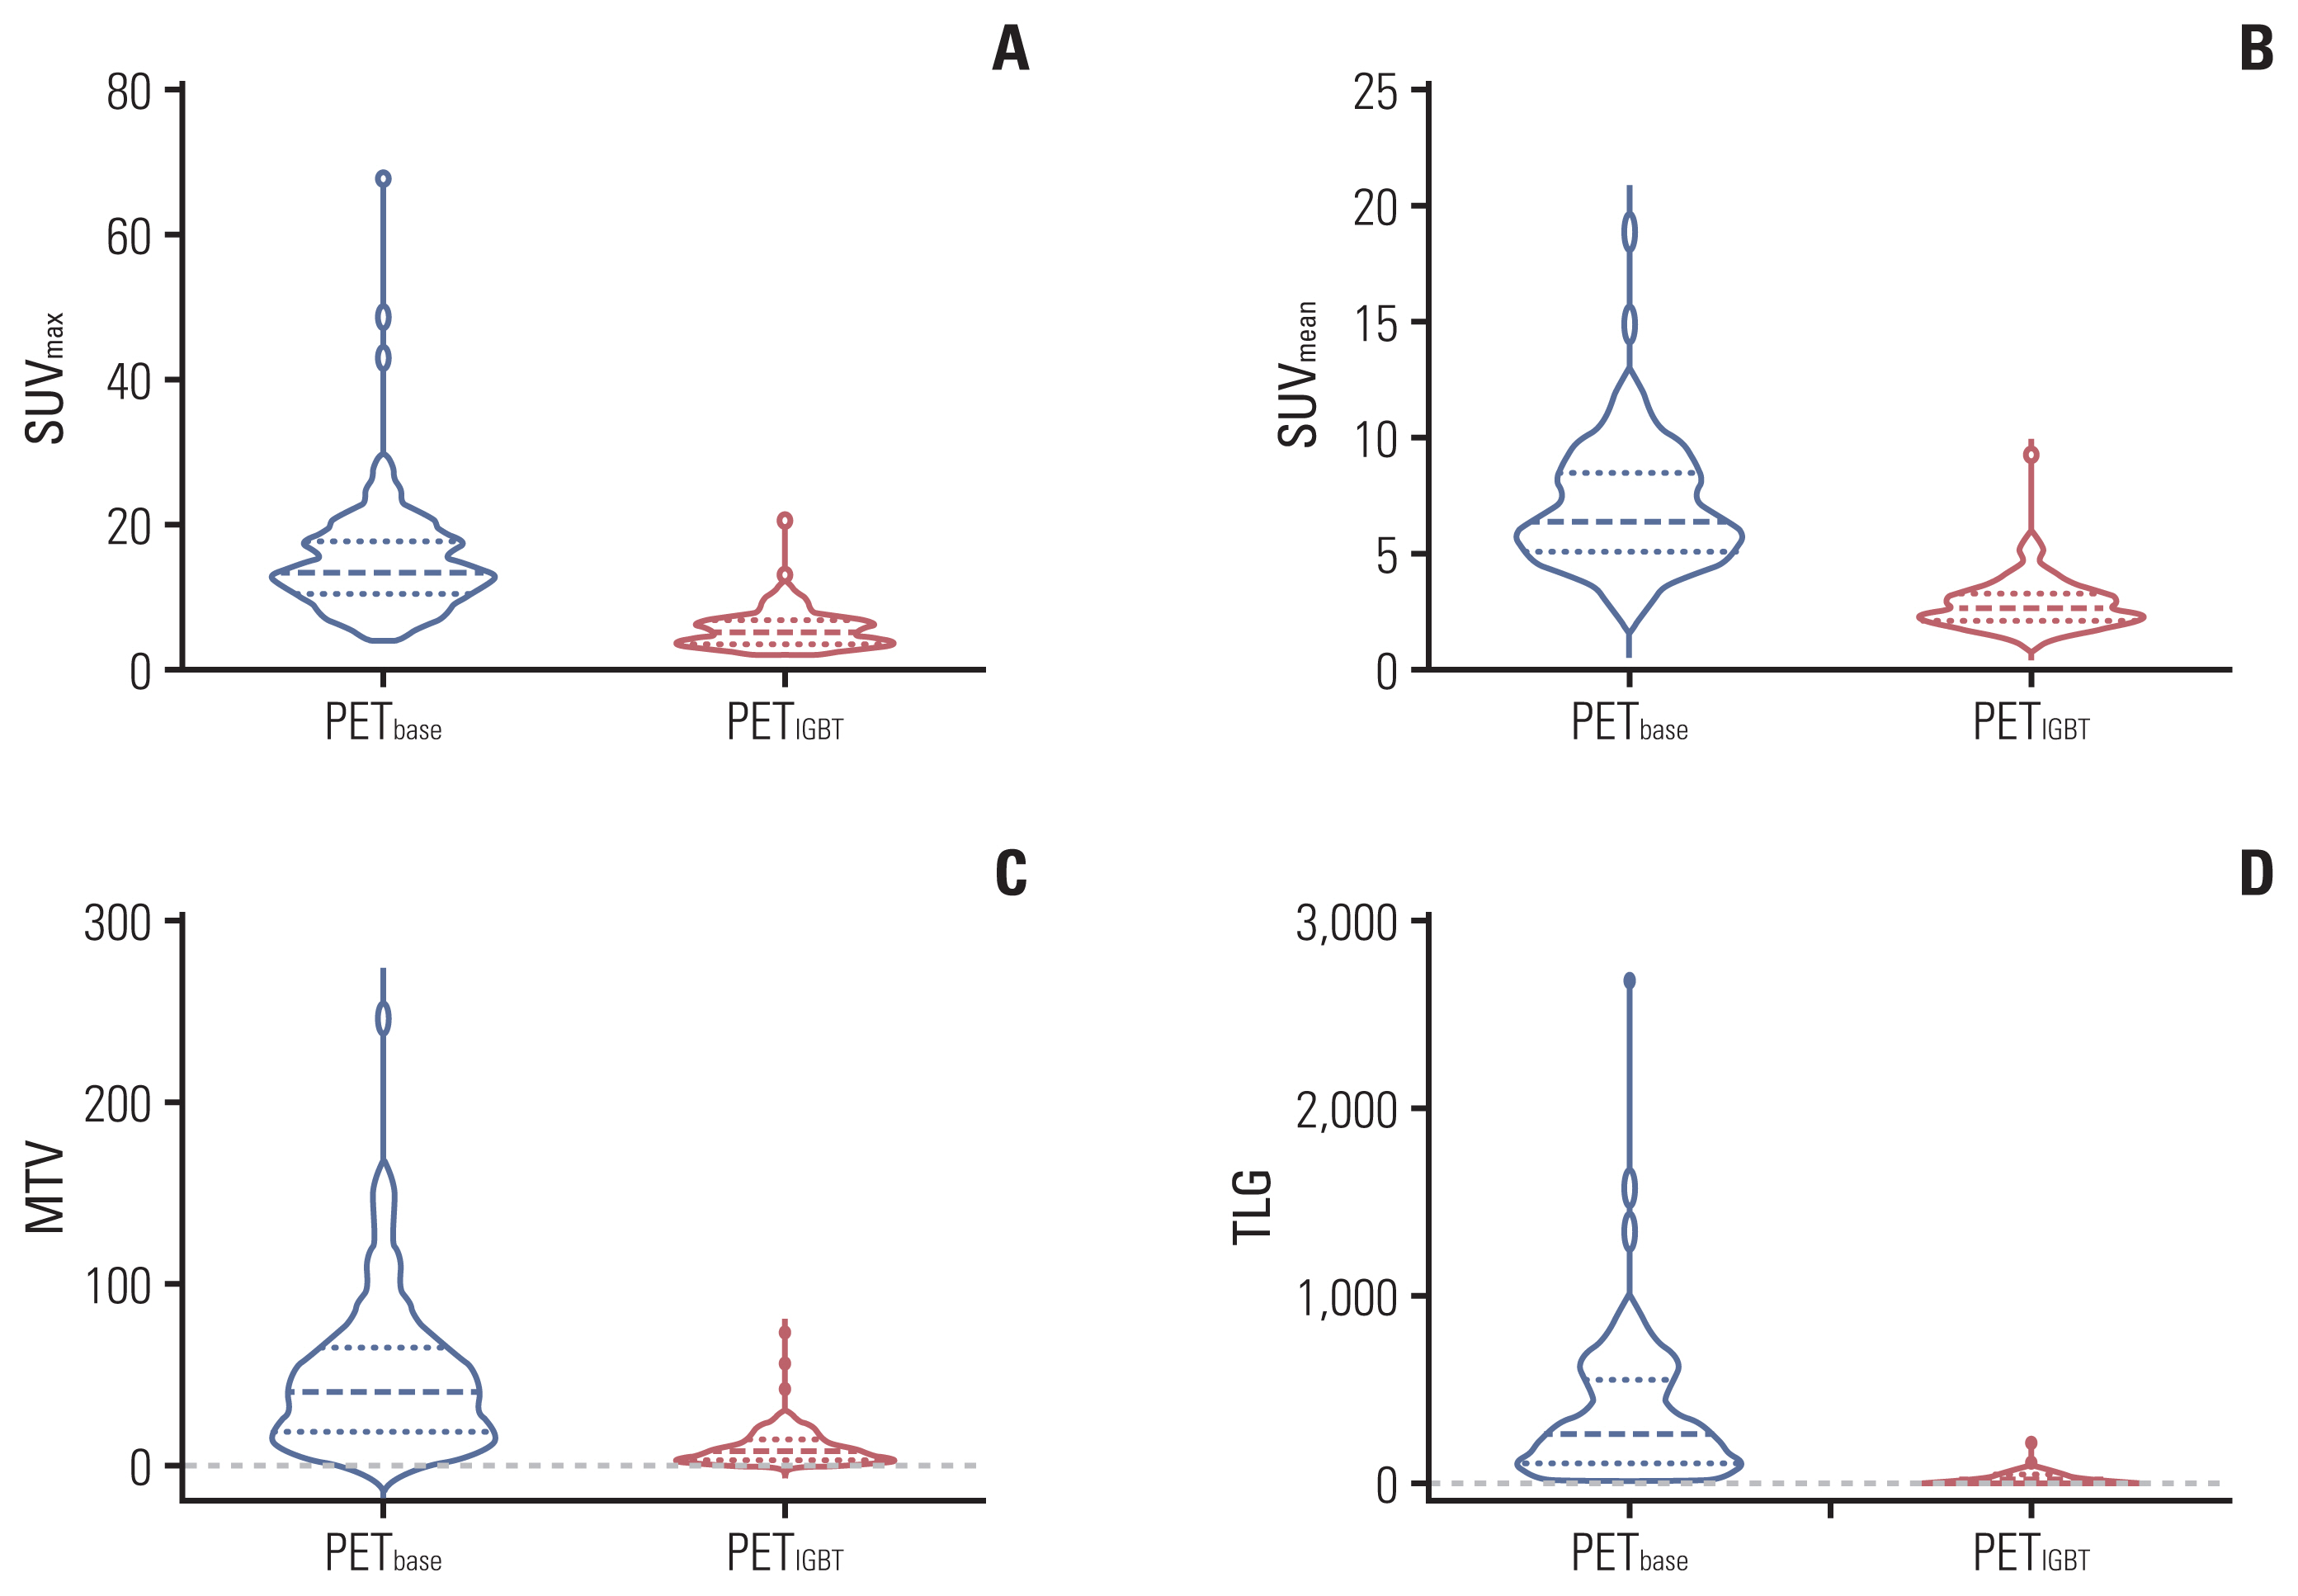
Metabolic parameters of the primary tumor in PETbase and PETIGBT: SUVmax (A), SUVmean (B), MTV (C), and TLG (D). FDG-PET/CT, 18F-fluorodeoxyglucose positron emission tomography/computed tomography; MTV, metabolic tumor volume; PETbase, baseline FDG-PET/CT; PETIGBT, image-guided brachytherapy planning FDG-PET/CT; SUVmax, maximum standardized uptake value; SUVmean, mean standardized uptake value; TLG, total lesion glycolysis.
3. Treatment outcomes
During the median follow-up of 59.5 months (IQR, 24.3 to 87.0), the 5-year DFS and OS rates for the entire cohort were 66.4% and 78.5%, respectively (Fig. 2). Twenty-two and 31 patients experienced locoregional and distant failures, respectively. After adjusting for multiple clinical and PET parameters, ΔSUVmax < 50% was significantly associated with inferior DFS (hazard ratio [HR], 2.56; 95% confidence interval [CI], 1.14 to 5.77; p=0.023) and OS (HR, 5.14; 95% CI, 1.55 to 17.01; p=0.007) (Table 2). In addition, the adenocarcinoma component remained significant prognostic factor in the multivariable analysis for DFS (HR, 2.98; 95% CI, 1.38 to 6.48; p=0.006) and OS (HR, 2.65; 95% CI, 1.14 to 6.16; p=0.024).
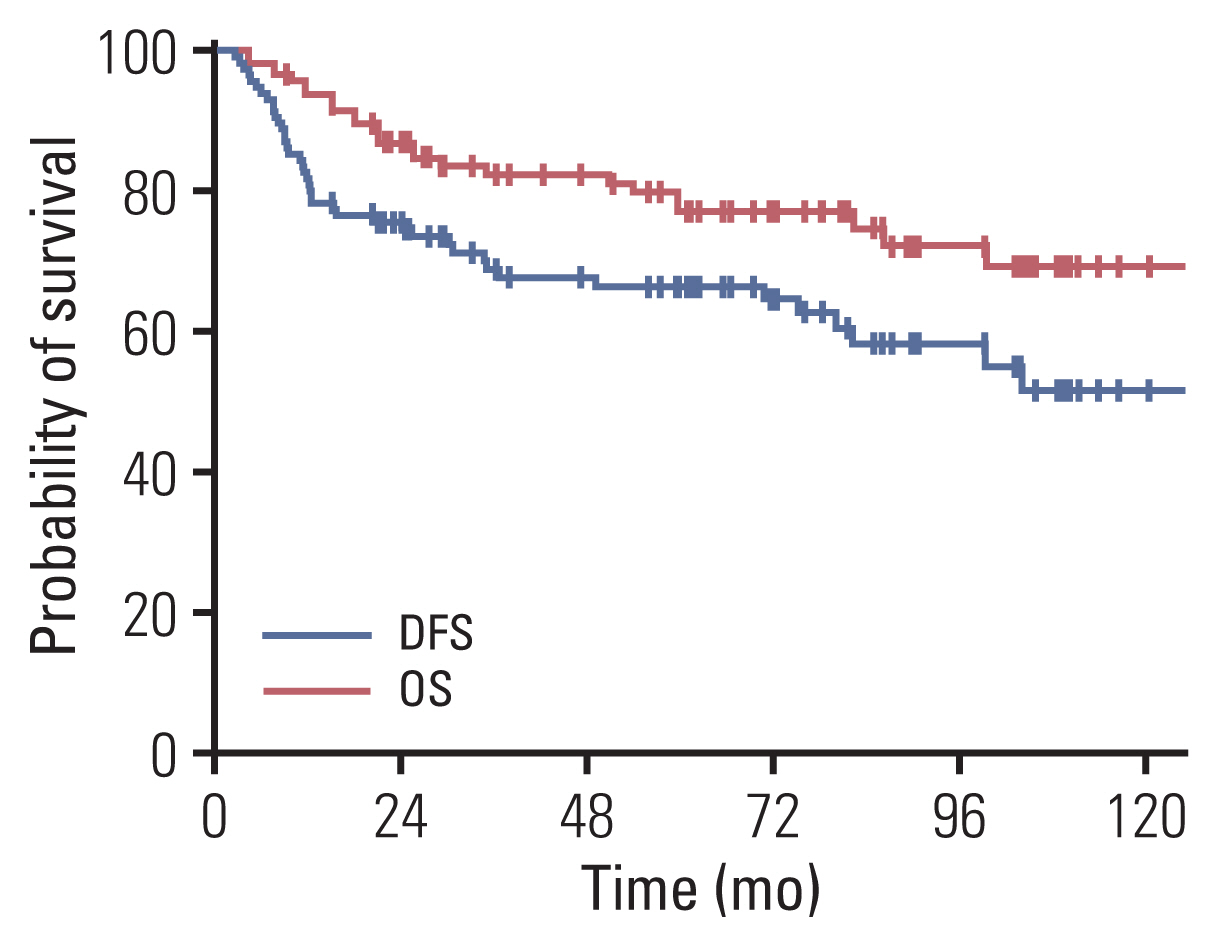
Kaplan-Meier curves of disease-free survival (DFS) and overall survival (OS) outcomes for all patients.
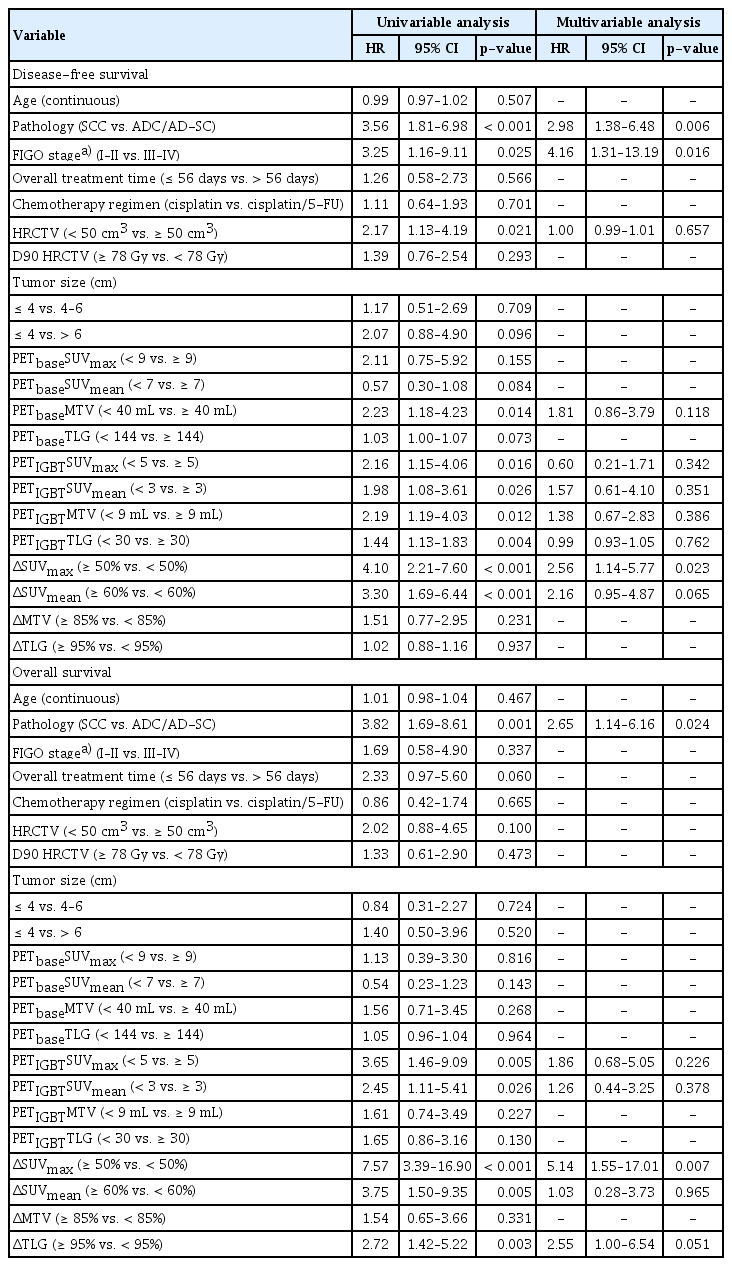
Prognostic factors for disease-free survival and overall survival
The 5-year DFS rates of 87 patients with ΔSUVmax ≥ 50% and 29 patients with ΔSUVmax < 50% were 76.0% and 35.2%, respectively (p < 0.001) (Fig. 3A). The corresponding 5-year OS rates were 89.7% and 40.7%, respectively (p < 0.001) (Fig. 3B). In the subgroup analysis based on an ΔSUVmax of 50%, more patients with ΔSUVmax < 50% presented with adenocarcinoma or adenosquamous carcinoma compared to those with ΔSUVmax ≥ 50% (27.6% vs. 10.3%, p=0.003) (Table 3). Patients with ΔSUVmax ≥ 50% had higher PETbase SUVmax (p < 0.001) (Fig. 4A), SUVmean (p < 0.001) (Fig. 4B), MTV (p=0.048) (Fig. 4C), and TLG (p=0.003) (Fig. 4D) than those with ΔSUVmax < 50%. The SUVmax (p < 0.001) (Fig. 4A) and SUVmean (p < 0.001) (Fig. 4B) were significantly lower in patients with ΔSUVmax ≥ 50% than in those with ΔSUVmax < 50% (Table 3). In addition to SUVmax, relative changes in SUVmean, MTV, and TLG of patients with ΔSUVmax ≥ 50% were larger than those of patients with ΔSUVmax < 50% (Table 3).
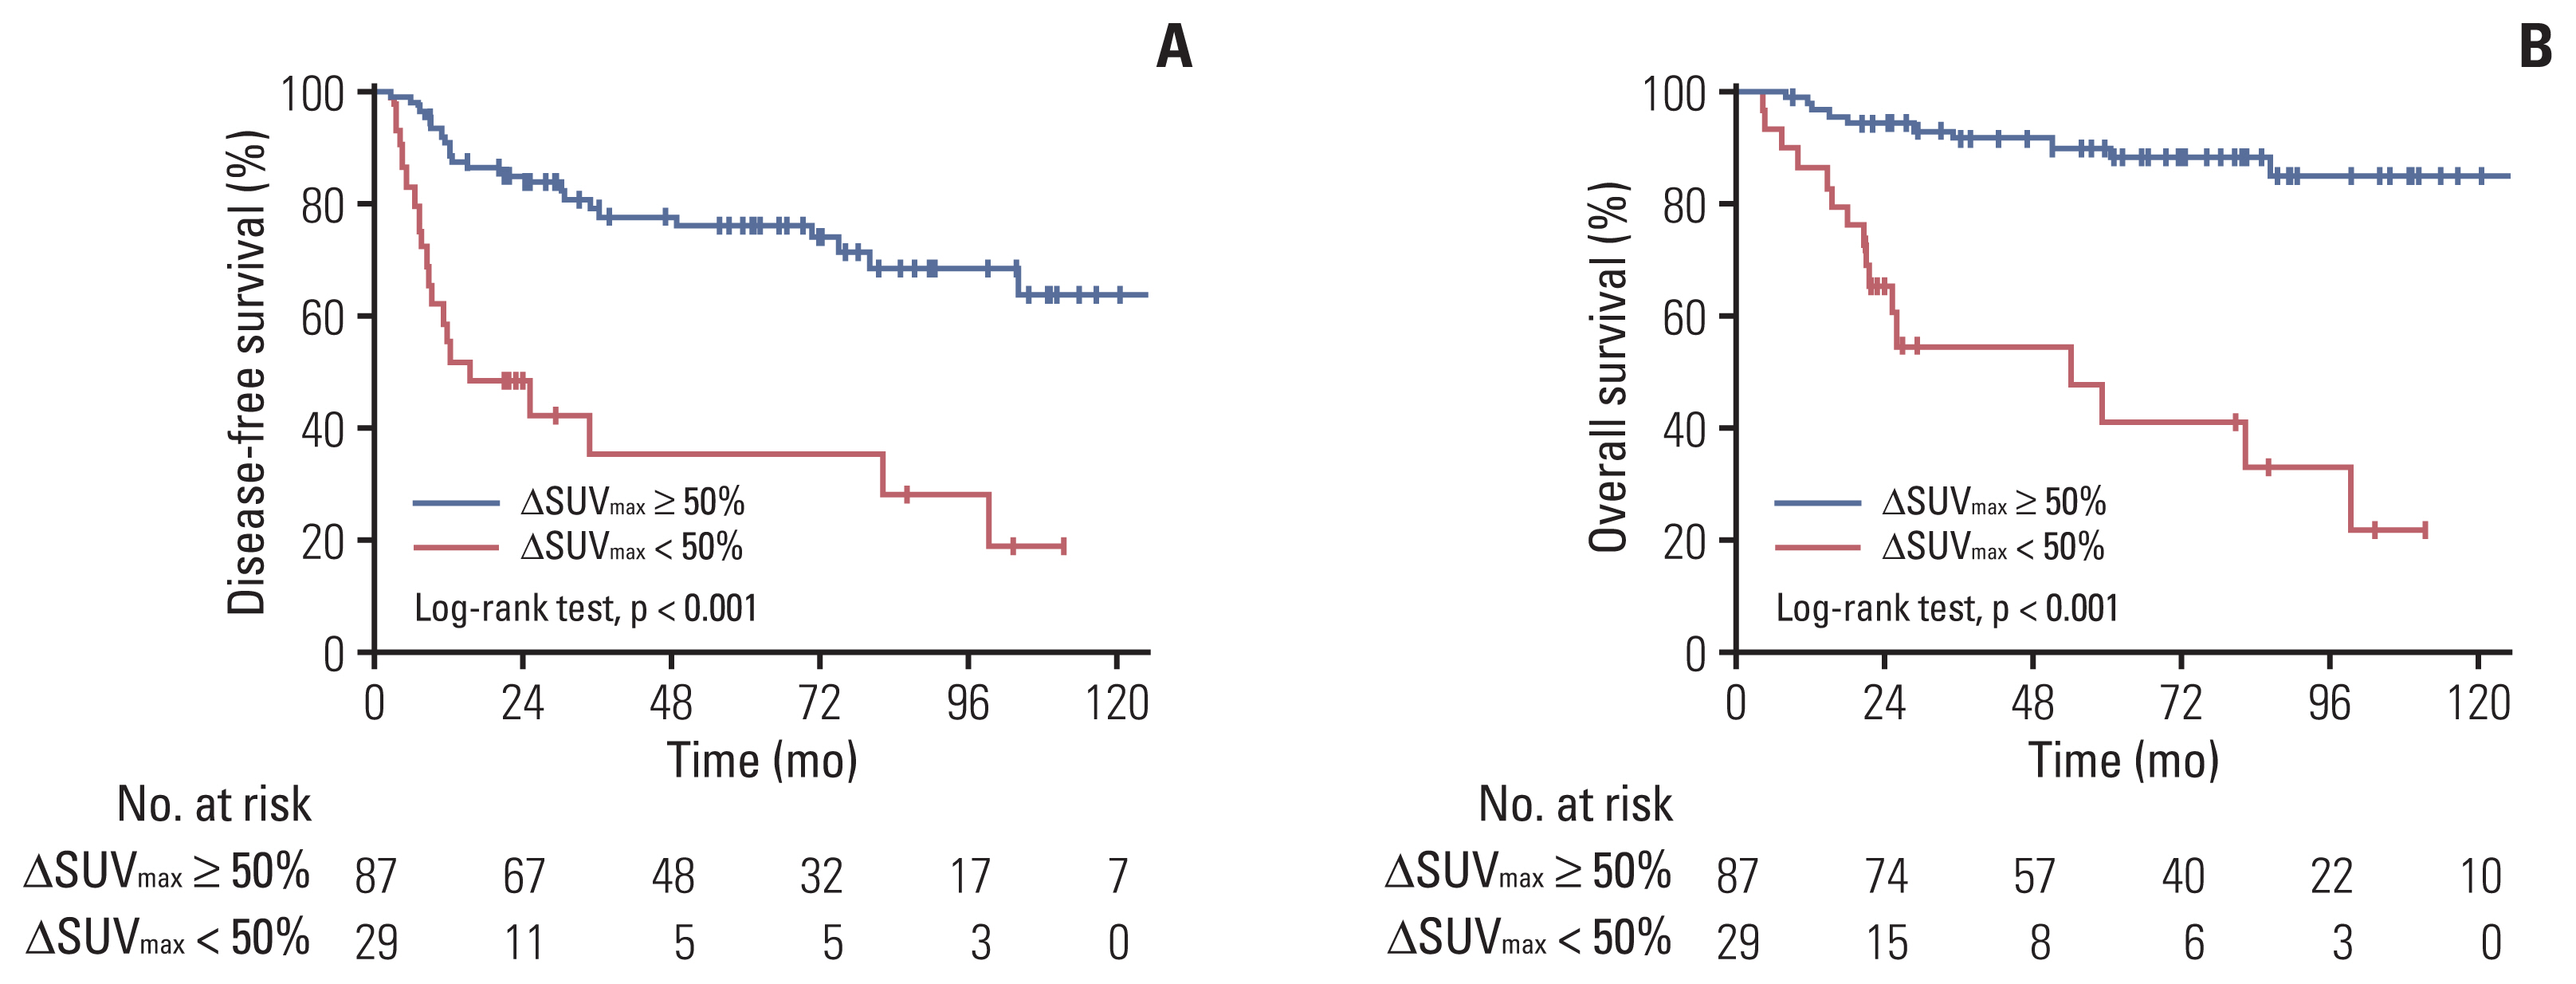
Clinical outcomes according to the reduction in maximum standardized uptake value (SUVmax): disease-free survival (A) and overall survival (B).

Patient and tumor characteristics according to metabolic response
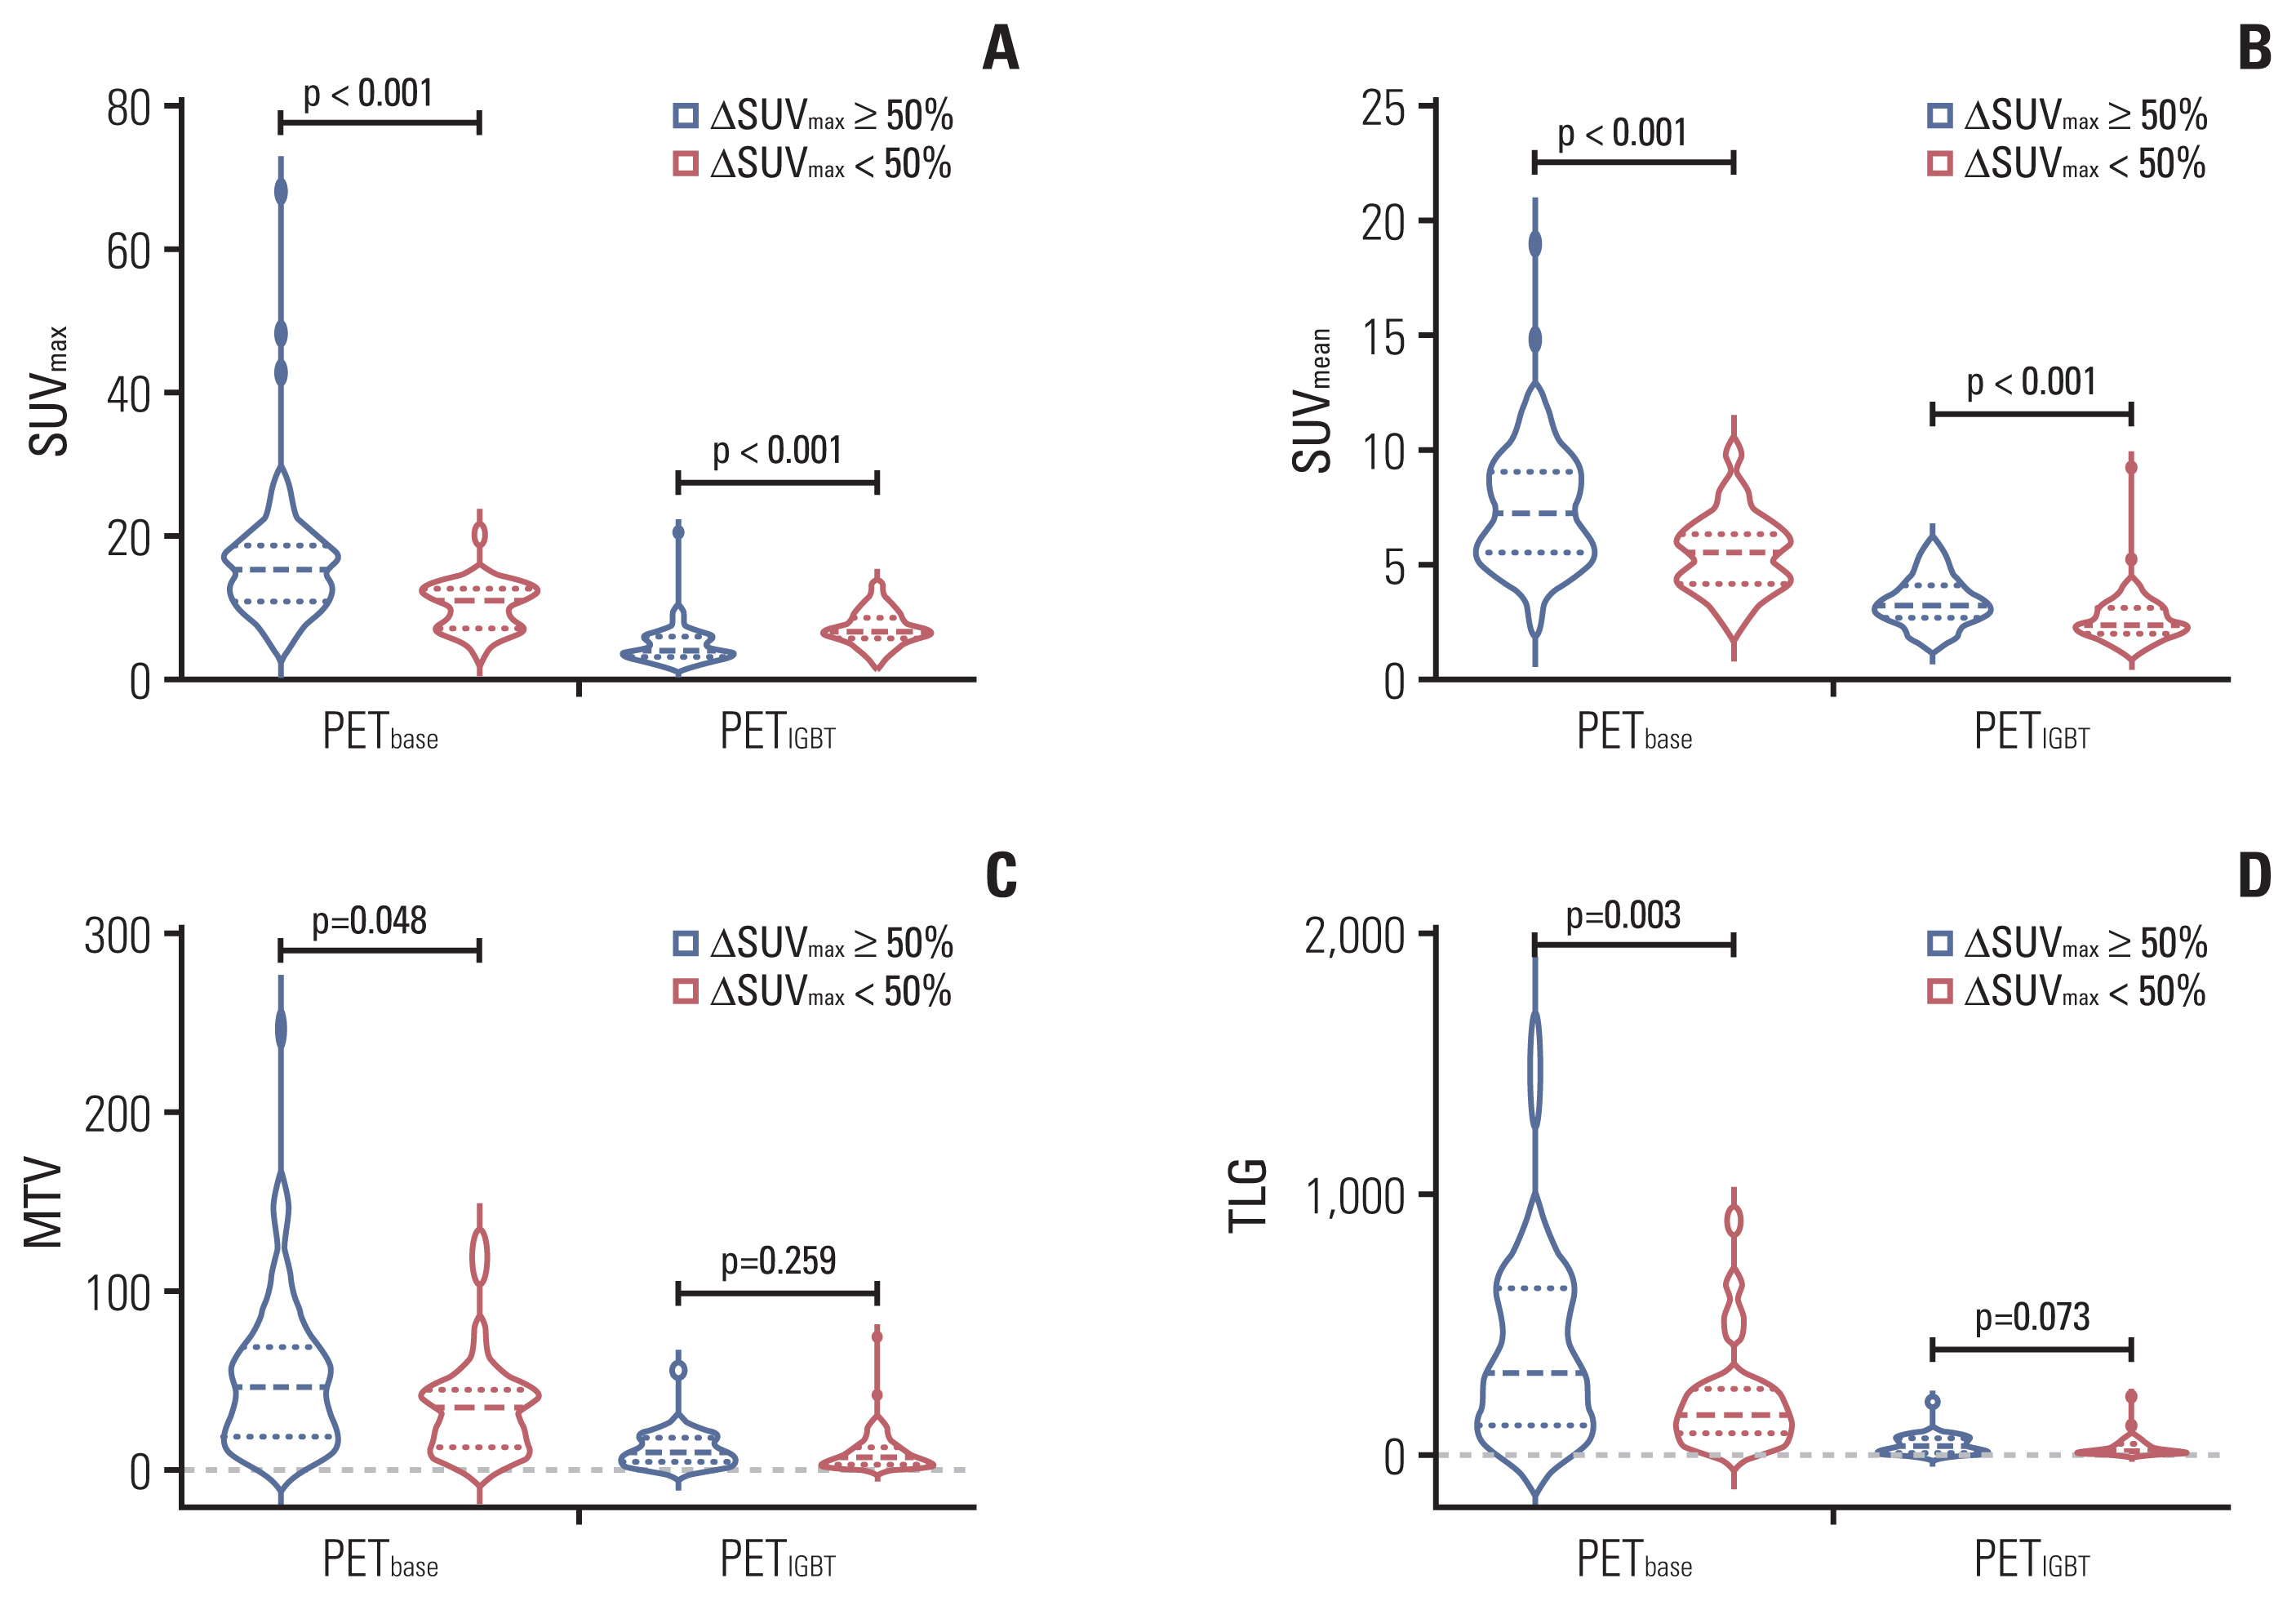
Metabolic parameters of primary tumor in PETbase and PETIGBT according to ΔSUVmax of 50%: SUVmax (A), SUVmean (B), MTV (C), and TLG (D). FDG-PET/CT, 18F-fluorodeoxyglucose positron emission tomography/computed tomography; MTV, metabolic tumor volume; PETbase, baseline FDG-PET/CT; PETIGBT, image-guided brachytherapy planning FDG-PET/CT; SUVmax, maximum standardized uptake value; SUVmean, mean standardized uptake value; TLG, total lesion glycolysis.
We observed a statistically significant improvement in predicting DFS when incorporating PET parameters (AUC, 0.755 vs. 0.690; p=0.012) (S4A Fig.) compared with the prediction model of clinicopathologic factors. The prediction model with PET parameters showed improved performance for OS (AUC, 0.782 vs. 0.629; p=0.004) (S4B Fig.).
Discussion
We found that the early metabolic response of relative changes in PET parameters, especially an ΔSUVmax of 50%, can be deemed an important predictive factor for patients treated with definitive RT. Metabolic parameters are better than clinicopathologic factors for predicting survival outcomes.
Several previous studies have been investigated using a limited number of patients with cervical cancer treated with RT [11–15]. Kidd et al. [11] observed a time-dependent change during and after RT and found a correlation between MTV or SUVmax at week 4 and treatment response. Visual assessment based on residual FDG uptake in the primary tumor also showed its diagnostic ability in predicting outcomes [12,13,15]. A recent study by Leseur et al. [14] suggested different cutoff values of MTV and TLG for PETbase and PETIGBT. In agreement with the findings of previous reports, our findings showed a time-dependent change in the metabolic parameters. Moreover, we could suggest clinically useful cutoff criteria based on the dynamics of these metabolic parameters. In addition, we found that incorporating PET parameters, such as an ΔSUVmax of 50%, into well-known prognostic factors, can potentially lead to a more accurate prediction of treatment outcomes.
The degree of PET avidity in the primary tumor or lymph node has been deemed as a predictive biomarker in cervical cancer [1,16–19]. A recent study using a deep learning model for PETbase in 142 patients suggested the feasibility of PETbase in predicting outcomes in cervical cancer [16]. In addition, Kidd et al. [17] reported that the SUVmax of the primary tumor might be an independent and important predictor of tumor aggressiveness, treatment response, and OS based on the PETbase findings of 287 patients. They also demonstrated that PET-avid nodes can stratify patients into distinct groups, and the SUVmax of the lymph node itself could be a predictive marker for recurrence, DFS, and OS [18,19]. However, PETbase parameters were higher in metabolic responders (ΔSUVmax ≥ 50%) than in non-responders (ΔSUVmax < 50%) in our study (all p < 0.05). Therefore, we could postulate that relative changes in PET parameters are more feasible in predicting outcomes than pretreatment parameters. Further investigation using deep learning that incorporates PETbase and PETIGBT can provide a more robust prediction model.
Advances in imaging analysis have facilitated ways to integrate MRI in treatment prediction [20–23]. A recent multicenter study of 275 patients demonstrated that radiomic features in MRI could potentially identify patients expected to have a favorable response before neoadjuvant chemotherapy [22]. Additionally, Wormald et al. [23] analyzed 378 patients with stage I–II disease and reported that combining textural into clinical factors can improve recurrence predictions. Furthermore, Lucia et al. [24,25] developed a multiparametric radiomics model using PETbase and MRI and demonstrated its power in predicting recurrence or local control after external validation. However, a radiomics model is not routinely available in clinical practice. Therefore, the assessment of relative changes in metabolic parameters based on PETIGBT could be more clinically accessible and cost-effective. Additionally, both volumetric assessment and tumor marker (i.e., squamous cell carcinoma antigen) are suggested as predictors for treatment outcomes, there remains the issue of interobserver variability in tumor delineation, under-or over-estimated tumor volume assessment, and optimal cutoff values for tumor markers [26]. In this context, metabolic parameters of ΔSUVmax < 50% reduce interobserver variability and could provide an additional information reflecting tumor biology.
In the current study, a consistent adverse prognostic impact of adenocarcinoma histology was observed in multivariable analysis, including metabolic parameters. In addition, adeno/adenosquamous carcinoma was more frequently observed in patients with ΔSUVmax < 50%. The impact of adeno/adenosquamous carcinoma on outcomes has been noted in several studies [27,28]. However, a revised classification of adenocarcinoma histology has provoked a new issue due to its heterogeneity [29]. We found that several patients with adenocarcinoma showed a favorable metabolic response, but some patients did not, resulting in different outcomes among patients with adeno/adenosquamous carcinoma. Due to its rarity, the number of patients with adeno/adenosquamous carcinoma was limited in previous mid-RT PET studies and in the current study (17 patients) [3,11–14]. Therefore, further subgroup analysis of metabolic parameters based on subtypes of adenocarcinoma could not be conducted. Further analyses incorporating new classification of adenocarcinoma histology and metabolic parameters can further our understanding of heterogeneity of this pathology type.
Detection of early response appears to be a predictor of the likelihood of treatment failure, which makes it easier to stratify poor responders with current treatment strategies. Further intensification with adjuvant chemotherapy as the OUTBACK trial (clinicaltrials.gov, NCT 01414608), RT dose escalation as in non-small cell lung cancer (NCT 01507428), or early administration of immune-checkpoint blockade (NCT 02760225, NCT 03829007, and NCT 03853187) can be beneficial for these patients. Further investigations are needed to determine whether early salvage surgery can be effective in metabolic non-responders with cervical cancer who are expected to respond in the late phase or have early progression.
There are several limitations in the current study. First, the results should be interpreted with caution since this is a retrospective analysis without external validation. Since the cutoff values were derived using Youden’s index in the current study, different optimal thresholds can be calculated in further studies with a larger sample size. However, our analysis was strengthened because of using consistent and modern FDG-PET/CT and practically applicable PET-based IGBT. Additionally, the criteria for relative changes in metabolic parameters can be easily accessible in further clinical implementation. Possible inflammatory changes during RT might mimic changes in tumor metabolism [30]. However, previous studies have proved that PET at week 4 can be reliable in predicting treatment outcomes [11], which is consistent with the current study findings.
To the best of our knowledge, the current study is the largest analysis to incorporate metabolic parameters of PETbase and PETIGBT. We expect that the current criteria based on the dynamics of metabolic parameters will help develop personalized treatment plans for patients with cervical cancer during RT.
Electronic Supplementary Material
Supplementary materials are available at Cancer Research and Treatment website (https://www.e-crt.org).
Notes
Ethical Statement
This study was approved by the institutional review board (SMC. 2020-10-052), which waived the need for informed consent due to the retrospective nature of the study.
Author Contributions
Conceived and designed the analysis: Kim N, Park W, Cho WK, Cho YS.
Collected the data: Kim N, Cho WK.
Contributed data or analysis tools: Kim N, Park W, Cho WK, Bae DS, Kim BG, Lee JW, Kim TJ, Choi CH, Lee YY, Cho YS.
Performed the analysis: Kim N, Park W.
Wrote the paper: Kim N, Park W, Cho YS.
Review the paper: Park W, Cho WK, Bae DS, Kim BG, Lee JW, Kim TJ, Choi CH, Lee YY, Cho YS.
Conflicts of Interest
Conflict of interest relevant to this article was not reported.