Evaluation of the American Joint Committee on Cancer (AJCC) 8th Edition Staging System for Hepatocellular Carcinoma in 1,008 Patients with Curative Resection
Article information
Abstract
Purpose
Recently, the 8th edition staging system of the American Joint Committee on Cancer (AJCC) for hepatocellular carcinoma (HCC) was released, including a change in T category. We aimed to validate the new AJCC system.
Materials and Methods
The predictive value of the new AJCC was validated in comparison to the previous edition, in a total 1,008 patients who underwent curative resection for HCC as initial treatment.
Results
The 2-year area under the curve values for recurrence-free survival (RFS) and overall survival (OS) were comparable in the 7th and 8th editions. Stage migration was observed in 63 patients (6.3%); from T2 to T1a for 44 patients and from T3 to T4 for 19 patients. The RFS and OS were not different between T1a and T1b in the 8th edition. For solitary tumors ≤ 2 cm, those with microvascular invasion had lower RFS and OS values than those without although they were all classified as T1a in the 8th edition. Tumors involving a major branch of the portal or hepatic vein (T4 by the 8th edition and T3b by the 7th edition) had shorter RFS and OS than multifocal tumors, at least one of which was > 5 cm (T3 by the 8th edition and T3a by the 7th edition).
Conclusion
The AJCC 8th edition staging system for HCC showed comparable predictive performance to the 7th edition. It is desirable in a future revision to consider sub-stratification of solitary tumors ≤ 2 cm (T1a) depending on the presence of vascular invasion, which is not included in the 8th edition.
Introduction
Hepatocellular carcinoma (HCC) comprises 75%-85% of primary liver cancer, which is the sixth most commonly diagnosed cancer and the fourth leading cause of cancer death worldwide [1].
Although hepatic resection is the treatment of choice in HCC, it is not curative because of the high recurrence rate of up to 70% [2]. Therefore, prediction of recurrence and appropriate treatment are important for improved patient outcomes [3].
Among multiple staging systems proposed for stratifying patients with HCC, the American Joint Committee on Cancer (AJCC) staging system for HCC is one of the most commonly used, and the 7th edition of the AJCC system has been validated by various external studies in terms of usefulness and clinical relevance [4-6].
As of January 1, 2018, AJCC 8th edition staging has been used for cancer staging, and there were some notable changes in the T category of HCC compared to the previous version [7,8]. First, solitary tumors with size up to 2 cm are now staged as T1a regardless of the presence of microvascular invasion, unlike in the previous 7th edition, where the presence of microvascular invasion determined whether the tumor is T1 or T2 based on size 2 cm or less. Second, categories named T3b and T4 in the 7th edition are merged into a single T4 category in the new edition and T3a of the 7th edition is renamed as T3 in the 8th edition.
In this study, we validated the predictive value of the new AJCC 8th staging system in comparison to the previous 7th edition in a single-institution study population of 1,008 cases. We also attempted to determine how the change in T category predicts prognosis in this population.
Materials and Methods
1. Study patients
Between January 2008 and December 2012, a total of 1,297 patients underwent hepatic resection for HCC at Samsung Medical Center. Initially, 166 liver transplantation (LT) cases were excluded from the study; among the 1,131 non-LT cases, 89 were excluded because they were treated with other modalities before surgery. Other treatment modalities included transarterial chemoembolization, radiofrequency ablation (RFA) and chemotherapy. Two patients were additionally excluded due to previous operative history and intraoperative RFA, respectively. Among the remaining 1,040 patients who underwent hepatic resection as the initial curative treatment for HCC, an additional 32 patients were excluded as follows: five patients died within 30 days after hepatic resection, three patients showed positive resection margins on pathologic examination, and 24 patients had lymph node metastasis or distant metastasis. Finally, 1,008 cases that were appropriate for tumor staging for HCC were considered in retrospective analysis. The process of case selection is summarized in Fig. 1.

Summary of patient selection. HCC, hepatocellular carcinoma; TACE, transarterial chemoembolization; RFA, radiofrequency ablation.
2. Clinicopathologic data acquisition and tumor staging
The medical records of patients meeting all inclusion criteria were reviewed for demographic information of sex, age, and clinically underlying etiology of chronic liver disease, if present. The histopathologic features of HCC are collected by reviewing the pathology reports as follow: tumor number, maximal tumor size, differentiation, microvascular invasion, and major branch of portal vein invasion, and the T category was determined using the 7th and 8th editions of the AJCC staging system [7,8]. Presence of chronic hepatitis and fibrosis stage in the background liver parenchyma was also evaluated. The histological differentiation of HCC was graded by the Edmondson and Steiner system, which classifies HCC into four grades from I to IV [9].
3. Surveillance for tumor recurrence and survival
After surgical resection for HCC, the patients were regularly monitored by dynamic contrast-enhanced computer tomography (CT) and/or magnetic resonance imaging (MRI) and a serum tumor marker such as α-fetoprotein every 3 to 6 months. Diagnosis of recurrence was dependent on radiologic evaluation of CT and/or MRI results. Survival data such as overall survival (OS) and recurrence-free survival (RFS) were also recorded. The durations of RFS and OS were calculated from the date of surgical resection to the date of each event or the last day of follow-up, respectively.
4. Statistical analysis
RFS and OS were estimated using the Kaplan-Meier method and compared by log-rank test. SPSS Statistics ver. 25.0 (IBM Inc., Armonk, NY) was utilized in this analysis. Analysis of the time-dependent receiver operating characteristic (ROC) curves for censored survival data was used to compare the capability of the two models to predict tumor recurrence. This analysis was executed using SAS ver. 9.4 (SAS Institute Inc., Cary, NC) and R 3.6.1 (Vienna, Austria; http://www.R-project.org/). All p-values lower than 0.05 were considered statistically significant.
5. Ethical statement
The Institutional Review Board of Samsung Medical Center approved this study and waived informed consent (IRB No. 2019-08-018).
Results
1. Patients and characteristics
The median age of 1,008 patients was 56 years (range, 20 to 83 years), 816 patients (81.0%) were male and 192 patients (19.0%) were female. The median follow-up period was 64.8 months (standard deviation, 29.7 months; range, 0.7 to 112.5 months). The characteristics of the 1,008 enrolled cases are summarized in Table 1.

Summary of clinicopathologhic characteristics of the patients
2. Stage distribution and migration
When staged by the AJCC 7th edition, the distribution of T category was as follows: T1 (n=472, 46.8%), T2 (n=477, 47.3%), T3a (n=35, 3.5%), T3b (n=19, 1.9%), and T4 (n=5, 0.5%). When the 8th edition was applied to our study population, the distribution was as follows: T1a (n=201, 19.9%), T1b (n=315, 31.3%), T2 (n=433, 43.0%), T3 (n=35, 3.5%), and T4 (n=24, 2.4%) (Table 2).
Distribution and migration of T category according to American Joint Committee on Cancer (AJCC) 7th and 8th edition staging system
Among 472 patients who were staged as T1 by the 7th edition, 157 were reclassified as T1a by the 8th edition, and 315 were reclassified as T1b. Stage migration was also observed. Among the 477 patients that were staged as T2 by the 7th edition, 44 patients migrated to T1a when staged by the 8th edition. Additionally, among 54 patients that were previously staged as T3, 19 migrated to T4 when staged by the 8th edition. In total, the T categories of 63 patients (6.3% of 1,008 patients) were scored differently by the 7th and 8th editions.
3. Prognostic effect of T category in the 7th and 8th editions
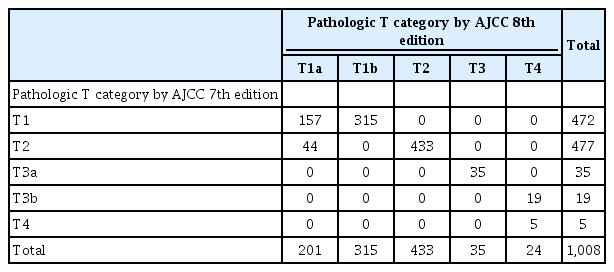
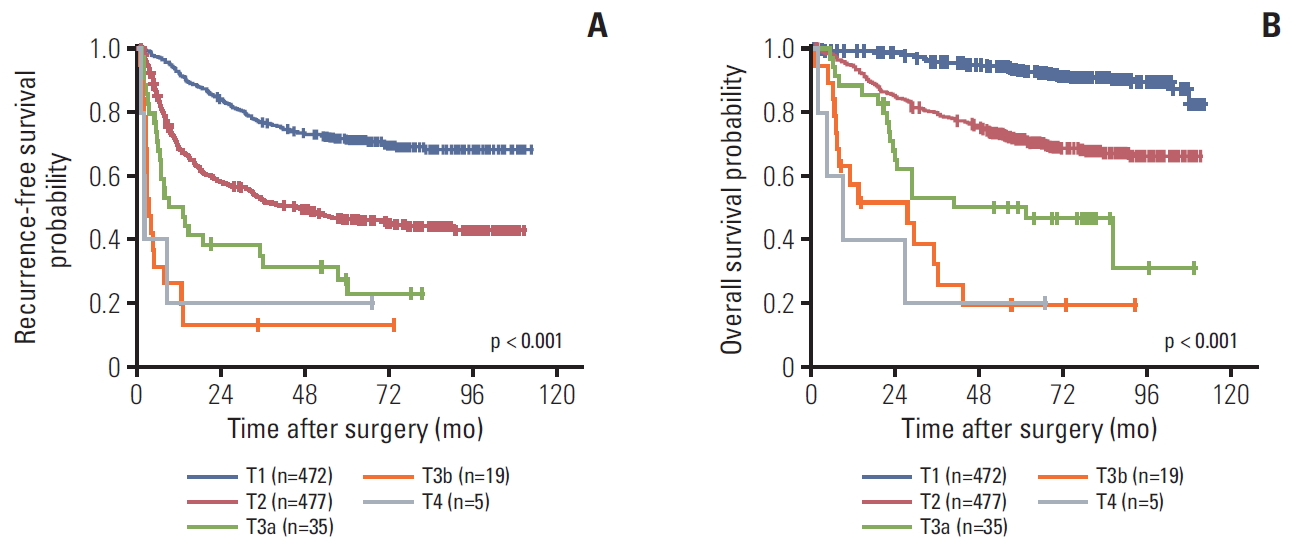
The 1-, 3-, and 5-year RFS rates were 74.7%, 55.6%, and 37.9%, respectively, while those of OS were 93.3%, 79.4%, and 58.1%. The survival curves according to the 7th and 8th editions are shown in Figs. 2 and 3. Overall, RFS and OS were different according to T category of both the 7th and 8th editions. However, they were not different between T3b and T4 with the 7th edition or between T1a and T1b in the 8th edition.
Kaplan-Meir survival curves according to the American Joint Committee on Cancer T category of the 7th edition: recurrence-free survival (A) and overall survival (B).
Kaplan-Meir survival curves according to the American Joint Committee on Cancer T category of the 8th edition: recurrence-free survival (A) and overall survival (B).
According to the survival curves by the 7th edition, both RFS and OS were different between T3a and T3b (p=0.015 for RFS and p=0.035 for OS), but they were not significantly different between T3a and T4 (p=0.306 for RFS and p=0.055 for OS) or T3b and T4 (p=0.886 for RFS and p=0.559 for OS). According to the survival curves for the 8th edition, however, both RFS and OS were not different between T1a and T1b (p=0.380 for RFS and p=0.777 for OS).
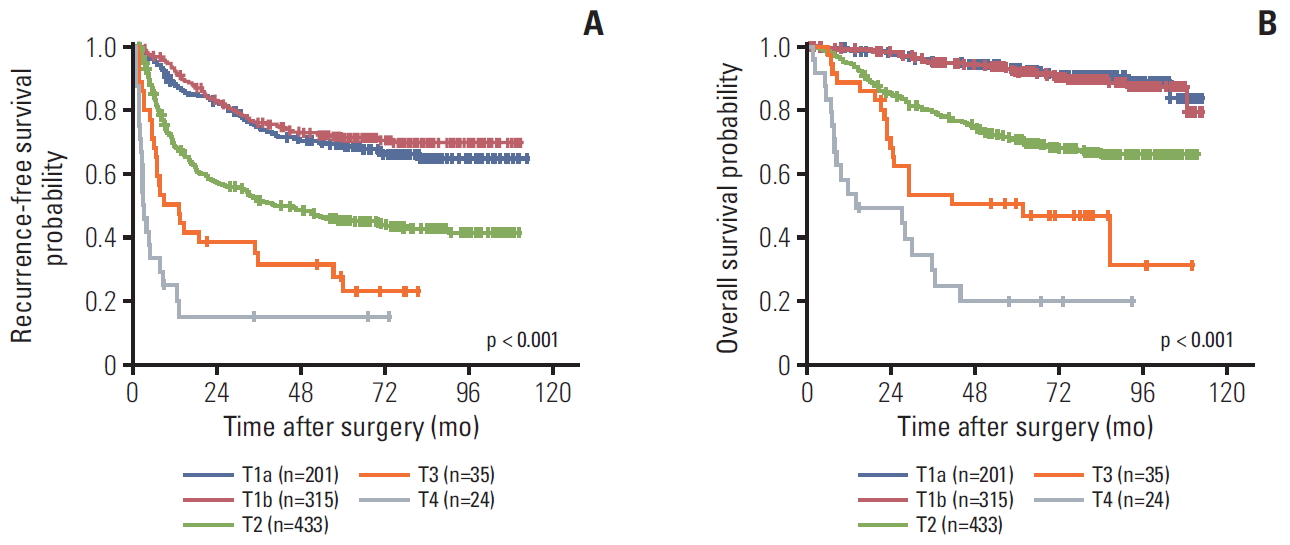
The area under the ROC curve (AUC) graphs for recurrence and death were obtained for both the 7th and 8th editions (Fig. 4). The 2-year AUC value for RFS was 0.693 by the 7th edition and 0.690 by the 8th edition (p=0.737). Similarly, the 2-year AUC value for OS was 0.770 by the 7th edition and 0.765 by the 8th edition (p=0.715). These results indicate comparable predictive abilities of T staging by the AJCC 7th and 8th editions in HCC.
The area under the curve graphs for recurrence (A) and death (B) by the 7th and 8th editions of the American Joint Committee on Cancer (AJCC) T category.
4. Prognostic effect of microvascular invasion in HCC ≤ 2 cm
The tumor sizes of 224 cases (22.2% of the 1,008 cases) were 2 cm or less; among these, 201 cases (19.9%) were solitary tumors that were staged as T1a by the AJCC 8th edition. Although they were staged the same, when these 201 cases were classified into two groups according to presence of microvascular invasion, both RFS and OS were statistically significantly lower in the group with microvascular invasion (n=157) than in those without microvascular invasion (n=44) (p=0.037 for RFS and p < 0.001 for OS) (Fig. 5).
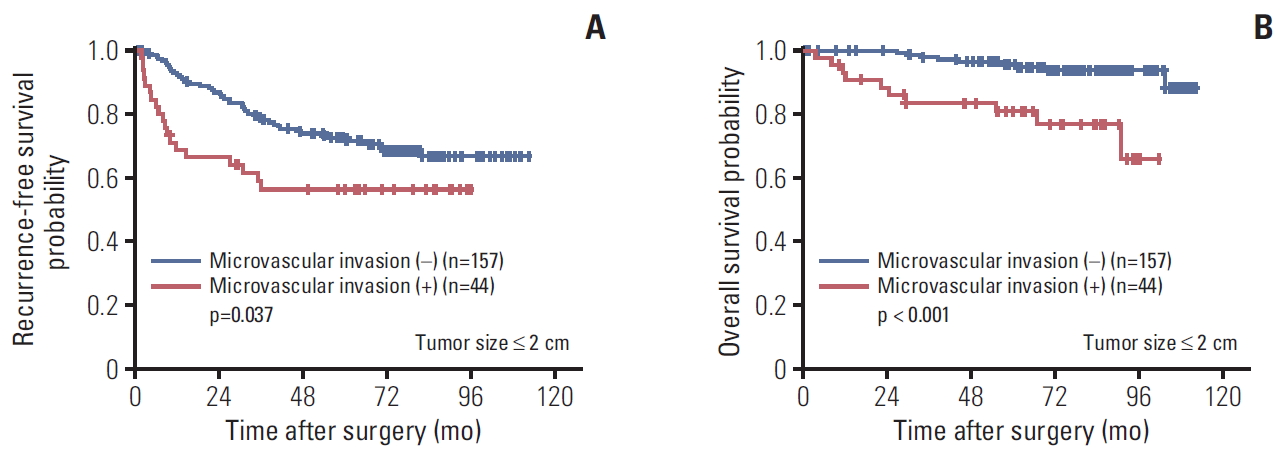
Kaplan-Meir survival curves of single hepatocellular carcinoma ≤ 2 cm according to presence of microvascular invasion: recurrence-free survival (A) and overall survival (B).
5. Involvement of a major branch of the portal or hepatic vein
Of all tumors, 19 (1.9%) involved a major branch of portal vein or hepatic vein and showed T-category migration from T3b by 7th to T4 by the 8th edition. The patients with these tumors had significantly lower RFS and OS values than the 35 cases (34.7%) with multifocal tumors, at least one of which was larger than 5 cm and were classified as T3a by the 7th edition and T3 by the 8th edition (p=0.015 for RFS and p=0.035 for OS) (Fig. 6). These results support the change of 8th edition.
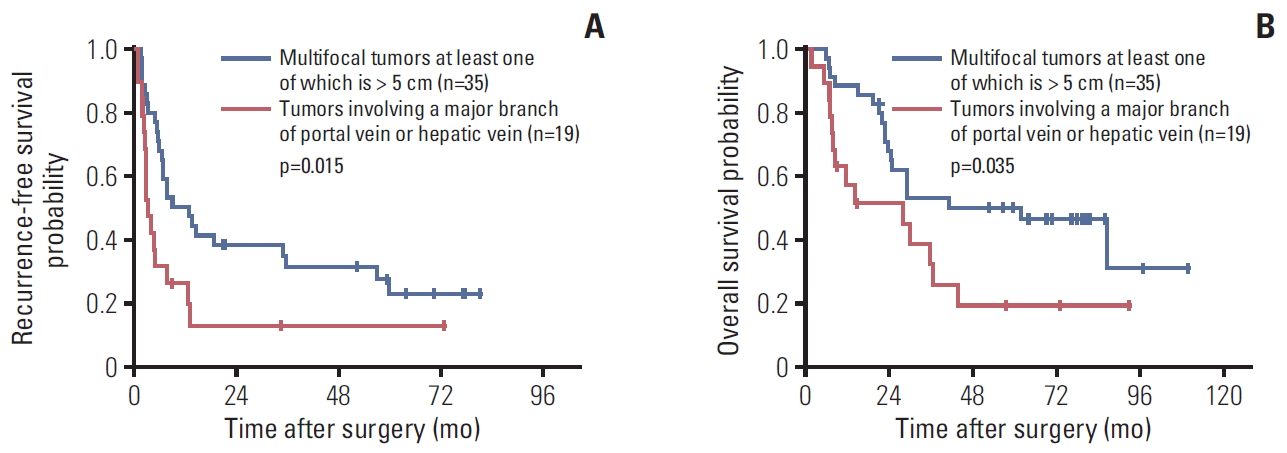
Kaplan-Meir survival curves of the American Joint Committee on Cancer T category 3a versus 3b of the 7th edition: recurrence-free survival (A) and overall survival (B).
Discussion
The prognostic effect of microvascular invasion has been reported in several previous studies as a negative effector in patient survival [10-12]. A recent meta-analysis study incorporating 14 studies involving 3,033 patients confirmed this issue [13]. However, it is debatable that the prognostic effect of microvascular invasion in small-size HCC ≤ 2 cm is significant. In one study published in 2013 by Shindoh et al. [14], however, the long-term survival of 155 patients (14.0%) with solitary HCC ≤ 2 cm was not affected by microvascular invasion. Based on these data, a part of the pathologic T category was modified from the AJCC 7th edition to the 8th edition. According to the 7th edition, a T1 tumor refers only to a solitary tumor without vascular invasion. If there is vascular invasion, it is staged as T2 even if the tumor is solitary. But, in the 8th edition, the size of the tumor is the determining factor, and all solitary tumors with size 2 cm or less are staged as T1a regardless of the presence of vascular invasion. Tumors are staged as at least T1b when their size is larger than 2 cm, and the presence of vascular invasion determines whether the tumor is T1b or T2. In short, in smaller tumors that are 2 cm or less, the presence of vascular invasion is not considered as a prognostic factor in the updated AJCC 8th edition.
One of the main findings of our study was that solitary tumors ≤ 2 cm with microvascular invasion showed lower RFS and OS values than those without microvascular invasion. The discrepancy between the studies by Shindoh et al. [14] and our group may have been caused by the characteristics of the study population, since people in South Korea receive medical services from tertiary medical institutions due to the national health insurance system. Thus, early-stage cancers can be detected more frequently. The proportion of solitary tumors ≤ 2 cm was higher in our study than in the study by Shindoh et al. [14] (19.9% vs. 14.0%, p < 0.001). Another possible explanation is that there is no standardized guideline for pathologic evaluation of microvascular invasion, but this effect might be limited because the frequency of microvascular invasion in solitary HCC ≤ 2 cm was comparable in these two studies (26.5% vs. 22.3%, p=0.48).
There are some reports supporting our results. Recently, Wang et al. [15] demonstrated that microvascular invasion predicts poor prognosis of solitary HCC ≤ 2 cm based on propensity score matching analysis of 496 patients. Meta-analyses by Chen et al. [13] also showed a prognostic effect of microvascular invasion in solitary HCC ≤ 2 cm.
Another major change in T staging is that T3a in the 7th edition is now re-categorized as T3 in the 8th edition, and tumors involving a major branch of the portal or hepatic vein, which were categorized as T3b in the 7th edition, are reclassified as T4 in the 8th edition. This change was based on a long-term survival study of 754 patients [16], which showed no survival difference between patients with T3a and those with T3b tumors (p=0.073) or between patients with T3b and those with T4 tumors (p=0.227). In our study, tumors involving a major branch of the portal or hepatic vein (T4 by the 8th edition and T3b by the 7th edition, n=19) showed lower RFS and OS than multifocal tumors, at least one of which was > 5 cm (T3 by the 8th edition and T3a by the 7th edition, n=35) (p=0.015 for RFS and p=0.035 for OS), supporting the change in the 8th edition.
In the RFS and OS curves generated according to AJCC 7th edition T staging (Fig. 2), the curves of the T4 tumors did not follow the estimated survival. Since the inclusion criteria of this study were designed to strictly involve only resectable cases, there are only five cases staged as T4 after resection. The key information related to these T4 tumors is summarized in S1 Table. As described above, neither RFS nor OS was different between T3a and T4 (p=0.055 for RFS and p=0.306 for OS) or T3b and T4 (p=0.886 for RFS and p=0.559 for OS) by the 7th edition. Therefore, although it was a small group, our results related to T4 tumors suggest that tumors involving a major branch of the portal vein or hepatic vein (T3b) may not show better prognosis in the long term than those involving adjacent organs (other than gallbladder) to a resectable extent. This idea is consistent with the change of AJCC staging, since T3b and T4 categories in the 7th edition are merged into the same T4 category in the 8th edition.
The major limitation of this study is that only curatively resected HCCs were enrolled for analysis. Surgical resection is the only modality with which we can definitely determine the presence of microvascular invasion by pathologic evaluation. Since HCCs can be treated by various treatment modalities based on the status of the patients, study population should be extended to overcome this limitation. In further studies, population-based or multicenter analysis that also include HCC cases treated with other modalities other than surgical resection is required to validate the findings of this study and eventually to modify future AJCC staging systems of HCC with the results.
The T category of AJCC 8th edition had comparable predictive performance to the 7th edition, and T4 in the 8th edition, which was established by combining T3b and T4 of the 7th edition, better predicted the prognosis of tumors with higher T category. However, presence of microvascular invasion still has prognostic value in smaller solitary tumors (size ≤ 2 cm), which are all staged as T1a by the AJCC 8th edition. Further studies such as population-based or multicenter analysis incorporating of HCCs with various treatment modalities other than surgical resection are required to validate these findings and to apply the results to future AJCC staging systems for HCC.
Electronic Supplementary Material
Supplementary materials are available at Cancer Research and Treatment website (https://www.e-crt.org).
Notes
Conflicts of interest relevant to this article was not reported.
Acknowledgements
This study was funded by the Samsung Medical Center intramural Grant (#SMO1161731) and the Basic Science Research Program through the National Research Foundation of Korea (NRF), funded by the Ministry of Education (NRF-2017R1C1B5017890).