Glucose Transporter-1 Expression in Squamous Cell Carcinoma of the Tongue
Article information
Abstract
Purpose
Tumor cells are known to express hypoxia-related proteins such as glucose transporter-1 (Glut-1). These hypoxia-induced changes may allow tumor cells to survive under sustained hypoxic microenvironments, and the surviving tumor cell under hypoxia may develop a more aggressive phenotype and so result in a poor prognosis.
Materials and Methods
The Glut-1 expression was analyzed by immunohistochemistry, and its association with the prognosis was assessed in 60 patients with squamous cell carcinoma of the tongue.
Results
The Glut-1 expression was diffuse with a membranous pattern, and the median percentage of Glut-1 positive tumor cells was 60% (range: 0.0~90.0%). A high Glut-1 expression (the percentage of positive tumor cells ≥ the median value, 60%) was associated with the location of primary lesion, lymph node metastasis status and disease stage (p<0.05). The expression of Glut-1 was correlated with the Ki-67 expression (r=0.406, p=0.001). Microvessel density, as represented by CD31 staining, was also correlated with the Glut-1 expression although its significance is weak (r=0.267, p=0.039). On the univariate analysis, the group with a high Glut-1 expression showed poorer overall survival than the group with a low Glut-1 expression (p<0.05). However, the Glut-1 expression failed to show any independent prognostic significance on the multivariate analysis.
Conclusion
The expression of Glut-1 may be useful for predicting the prognosis and determining the treatment strategy for the management of squamous cell carcinoma of the tongue.
INTRODUCTION
Tumor hypoxia is known to be a phenomenon that's caused by an imbalance between the oxygen supply and consumption within the tumor microenvironment (1). Under sustained hypoxic conditions, tumor cells may die due to an inadequate oxygen supply; however, some tumor cells can survive and they adapt themselves into these conditions via hypoxia-induced cellular changes. Thus, tumor cells can undergo a variety of genetic changes that allow them to prolong their survival under hypoxia. These hypoxia-induced cellular changes can lead to a more aggressive phenotype that results in invasion and metastasis (1,2). Thus, the extent of the hypoxia-induced changes in tumors may provide information about the risk of relapse and the prognosis.
Increased glucose uptake and glycolysis can contribute to the maintenance of the energy requirements under hypoxic conditions. The up-regulated glycolytic metabolism may represent a compensatory change that allows for adaptation of proliferating tumor cells under adverse conditions, and this is primarily mediated by glucose transporters. Glucose transporter-1 (Glut-1) is one of the glucose transporters expressed in many tumors, and it has shown a correlation with a poor prognosis (3,4). The expression of Glut-1 may allow for the continuous growth of tumor cells under hypoxic conditions. In the past, cells were thought to proliferate slowly or not at all under hypoxic conditions, yet in vivo studies have demonstrated the presence of proliferating cells in the hypoxic compartment of tumors (5,6). Although the exact relationship remains unclear, the presence of cells proliferating in the hypoxic compartment may represent more aggressive clones that are selected for by hypoxia. Therefore, pre-treatment characterization of tumor hypoxia may be useful for predicting the prognosis, and this approach may help establish a risk-adapted treatment strategy.
In this study, we evaluated a series of tongue squamous cell carcinomas that had undergone primary surgical treatment to assess the clinical relevance of tumor hypoxia and proliferation. We analyzed the expression of Glut-1 and we compared this with the clinical and pathological characteristics and the treatment outcome.
MATERIALS AND METHODS
1) Patients
Sixty patients with previously untreated squamous cell carcinoma of the tongue and who were seen at Korea University Medical Center were included in this study from 1997 to 2004. All the patients underwent primary surgery with the intent to cure. The patients received postoperative adjuvant radiation therapy in a multidisciplinary setting. Forty-one patients received radiation therapy after surgery (68.3%) and 19 patients received surgery alone (31.7%). This study was approved by the Institutional Review Board of Korea University Medical Center.
2) Immunohistochemistry for Glut-1
Immunohistochemistry for Glut-1 was performed using consecutive 4µm serial sections of formalin-fixed, paraffin-embedded tissues that were placed onto positively charged glass slides with using a single-staining procedure. Two observers reviewed the immunostained slides. All of the interpretations of the immunohistochemistry were done without the pathologist having any knowledge of the patients' clinical outcomes. The polyclonal rabbit anti-human Glut-1 antibody (A3536, DakoCytomation, Copenhagen, Denmark) was used to determine the expression of Glut-1. For antigen retrieval, the sections were microwaved at 600 W in 0.01 M citrate buffer (pH 6.0, Labvision, UK) twice for 5 minutes each time. After blocking with 10% human serum, the slides were incubated with the primary antibody (1 : 200) for 1 hour at room temperature. Biotinylated linked HRP and streptabidin-HRP (K0675, DakoCytomation, Copenhagen, Denmark) were each applied for 10 min, respectively. After the color was developed with using DAB solution and the samples were counterstained with hematoxylin, the tumor cells were considered positive for the Glut-1 antigen if they displayed cytoplasmic staining. After the slides were scanned at low magnification (×40), four areas (per case) of maximum Glut-1 expression were selected. The degree of positive Glut-1 staining on the section was assessed at high magnification (×200) based on the semi-quantitative scale of 0 to 3. A positive Glut-1 expression was designated as those samples with membranous and/or cytoplasmic staining with an intensity of grade 3, and the percentage of tumor cells staining for Glut-1 was measured at low magnification (×40). The mean value of the examined fields was the final value.
3) Immunohistochemistry for Ki-67 and CD31
For the detection of Ki-67, we performed immunostaining with the anti-Ki-67 mouse monoclonal antibody (clone MIB-1, DakoCytomation, CA, USA) based on the above-mentioned procedure. After the slides were scanned at low magnification (×40), the cells with positively stained nuclei were then counted at high magnification (×400). The percentage of the Ki-67 expression was quantified by determining the number of positive cells expressing nuclear Ki-67 among the total number of tumor cells per high power field. Two to three hundred tumor cells were counted and the Ki-67 index was calculated as the percentage of Ki-67 positive cells per positive and negative cells.
To assess the microvessel density, the anti-CD31 mouse monoclonal antibody clone JC70A (Dako, Copenhagen, Denmark) was used to stain the microvessels. Primary antibody (1 : 20 dilution) was applied at room temperature for 60 min, and the slides were stained by the avidin-biotin method. After the slides were scanned at low magnification (×40), four areas (per case) of high vascularization were chosen for counting the microvessels. The microvessel density (MVD) was expressed as the number of vessels per field. The mean value from four fields was recorded as the MVD for each tumor.
4) Statistical analysis
Fisher's exact test was applied to assess the association between the categorical variables. The coefficient of correlation( r) between the expressions of the markers was calculated by using Spearman's rank test. The disease free survival (DFS) and overall survival (OS) curves were calculated using the Kaplan-Meier method and they were compared by the log-rank test. The OS was determined from the date of surgery to the date of death or the last follow-up visit, and DFS was determined to the date of disease relapse or the date of the last follow-up visit. The Cox proportional hazards regression model was used for multivariate analyses. All the statistical analyses were performed using a statistical software package (SPSS, Version 10.0, Inc., Chicago, IL.). Statistical significance was defined as p values less than 0.05. All p values were two-sided.
RESULTS
1) Glut-1 expression
Analysis of the Glut-1 expression included the following parameters: the staining intensity of tumor cells on a grading scale of 0 to 3 and the percentage of positively stained tumor cells. A positive Glut-1 expression was designated as those samples with membranous and/or cytoplasmic staining with an intensity of grade 3 (Fig. 1) so as to exclude false positive cases such as nonspecific or vaguely immunostained cases. The distribution of the Glut-1 expression was diffuse with a membranous pattern (Fig. 1). The median percentage of Glut-1 positive tumor cells was 60.0% (range: 0.0~90.0%). High and low Glut-1 expressions were defined according to the median value (high ≥60.0% versus low <60.0%).

Representative staining of glucose transporter-1 shows brown colored membranous staining (magnification ×200).
2) Correlation of the Glut-1 expression with the clinical and pathological characteristics
The clinical and pathological characteristics of the patients enrolled in this study are summarized in Table 1. The follow-up duration was from 4.10 months to 117.13 months. The median age of the patients was 54.9 years (range: 20.0~79.4 years). 30 patients relapsed during follow-up and 22 of these patients died. There were 19 cancer-related deaths, but there were three deaths not related to cancer: 1 case of acute myocardial infarction, 1 case of subarachnoid hemorrhage and 1 case of pneumonia. 30 patients were alive without evidence of disease relapse and eight patients were alive with disease. The correlation of the Glut-1 expression with the clinical and pathological characteristics is summarized in Table 2. A high Glut-1 expression (≥60.0%, median value) was more frequently observed in tongue base squamous cell carcinoma, which is known to have a poorer prognosis than the other sites of the tongue such as the anterior or lateral tongue. Lymph node metastasis status was also associated with a high Glut-1 expression (p=0.010) although the T stage was not related with the Glut-1 expression. The number of patients with a high Glut-1 expression was significantly greater for the patients with stage III/IV disease than for the patients with stage I/II disease. However, other characteristics, including gender, age, the smoking status and the degree of differentiation, were not associated with the Glut-1 expression (Table 2). The patients treated with adjuvant radiotherapy had high Glut-1 and Ki-67 expressions (p=0.006). Since radiotherapy was administered to those patients with a high probability of relapse or a high tumor burden, these findings suggest that the Glut-1 expression might be related with an aggressive tumor phenotype.
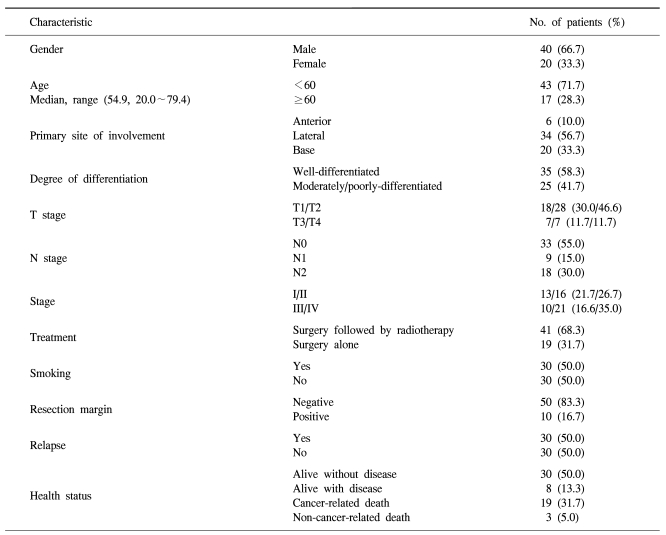
Characteristics of the patients
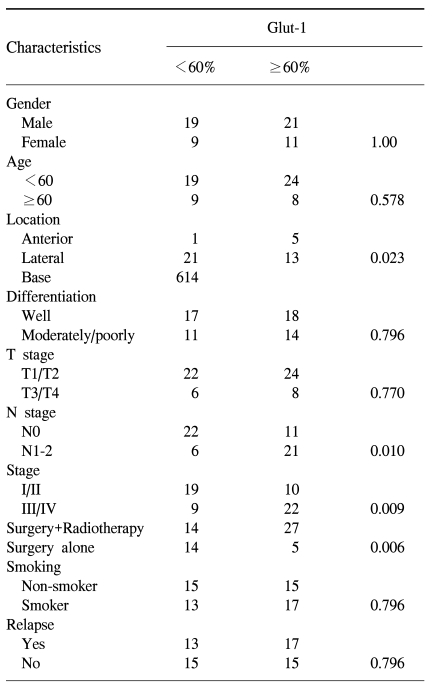
Correlations of Glut-1 with the clinical and pathological characteristics
3) Correlations of Glut-1 with proliferation and angiogenesis
To assess the relationships of the Glut-1 expression with cellular proliferation, the percentage of Glut-1-positive tumor cells were compared with the Ki-67 expression by using Spearman's rank test. The Glut-1 expression showed a correlation with the Ki-67 expression (r=0.406, p=0.001, Fig. 2A). The Glut-1 expression was also correlated with microvessel density, although its significance was weak (r=0.267, p=0.039). To examine the spatial relationship of Glut-1 with proliferation and angiogenesis, we compared the expressions of both proteins in the same field. We found the positive Ki-67 expression in the same region as the Glut-1 expression (Fig. 3). Microvessels represented by CD31 staining were observed in the interstitial area (Fig. 3). While the Glut-1 expression was diffuse and wide spread over the tumor areas, the Ki-67 expression was dominantly observed at the periphery of tumor nests that were close to microvessels. Therefore, these findings suggest the presence of hypoxia might stimulate angiogenesis and maintain proliferation of tumor cells in the hypoxic compartment of the tumors.

Correlation of the Glut-1 expression with the Ki-67 expression and the microvessel density. (A) The percentage of Glut-1 positive cells showed a correlation with the Ki-67 expression (r=0.406, p=0.001). (B) The percentage of Glut-1 positive cells showed a correlation with the microvessel density (r=0.267, p=0.039).
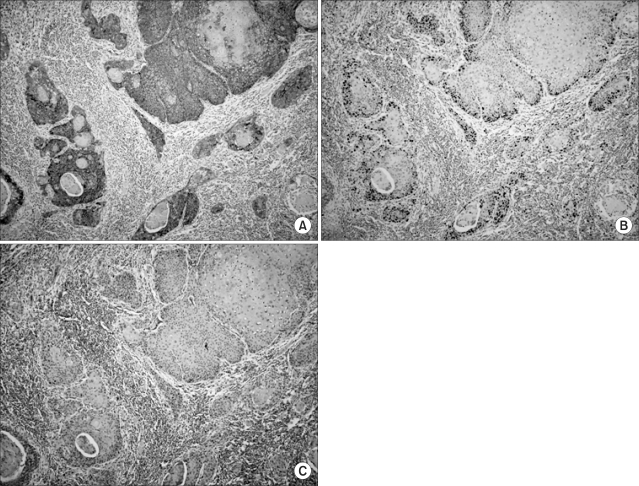
Immunohistochemistry performed on serial tissue sections (magnification ×200). (A) Brown colored membranous staining was observed for the Glut-1 expression. (B) The Ki-67 expression (brown colored nuclear staining) was observed in the same field. (C) Microvessels were found in the stromal areas between the tumor nests.
4) Relationship with prognosis
Among the 30 cases with relapse, 27 were loco-regional and three were at distant sites: lung and bone metastasis. Tumor relapse was not significantly related with the Glut-1 expression (Table 2). On the univariate analysis, the patients with a high Glut-1 expression were significantly associated with poorer overall survival as illustrated by the Kaplan-Meier curves (Fig. 4A). However, the disease-free survival (p>0.05, Fig. 4B) was not significantly different among the compared. Multivariate analysis was performed to examine the independent prognostic significance of several variables, as compared with the established clinical staging; these variables included the Glut-1 expression and the other clinical and pathological characteristics such as age, stage, location of the primary site, the presence of tumor cells in the resection margin and the treatment modality. The expression of Glut-1 failed to display independent prognostic significance for survival (p>0.05).
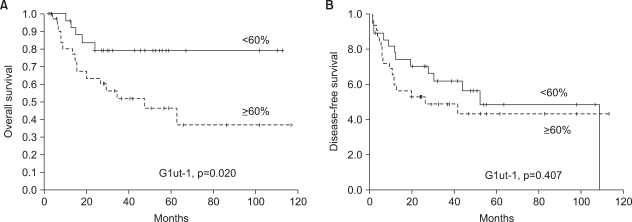
Overall and disease free survival analyses. (A) A high Glut-1 expression (the percentage of positively stained tumor cells ≥ median value) was significantly associated with poorer overall survival on the univariate analysis as illustrated by the Kaplan-Meier curves. (B) Disease-free survival was not associated with a high Glut-1 expression.
DISCUSSION
The expression of Glut-1 was reported to be associated with a poor prognosis for patients with oral squamous cell carcinoma (4,7). Our study showed a significant relationship between the Glut-1 expression and overall survival. Although the results were not statistically significant (p>0.05), the group with a high Glut-1 expression had a better disease-free survival. These findings are consistent with previous reports about the prognostic value of the Glut-1 expression for oral squamous cell carcinoma (4,7). Oral squamous cell carcinoma with the overexpression of Glut-1 has demonstrated high fluorine-18 fluoro-2 deoxy-D-glucose (FDG) uptake, although there was no proven correlation between FDG SUV and the Glut-1 expression (8). Positron Emission Tomography (PET) has been used to identify aggressive tumors by assessing the tumor's glucose metabolism; therefore, the clinical relevance of the Glut-1 expression as a prognostic marker may be important. Although the association of Glut-1 with hypoxia is still controversial, its correlation with the exogenous marker pimonidazole supports its association with hypoxia (9). It is reported that the expression of Glut-1 tends to be more extensive than that of the other endogenous hypoxia markers such as carbonic anhydrase IX (CA IX); our study results are consistent with these previous findings (10). The widespread expression of Glut-1 may suggest that the threshold for the Glut- 1 expression under hypoxic conditions may be lower than that for the CA IX expression.
In this study, we found a significant correlation between the Glut-1 expression and the Ki-67 expression (Fig. 2A). This relationship was confirmed by their spatial relationship (Fig. 3). These findings are consistent with prior reports on the presence of proliferating cells in the hypoxic tumor compartment (6,11). The proliferating tumor cell clones under hypoxic conditions may represent tumor cells that are developing a more aggressive phenotype (6,12), and the co-expression of hypoxia markers and Ki-67 may represent tumor aggressiveness. We also found a relationship between the Glut-1 expression and the microvessel density, although their correlation was relatively weak (r=0.267, p=0.039). However, because angiogenesis is crucial for sustaining tumor growth and metastasis, this relation may support the significance of tumor hypoxia itself for predicting the prognosis and the tumor biology. When we analyzed the spatial relationship, we found many microvessels in the tumor stromal areas from the high Glut-1 expression tumors. This finding can augment the role of tumor hypoxia for inducing more aggressive phenotype of tumors.
In this study, we analyzed patients with squamous cell carcinoma of the tongue because most previous studies were performed with various kinds of the head and neck squamous cell carcinomas such as larynx, pharynx, nasal cavity and the floor of the mouth (4,7,13,14). Thus, our study focused on one site of the head and neck to exclude the bias associated with the location of primary lesion. To the best of our knowledge, this is the first study about the prognostic significance of the Glut-1 expression in Korean patients with squamous cell carcinoma of the tongue. Although the staging system is commonly used for predicting the prognosis and tumor burden, the survival data for each stage shows heterogeneous results. Thus, patients with the same stage disease may show a different clinical outcome. Therefore, identifying the patients at a high risk for a poor prognosis would allow the development of tailored treatment strategies. Although our study failed to show the association of the Glut-1 expression with disease-free survival or any independent prognostic significance on the multivariate analysis, the Glut-1 expression may become useful for selecting those patients who require additional treatment before or after their primary treatment. However, further studies with larger study populations are warranted to show the Glut-1 expression's independent prognostic significance.
CONCLUSIONS
In this study, we found that the expression of Glut-1 was significantly associated with poor overall survival for patients with squamous cell carcinoma of the tongue. A high Glut-1 expression was associated with the status and stage of lymph node metastasis. In addition, a high Glut-1 expression was related with a high Ki-67 expression, and cellular proliferation and increased angiogenesis was represented by the microvessel density. Considering these results, the Glut-1 expression associated with tumor hypoxia may become useful for predicting tumor aggressiveness and the prognosis for patients with squamous cell carcinoma of the tongue.
Notes
This work was supported by a Korea Research Foundation Grant funded by the Korean Government (MOEHRD). (KRF-2005-003-E00115).