Incorporating Neutrophil-to-lymphocyte Ratio and Platelet-to-lymphocyte Ratio in Place of Neutrophil Count and Platelet Count Improves Prognostic Accuracy of the International Metastatic Renal Cell Carcinoma Database Consortium Model
Article information
Abstract
Purpose
The study investigated whether a replacement of neutrophil count and platelet count by neutrophil-to-lymphocyte ratio (NLR) and platelet-to-lymphocyte ratio (PLR) within the International Metastatic Renal Cell Carcinoma Database Consortium (IMDC) model would improve its prognostic accuracy.
Materials and Methods
This retrospective analysis included consecutive patients with metastatic renal cell carcinoma treated with first-line tyrosine kinase inhibitors. The IMDC and modified-IMDC models were compared using: concordance index (CI), bias-corrected concordance index (BCCI), calibration plots, the Grønnesby and Borgan test, Bayesian Information Criterion (BIC), generalized R2, Integrated Discrimination Improvement (IDI), and continuous Net Reclassification Index (cNRI) for individual risk factors and the three risk groups.
Results
Three hundred and twenty-one patients were eligible for analyses. The modified-IMDC model with NLR value of 3.6 and PLR value of 157 was selected for comparison with the IMDC model. Both models were well calibrated. All other measures favoured the modified-IMDC model over the IMDC model (CI, 0.706 vs. 0.677; BCCI, 0.699 vs. 0.671; BIC, 2,176.2 vs. 2,190.7; generalized R2, 0.238 vs. 0.202; IDI, 0.044; cNRI, 0.279 for individual risk factors; and CI, 0.669 vs. 0.641; BCCI, 0.669 vs. 0.641; BIC, 2,183.2 vs. 2,198.1; generalized R2, 0.163 vs. 0.123; IDI, 0.045; cNRI, 0.165 for the three risk groups).
Conclusion
Incorporation of NLR and PLR in place of neutrophil count and platelet count improved prognostic accuracy of the IMDC model. These findings require external validation before introducing into clinical practice.
Introduction
Recent years has brought a significant improvement in treatment of patients with metastatic renal cell carcinoma (RCC). Introduction of tyrosine kinase inhibitors (TKIs) increased the median overall survival (OS) more than two-fold when compared to cytokine-based therapies, currently approaching 2 years for first-line setting [1,2]. However, no factors able to predict therapy-associated response were found for any compound used in this indication. Thus, patient evaluation and therapeutic decisions still rely on the survival prognosis which is stratified using baseline clinical features. The most common tool for this purpose developed in the era of molecular targeted therapies is the International Metastatic Renal Cell Carcinoma Database Consortium (IMDC) model, which consists of six factors associated with poor outcome: Karnofsky performance status (KPS) less than 80%, time from diagnosis to treatment initiation less than 1 year, haemoglobin less than the lower limit of normal (LLN), serum corrected calcium greater than the upper limit of normal (ULN), neutrophil count greater than the ULN and platelet count greater than the ULN. Patients are stratified into favourable, intermediate and poor risk groups according to the number of the adverse factors (0, 1-2, and 3-6, respectively) [3]. The IMDC model was successfully validated using external datasets and nowadays is applicable for first-, second- and third-line treatment [4-6]. Since the introduction of the IMDC model in 2009, numerous studies revealed potential prognostic role of neutrophil-to-lymphocyte ratio (NLR) and platelet-to-lymphocyte ratio (PLR) in metastatic RCC [7-14]. NLR and PLR are easy accessible and cost-effective biomarkers of inflammation with values depending on neutrophil count and platelet count, respectively, albeit were not analyzed during the computation of the IMDC model. The purpose of this study was to evaluate if the replacement of neutrophil count and platelet count by NLR and PLR within the IMDC model would improve its prognostic ability for OS in patients treated with first-line TKIs.
Materials and Methods
1. Patients
The present retrospective analysis included consecutive patients with metastatic RCC who had begun treatment with a first-line TKI from November 2009 to March 2016, in the Department of Oncology, Military Institute of Medicine in Warsaw, Poland. The inclusion criteria contained: (1) diagnosis of metastatic RCC of any histologic subtype, (2) previous nephrectomy or nephron-sparing surgery, (3) use of standard TKI schedules, (4) no other malignancies, (5) no adjuvant or investigational therapy at any time after diagnosis. Additionally patients who were treated with immunotherapy prior to the initiation of a TKI (i.e., TKI therapy was second-line systemic treatment) were included.
Patients’ information was gathered from their individual medical records. The study was approved by the ethics committee of the participating centre.
2. Outcome and statistical methods
The assessed outcome was OS which was defined as the time from the initiation of first-line TKI treatment to death of any cause. The Kaplan-Meier estimation was used to plot survival curves and to calculate medians with 95% confidence intervals (CIs) for OS. Log-rank test was used to compare survival curves of the three risk groups. Patients’ data was last updated on October 15, 2016. Patients, who were either alive on that date or lost to follow-up were censored. The Schemper and Smith method was used to calculate the median follow-up time [15]. A formula for serum corrected calcium calculation was as follows: total serum calcium +0.8×(4–serum albumin). NLR and PLR were calculated by dividing the absolute neutrophil count and the absolute platelet count, respectively, by the absolute lymphocyte count. Binary variables were converted from continuous or ordinal variables using following rules: (1) KPS: > 70% versus ≤ 70%; (2) time since diagnosis to treatment initiation: < 12 months versus ≥ 12 months; (3) serum corrected calcium, neutrophil count, and platelet count: ≤ ULNs versus > ULNs; (4) haemoglobin: ≥ LLN versus < LLN; and (5) NLR and PLR: < cutpoint candidate versus ≥ cutpoint candidate. Cutpoint candidates for NLR and PLR were obtained in a two-step procedure. In the first step, cutpoints were taken from the literature (2.5, 3.0, 3.6, and 4.0 for NLR; 150 and 210 for PLR) [9,10,12-14] and from the Contal and O’Quigley method. In this method, a cutpoint with the highest absolute result of log-rank statistic gives the maximum difference between the subjects in the two groups defined by this cutpoint [16]. In the second step, preliminary models that included the IMDC criteria with replacement of neutrophil count and platelet count by all possible combinations of NLR and PLR cutpoint candidates were constructed. All the models underwent multivariable Cox proportional hazards regression and thereafter calculation of bias-corrected concordance index with generation of 1,000 bootstrap samples using random sampling with replacement. The model with the highest value of bias-corrected concordance index, then called the modified-IMDC model, was selected for comparison with the original IMDC model. The models’ prognostic accuracy was assessed separately for individual risk factors and the three risk groups using: (1) concordance index, (2) bias-corrected concordance index, (3) calibration plots, (4) the Gronnesby and Borgan test at 24 months after TKI initiation, (5) Bayesian Information Criterion (BIC), (6) generalized R2, (7) Integrated Discrimination Improvement (IDI), and (8) continuous Net Reclassification Index (cNRI).
Concordance index is a traditional measure of discrimination, which is the ability of the model to separate patients with different outcomes. Bias-corrected concordance index is a result of reducing the bias caused by model overfitting from the concordance index. Both indices result with values ranging from 0.5 representing no predictive ability to 1 representing perfect predictive ability to separate patients [17]. Calibration refers to the amount of agreement between predicted and observed outcomes. Calibration plot consists of the x-axis for predictions and the y-axis for the outcome with perfect predictions located on a 45 degree line. The Grønnesby and Borgan test evaluates calibration in survival analysis setting [18]. A model is miscalibrated if the results of the test are statistically significant across groups constructed by splitting patients using deciles of their risk scores. BIC and generalized R2 assess the distances between observed and predicted outcomes and both are related to the concept of global ‘goodness-of-fit.’ A model with lower BIC value and generalised R2 value closer to 1 within the range from 0 to 1 represents better overall prognostic ability. IDI and Net Reclassification Index (NRI) quantify the degree of correct reclassification offered by new set of prognostic criteria, separately for group with the outcome (events) and without the outcome (non-events) [19]. IDI is considered as an improvement in average sensitivity without sacrificing average specificity, and is equal to Aevent –Anon-event, where,
Aevent=Average probability of having event in events
Anon-event=Average probability of having event in non-events
Using NRI, every change in pre-specified risk categories based on predicted probabilities for individuals after implementation of the new model is counted as upward movement (a change into higher-risk category, e.g., from medium to high) or downward movement (a change in the opposite direction, e.g., from medium to low). Then NRI is equal to Pevent–Pnon-event, where,
Pevent=Probability of moving upward in events–Probability of moving downward in events
Pnon-event=Probability of moving upward in non-events–Probability of moving downward in non-events
cNRI does not require pre-specified risk categories but considers any increase in individual’s predicted probability as upward movement (e.g., from 0.15 to 0.16) and any decrease as downward movement (e.g., from 0.16 to 0.15) [20]. Calculation of modified IDI and cNRI suitable for survival data were done at 24 months after first-line TKI initiation [21,22]. 95% CIs for results of IDI and cNRI were obtained using resampling-perturbation procedure with 1,000 bootstrap samples [22]. A larger positive value of IDI and cNRI means a better reclassification after switching from the old model to the new model.
All tests were two-sided with p-values less than 0.05 indicating statistical significance. Patients with missing data for models’ covariates were excluded from analyses. Statistical computations were done using Stata ver. 14.2 (StataCorp., College Station, TX) and R ver. 3.2.3 (The R Foundation for Statistical Computing, Vienna, Austria).
Results
1. Outcomes
Three hundred and twenty-six patients fulfilled inclusion criteria. Five cases had missing values for serum corrected calcium and were excluded from further analyses. Detailed characteristics of the remaining 321 patients are listed in Table 1. At the conclusion of data collection, 219 patients (68.2%) had died. Median OS was 23.2 months (95% CI, 19.0 to 27.4) and median follow-up time was 55.5 months (95% CI, 50.4 to 60.6). One hundred and forty-three patients (44.5%) were treated with second-line targeted therapy: 118 (36.8%) received everolimus and 25 (7.7%) received axitinib.

Patient characteristics at the start of first-line TKI therapy
2. The IMDC model
Table 2 summarises the results of multivariable factor analysis of the IMDC criteria. KPS, time since diagnosis to treatment initiation, hemoglobin, serum corrected calcium, and platelet count were independently associated with OS. Neutrophil count did not independently influence on OS. After categorization according to number of predefined factors, 119 patients (37.1%) were in the favourable risk group with median OS of 40.2 months (95% CI, 34.5 to 45.9) and 2-year survival rate of 69.6% (95% CI, 61.0 to 78.2), 167 patients (52.0%) were in the intermediate risk group with median OS of 19.6 months (95% CI, 15.8 to 23.4) and 2-year survival rate of 43.2% (95% CI, 35.4 to 51.0), 35 patients (10.9%) were in the poor risk group with median OS of 6.5 months (95% CI, 3.5 to 9.5) and 2-year survival of 12.3% (95% CI, 1.1 to 23.5). OS curves differed significantly between the IMDC risk groups (Fig. 1).
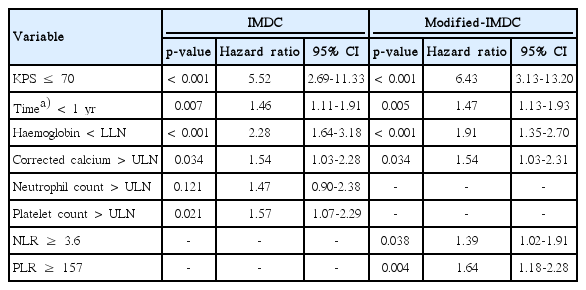
Multivariable Cox regression analyses of the IMDC and modified-IMDC models

Kaplan-Meier curves for overall survival (OS) stratified by the International Metastatic Renal Cell Carcinoma Database Consortium (IMDC) risk groups.
3. The modified-IMDC model
The cutpoints derived by the Contal and O’Quigley method were 2.5 for NLR and 157 for PLR. Thus, 12 models including all possible combinations of NLR and PLR candidates as replacements of neutrophil and platelet counts were constructed (S1 Table). Out of these, a model with NLR and PLR cutpoints of 3.6 and 157, respectively, had the highest bias-corrected concordance index and was named the modified-IMDC model. In multivariable analysis all its covariates were significantly influencing OS (Table 2). After segregation based on modified-IMDC criteria using the same rule for number of predefined factors, 68 patients (21.2%) were in the favourable risk group with median OS of 46.1 months (95% CI, 35.2 to 57.0) and 2-year survival rate of 83.9% (95% CI, 74.7 to 93.1), 161 patients (50.2%) were in the intermediate risk group with median OS of 25.3 months (95% CI, 19.7 to 30.9) and 2-year survival rate of 51.5% (95% CI, 43.5 to 59.5), 92 patients (28.7%) were in the poor risk group with median OS of 10.3 months (95% CI, 7.7 to 12.9) and 2-year survival of 20.5% (95% CI, 11.7 to 29.3). OS curves differed significantly between the modified-IMDC risk groups (Fig. 2).

Kaplan-Meier curves for overall survival (OS) stratified by the modified International Metastatic Renal Cell Carcinoma Database Consortium (MIMDC) risk groups.
4. Comparison of prognostic accuracy of the IMDC and modified-IMDC models
Calibration plots were similar across the models and revealed their well calibration using individual risk factors and only slightly worse performance of the IMDC using the three risk groups (S2-S5 Figs.). Non-significant results of the Grønnesby and Borgan tests supported agreement between observed and estimated expected numbers of events in both models (S6 Table). All other measures showed better prognostic performance of the modified-IMDC model over the IMDC model, including statistically significant results of IDI and cNRI (using individual risk factors) and cNRI (using the three risk groups) (Table 3, S7 and S8 Figs.).

Measures of fit of the IMDC and modified-IMDC models
Discussion
The IMDC model is a well-established tool for survival prediction in patients treated with targeted therapies for metastatic RCC. However, during its construction, several baseline factors potentially influencing the prognosis, including inflammatory markers as C-reactive protein [23], NLR [7-13], or PLR [12,14], were omitted. Besides, high neutrophils and platelets present in the IMDC model were not independently associated with poor survival in other studies [24,25], and high lymphocyte count was found to decrease risk death of patients treated with interleukin 2 [26]. Thus, the combination of these may provide more prognostic information than either component alone. This is coherent with immunogenic nature of RCC, whose growth is stimulated by neutrophil secretions (e.g., vascular endothelial growth factor, hypoxia-inducible factor) and lymphocyte-mediated response inhibition (e.g., via T-cell apoptosis) [27,28]. Therefore, if replacement of neutrophil and platelet counts by NLR and PLR within the IMDC model would improve its prognostic accuracy, it would be a simple and beneficial change in this prognostic tool, especially when no factors predicting a response to TKI therapy exist.
In this study population, prognostic performance of the modified-IMDC model that included NLR and PLR in place of neutrophil count and platelet count was unanimously improved when compared to the original IMDC model. In multivariable Cox regression analysis all six factors of the modified-IMDC model were significantly influencing OS, whereas neutrophil count was non-significant factor in the IMDC model. Additionally, the modified-IMDC model distributed patients more equally within favourable and poor risk groups (21.2% vs. 37.1% and 28.7% vs. 10.9%, respectively). The decrease in proportion of patients in the favourable risk group was similar to the increase in proportion of patients in the poor risk group and it was accompanied by the increase in median OS in all three risk groups. This may be explained by the Will Rogers phenomenon: patients with ‘the worst’ outcome within the favourable risk group moved into the intermediate risk group and similar number of patients with ‘the worst’ outcome within the intermediate risk group moved into the poor risk group [29]. Global ‘goodness of fit,’ discrimination and recalibration measures favoured the modified-IMDC model over the IMDC model not only in case of using individual risk factors, but also when using the three risk groups, which is a common and comprehensible approach to stratify patients in clinical practice.
The most important weakness of the study might be determining the cutpoints for NLR and PLR which are continuous variables without defined limits of normal. Herein values of 3.6 for NLR and 157 for PLR have been chosen as cutpoints because this combination, together with the remaining IMDC criteria, had shown the highest level of patients’ discrimination. Nevertheless, different combination of NLR and PLR cutpoints may present better prognostic performance within other populations. Several studies revealed that NLR greater than 2.5 [9], 3.0 [10], 3.04 [11], 4.0 [13] and PLR greater than 150 [12], 210 [14] are associated with poor survival. The only study in which both NLR and PLR were significant prognostic factors in multivariable analysis contained cutpoints of 3.6 and 150 for NLR and PLR, respectively [12]. Interestingly, this set of cutpoints is almost identical to the presented in the current research. Moreover, the remaining 11 models with other sets of cutpoints were still better than the IMDC model in terms of bias-corrected concordance index, BIC and generalized R2 when using individual risk factors (S1 Table). This supports the hypothesis that improvement in prognostic accuracy may be observed regardless of NLR and PLR cutpoints chosen from the literature.
Other limitations of this study include its retrospective design, single-institution experience and no collection of information about concomitant drugs influencing on blood counts (e.g., steroids). Despite these disadvantages, patients’ outcomes are similar to those reported recently; likewise the performance of the IMDC model still looks satisfactory with wide separation of the risk groups’ survival curves.
To our knowledge, this is the first study that assessed the possibility of improvement in the prognostic accuracy of the IMDC model since its development about eight years ago. This complex analysis demonstrated that replacement of neutrophil and platelet counts by NLR and PLR provided more accurate prognostic information within population of patients with metastatic RCC treated with first-line TKIs. Despite promising results, further studies on external datasets are needed to confirm these findings and to establish cutpoints for NLR and PLR.
Electronic Supplementary Material
Supplementary materials are available at Cancer Research and Treatment website (http://www.e-crt.org).
Notes
Conflict of interest relevant to this article was not reported.