Use of a Combined Gene Expression Profile in Implementing a Drug Sensitivity Predictive Model for Breast Cancer
Article information
Abstract
Purpose
Chemotherapy targets all rapidly growing cells, not only cancer cells, and thus is often associated with unpleasant side effects. Therefore, examination of the chemosensitivity based on genotypes is needed in order to reduce the side effects.
Materials and Methods
Various computational approaches have been proposed for predicting chemosensitivity based on gene expression profiles. A linear regression model can be used to predict the response of cancer cells to chemotherapeutic drugs, based on genomic features of the cells, and appropriate sample size for this method depends on the number of predictors. We used principal component analysis and identified a combined gene expression profile to reduce the number of predictors.
Results
The coefficients of determinanation (R2) of prediction models with combined gene expression and several independent gene expressions were similar. Corresponding F values, which represent model significances were improved by use of a combined gene expression profile, indicating that the use of a combined gene expression profile is helpful in predicting drug sensitivity. Even better, a prediction model can be used even with small samples because of the reduced number of predictors.
Conclusion
Combined gene expression analysis is expected to contribute to more personalized management of breast cancer cases by enabling more effective targeting of existing therapies. This procedure for identifying a cell-type-specific gene expression profile can be extended to other chemotherapeutic treatments and many other heterogeneous cancer types.
Introduction
Breast cancer, the most common cancer in women, is a major cause of female mortality. Approximately 232,340 new cases of invasive breast cancer and 39,620 breast cancer deaths were reported in the United States in 2013 [1-3]. In Korea, breast cancer is the second most common cancer in women, accounting for 19.8% of female cancer cases. Approximately 13,400 breast cancer cases were reported in 2009 and the rate of new diagnosis has been rising steadily [4,5].
Treatment of breast cancer usually involves one or more drugs, surgery, and sometimes radiation. Positive clinical responses to anticancer therapies are often restricted to a subset of patients. Chemotherapy, a systematic drug regimen intended to stop cancer cells from dividing and growing, targets all rapidly growing cells, not only cancer cells, and is therefore associated with unpleasant side effects [6]. Mutated cancer genes contain biomarkers, making them good candidates for drug targeting [7]. Therefore, study of the relationship between gene expression and drug sensitivity is required in order to administer the right drug to the right patient and reduce the side effects of cancer treatment.
Scherf et al. [8] examined gene-gene, gene-drug, and drug-drug interactions by combining gene expression data and drug sensitivity data. The first limitation of their research was that laboratory cell lines differ from tumor cells. Later, Kao et al. [9] reported that gene expression patterns were similar in their cell lines and primary breast cancer tumors. Therefore, many studies for predicting chemosensitivity with gene expression have used cell lines.
Several studies have demonstrated that genomic biomarkers can be used in prediction of chemotherapeutic responses in human cancer patients [7,10-15]. Many such studies used statistical methodologies or machine learning methods [10-12].
The aim of this study was to predict drug sensitivity using gene expression analysis and a linear regression model. The necessary sample size for linear regression depends on the number of predictive variables [16]. Sample size must increase as the number of predictors increases.
In this study, we suggest a method for implementing a chemosensitivity prediction model with a reduced number of predictors, which will be useful in cases with small sample sizes. We identify a combined gene expression pattern that requires fewer predictors than analysis involving several individual genes. Doxorubicin, an anthracycline widely used in the treatment of breast cancer, was the targeted chemotherapeutic agent [17].
Materials and Methods
1. Data preparation
Two publicly available datasets of gene expressions and drug sensitivities were used in this study. The first dataset was compiled by Felding-Habermann et al. [18] for examination of gene expression in cell lines; it is accessible from a public microarray database (gene expression omnibus [GEO], GSE51086). This dataset consists of 29 cell lines, including 14 luminal, four basal A, and eight basal B cell lines (the other three cell lines are of unknown type), and includes 45,220 probes, and it was summarized by 19,722 gene symbols for this study.
The other dataset, published by Garnett et al. [7], consists of 608 cell lines and reports the IC50 scores of 111 drugs [10] (inhibitory concentration, IC50, represents the concentration of a drug required for 50% growth inhibition in vitro). Of those, we looked at 43 breast cancer cell lines and 98 drugs, because those missing more than 50% of data were excluded. The datasets are summarized in Table 1.

Summary of the datasets used in this work
2. Statistical methods
IC50 scores were standardized before performing statistical analysis. Associations between gene expression and cell line, drug sensitivity and cell line, and drug sensitivity and gene expression in the combined dataset were examined. For this, analysis of variance (ANOVA) was performed for identification of significantly expressed genes among different types of breast cancer cells. Correlation analysis was performed to examine the relation of drug sensitivity to gene expression. Linear regression was used for identification of a drug sensitivity prediction model with gene expression as the predictor.
3. DG-matrix analysis (the association of drug sensitivity and gene expression)
The degree of similarity between the G-matrix (association of gene expression and cell line) and D-matrix (association of drug sensitivity and cell line) was calculated using the Pearson correlation coefficient, r, calculated as follows:
, where xi denotes the gene expression of ith cell, yi denotes the IC50 of iih cell to drug y,
Principal component analysis (PCA) was used to reduce the number of independent variables (the number of genes) in the prediction model for drug sensitivity [19]. PCA is a simple nonparametric statistical method that reduces data dimensionality for conversion of correlated variables into uncorrelated variables, which are termed principal components. Each principal component is represented in the form of linear combinations of original variables. Therefore, a value for each cell line can be calculated according to the following formula, which we call combined gene expression:
, where g1, g2, g3 … gn are gene expressions, and C1, C2, C3 … Cn are weights of each gene expression.
In examining the association of gene expression and drug sensitivity, cell lines which did not include gene expressions or IC50 scores were excluded. The usage of datasets and a schematic diagram of the study design are shown in Fig. 1.
The summary of the study plan using two published datasets. G-matrix includes 638 genes, which showed significantly different expression among subtypes of breast cancer cell lines.
Statistical analyses were performed using R ver. 3.1.1 (R Foundation for Statistical Computing, Vienna, Austria), p < 0.05 was considered statistically significant. The PCA algorithm was also performed using R [20].
Results
1. Gene expression profiling of breast cancer cell lines (G-matrix)
The GSE51086 microarray dataset was used to examine the relationship between gene expression and subtypes of breast cancer cell lines. The dataset included 45,220 probes, and it was summarized by 19,722 gene symbols for this study. The three cell lines in the dataset that did not include subtype information were excluded. A total of 638 genes were identified by significance among breast cancer subtypes. The subtypes of breast cancer cell lines were 14 luminal, four basal A, and eight basal B.
Unsupervised hierarchical clustering performed to examine the genetic characteristics of each cell line revealed significant grouping of cell lines based on subtypes of breast cancer (Fig. 2).
Expression patterns of 638 genes in breast cancer cell lines, identified by ANOVA. The vertical and horizontal axes represent gene expressions and breast cancer cell lines, respectively.
Orange color denotes low expression and yellow denotes high expression. The gene expression pattern was clearly divided into several sections, which were strongly associated with subtypes of breast cancer cell lines. Expression of the first gene group was decreased in the order of basal A > basal B > luminal, and expression of the second group was increased according to the same order (i.e., basal A < basal B < luminal).
2. Chemosensitivity profiling of breast cancer cell lines (D-matrix)
The dataset from Garnett et al. [7] was used to examine the chemosensitivity of breast cancer cell lines. The dataset originally included 111 drugs and 43 breast cancer cell lines; however, cell lines and drugs with more than 50% missing data were excluded. Thus, 98 drugs and 31 breast cancer cell lines from this dataset were used in this study. The IC50 scores were standardized due to the large variation in the scale of IC50 scores for different drugs.
When unsupervised hierarchical clustering was applied to the dataset, there was no association between drug sensitivity and cell line (Fig. 3).
Patterns of standardized IC50 scores in 31 breast cancer cell lines. The vertical and horizontal axes represent 98 drugs and 31 breast cancer cell lines, respectively.
Each column represents a cell line, and each row represents the IC50 score for the particular compound. Both rows and columns are clustered hierarchically. Yellow color represents high IC50 score (resistant), orange color represents low IC50 score (sensitive), and white indicates absence of data.
As shown in Fig. 3, no clear relationship was observed between drug sensitivity and breast cancer cell line. The cell lines CAL51 and MCF7 were sensitive to most drugs (orange color represents low IC50 scores), compared to other cell lines. By contrast, UACC812 was resistant to most drugs, though it should be noted that there were several drugs which did not include IC50 scores.
To examine the relationship between gene expression and drug sensitivity in detail, we selected four drugs, mitomycin, doxorubicin, gemstabine and obatoclax mesylate, all of which have been used for the treatment of breast cancer.
Unsupervised hierarchical clustering showed an association between drug sensitivity and cell line (Fig. 4).
Patterns of standardized IC50 of four drugs in 31 breast cancer cell lines. The vertical and horizontal axes represent four drugs and 31 breast cancer cell lines, respectively.
The cell lines were divided into three groups by unsupervised hierarchical clustering, which were independent of breast cancer subtype, indicating that drug sensitivity is associated with specific gene expression rather than subtype of breast cancer.
Given this association pattern, doxorubicin was selected as a specific drug for implementing the drug sensitivity prediction model. Doxorubicin, which was discovered in 1969 by Farmitalia Research Laboratories in Italy, is used in treatment of early-stage or node-positive breast cancer, HER2-positive breast cancer, and metastatic disease. The first two cell line groups were sensitive to doxorubicin while the third was resistant, as shown in the tree diagram (Fig. 4).
3. Correlation between drug sensitivity and gene expression (DG-matrix)
For screening of the genes associated with chemosensitivity, the databases for gene expression and for chemosensitivity were integrated into one database matrix (DG-matrix) using the Pearson correlation coefficient. Using the DG-matrix, hierarchical clustering was performed based on the correlation between drug sensitivity and gene expression (Fig. 5).
DG-matrix. Correlation pattern of 638 gene expressions and standardized IC50 scores of 98 drugs. The vertical and horizontal axes represent 638 genes and 98 drugs, respectively. Correlation coefficients range from –1 to 1.
Significantly expressed genes among subgroups of breast cancer cell lines were used to examine the association of gene expression and drug sensitivity. Several sectional blocks (indicated by orange and yellow) are shown in Fig. 5, suggesting a relationship between gene expression and drug sensitivity. The orange and yellow colors represent the negative and positive relationship between gene expression and drug sensitivity, respectively. Therefore, it can be interpreted that the drugs shown in the dashed box could be sensitive when the genes shown in the box are overexpressed (negative relationship).
It also shows that the genes related to subtypes of breast cancer cell lines are also related to drug sensitivity. Therefore, implementation of a drug sensitivity prediction model using gene expression data is reasonable, as gene expression differs between subtypes of breast cancer.
4. Selection of genes associated with drug-specific chemosensitivity
Correlation coefficients and their significance of both gene expression and IC50 scores in the four drugs were calculated. Drug sensitivity-related genes were identified as having correlation coefficients of ≥|0.7| with drug-specific chemosensitivity. The results are listed in Table 2. Fifteen genes showed strong correlation with the IC50 score of each drug.

List of the top-ranked genes which showed positive or negative association with drug-specific chemosensitivity for four drugs
Genes showing strong correlation with specific drug sensitivity for implementing the drug sensitivity prediction model were selected.
5. Drug sensitivity prediction model using gene expression
In implementing our prediction model for sensitivity to doxorubicin, 10 genes were used as predictive variables. Five genes showed positive correlation with drug sensitivity and the other five genes showed negative correlation (Fig. 6).
The relationship between expressions of doxorubicin-related genes and drug sensitivity of doxorubicin (A) and mitomycin (B). The horizontal and vertical axes represent the standardized IC50 scores and gene expressions, respectively.
As shown in Fig. 6, doxorubicin-related genes showed strong association with sensitivity to doxorubicin (|r|> 0.77, p < 0.001) but were not associated with sensitivity to mitomycin (|r|< 0.45, p > 0.05). This result indicates that the drug sensitivity model can be implemented for each specific drug and the genes related to it.
The optimal prediction model was identified by backward estimation in linear regression, and the final model included PARVA, TBX21, SHF, and FAM158A as predictors. The expression data of the four genes were combined to reduce the number of predictors. Combined gene expression was calculated by PCA.
We compared the significances of two models, one using four independent genes and the other using the combined gene expression (Table 3).
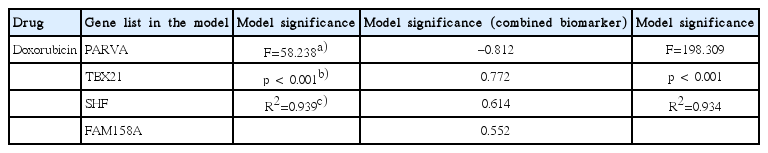
Comparison of model significances in cases using four individual genes and a combined gene expression
A combined biomarker was calculated by linear, weighted combination of the four genes. The two models were similar in p-value and R2, and the F value was significantly increased when a combined biomarker was used. Hence, the combined biomarker is reliable in our drug sensitivity prediction model.
Sensitivity to doxorubicin was associated with up-regulation of TBX21, SHF, and FAM159A. The combined factor showed a strong negative association with doxorubicin IC50 score. These results indicate that the more up-regulated the expression of these genes, the more sensitive the cells are to doxorubicin. Different color points represent subtypes of breast cancer cell lines. Breast cancer subtype was not found to be a predictive factor in this study (Fig. 7).

Association of gene expressions and chemosensitivity to doxorubicin in breast cancer. Doxorubicin represents IC50 scores against doxorubicin and combined biomarker represents combined gene expression.
Discussion
Development of a method to predict what drug will be most effective in each case is needed in order to reduce the unpleasant side effects of chemotherapy for breast cancer patients. We suggest a prediction method using combined gene expression. This method is based on linear regression with IC50 scores of doxorubicin as the response variable. A statistical method was applied to reduce the number of predictors in the regression model so that the model is useful even in a small dataset.
The number of predictive variables has a significant influence on sample size and statitical power [21]. As the number of predictive variables is increased, the sample size must also be increased. Therefore, PCA was applied to reduce the number of predictive variables by combining several predictors.
By combining gene expression profiling with drug sensitivity data, we examined a large set of possible gene-drug relationships. These two datasets, which include gene expression and drug sensitivity, were derived from the public database (GEO database) and a previously published dataset [8]. Previous results showed that breast cancer is comprised of molecularly distinct subtypes that may respond differently to targeted therapies [22]. However, in this study drug sensitivity was related to gene expression rather than subtype of breast cancer cell lines.
Scherf et al. [8] reported that clustering of cell lines on the basis of gene expression yielded relationships that were very different from those obtained by clustering cell lines based on their response to drugs. This is in accordance with our study. However, a strong relationship was observed between gene expression and drug sensitivity, indicating that drug sensitivity can be predicted by gene expression data.
Various statistical and computational methods have been previously applied for prediction of IC50 scores [10-12]. When the statistical method is used for predicting chemosensitivity, sample size can be a very influential factor for achieving high statistical power, and sample size depends on the number of predictors in the linear regression method, which can be used for predicting numeric dependent variables (e.g., IC50).
Therefore, our aim in this study was not to suggest a novel prediction method, but rather to show that the performance of a prediction model can be improved by reducing the number of predictors. PCA was used to reduce the number of predictors and to identify a combined gene expression profile.
The performance of the prediction model using combined gene expression was better than that of the model using several independent gene expressions. Model significance was improved when combined gene expression was used as a predictive variable.
The discovery of biomarkers of breast cancers has led to development of treatment strategies for breast cancer patients. Identification of combined gene expression profiles is expected to contribute to more personalized menagement of breast cancer patients and to improve existing therapies and it will be helpful in finding new therapies by identifying more predictive biomarkers. It can also be extended to other chemotherapeutic treatments and other cancer types.
Conclusion
The advantage of the proposed method is that the prediction model can be implemented with a relatively small sample dataset by reducing the number of predictive variables. A limitation of this study is that we did not consider the subtypes of breast cancer cell lines in our prediction model. With more available data, subtype of breast cancer should be considered as a predictive factor, even though it was not associated with drug sensitivity in this study. Our further study will include the validation of the result using an independent dataset and extension of the proposed method to other cancer types.
Notes
Conflict of interest relevant to this article was not reported.
Acknowledgements
This study was supported by a faculty research grant of Yonsei University College of Dentistry for 2015 (6-2015-0003).