Public Perceptions on Cancer Incidence and Survival: A Nation-wide Survey in Korea
Article information
Abstract
Purpose
The aim of this study was to compare the public perceptions of the incidence rates and survival rates for common cancers with the actual rates from epidemiologic data.
Materials and Methods
We conducted a survey of Korean adults without history of cancer (n=2,000). The survey consisted of questions about their perceptions regarding lifetime incidence rates and 5-year survival rates for total cancer, as well as those of eight site-specific cancers. To investigate associated factors, we included questions about cancer worry (Lerman’s Cancer Worry Scale) or cared for a family member or friend with cancer as a caregiver.
Results
Only 19% of Korean adults had an accurate perception of incidence rates compared with the epidemiologic data on total cancer. For specific cancers, most of the respondents overestimated the incidence rates and 10%-30% of men and 6%-18% of women had an accurate perception. A high score in “cancer worry” was associated with higher estimates of incidence rates in total and specific cancers. In cancers with high actual 5-year survival rates (e.g., breast and thyroid), the majority of respondents underestimated survival rates. However, about 50% of respondents overestimated survival rates in cancers with low actual survival rates (e.g., lung and liver). There was no factor consistently associated with perceived survival rates.
Conclusion
Widespread discrepancies were observed between perceived probability and actual epidemiological data. In order to reduce cancer worry and to increase health literacy, communication and patient education on appropriate risk is needed.
Introduction
The incidence rate of cancer is increasing in developing countries, but the 5-year survival rate of cancer is also increasing, since the diagnosis and treatment of cancer has improved enormously worldwide [1,2]. South Korea is no exception. According to an analysis of cancer statistics in Korea from 2011, the lifetime cumulative cancer incidence rates are 38.1% for men and 33.8% for women, and 5-year survival rates are 57.6% for men and 75.2% for women, for all cancers. Both incidence and survival rates have been increasing consistently over the past 10 years in Korea [2,3]. However, cancer is regarded as one of the most feared diseases among the general population around the world [4,5]. A cancer diagnosis imposes a serious psychological burden and there is widespread belief that “cancer” implies with an unpleasant, painful death [6].
Health literacy is defined as the ability to access, understand, appraise, and communicate information in order to apply health information to promote and maintain good health outcomes [7]. More than 40% of US adults (ages 25 and older) were found to have limited health literacy [8]. Health numeracy, referred to as quantitative literacy, is “the degree to which individuals have the capacity to access, process, interpret, communicate, and act on numerical, quantitative, graphical, biostatistical, and probabilistic health information needed to make effective health decisions.” Low numeracy may adversely affect risk comprehension and medical treatment [9]. Having limited literacy or numeracy affects risk factors for poor health [10].
Perceived risk is regarded as the subjective judgment, without foundation in objective data, of the degree of risk. Risk perception for cancer, with regard to health literacy, plays an important role in participating in preventive action. The level of health literacy or numeracy and an individual’s perceived risk for cancer predict attitudes toward cancer related health behaviors and the likelihood of taking appropriate and timely healthcare action [11]. A “fear” of cancer is associated with a negative attitude toward early detection and may be a barrier to participation in cancer screening [12]. In seeming paradox, people with higher perceived cancer risk are more likely to participate in cancer screenings [13].
Some studies have examined perceived cancer risks and related factors in Europe [14] and the United States [15]. However, few studies have been carried out on perceptions of the incidence and survival of different and total cancers among the Korean general population. The aim of this study was to determine public perceptions of lifetime cumulative incidence rates and 5-year survival rates for common cancers with disparate prognoses and to compare perceived risk with known cancer incidence and survival rates from epidemiologic data. Furthermore, we explored what factors may influence public perceptions of cancer incidence and prognoses.
Materials and Methods
1. Study design and subjects
This study was performed as part of the survey, “Awareness of the quality of cancer treatment among the general population in Korea” between November and December 2012. As the title indicates, this study was conducted to explore the perception of cancer incidence rates and the survivability of cancer among the general population. The nationwide health survey was conducted through face-to-face interviews at participants’ homes by trained interviewers from November 1, 2012 to December 1, 2012.
The survey applied a stratified probability sampling design from the South Korean population using a two-stage systematic sampling method. After stratifying by the region, we systematically extracted samples according to population ratio. Inclusion criteria were as follows: (1) general population aged between 40 and 70; (2) general population who had not been diagnosed with any cancer were capable of completing a questionnaire without assistance. The sampling error within 95% confidence interval was ±2.2%. Four thousand eight hundred and fifty-one Korean adults were contacted and of these survey candidates, 2,000 people completed the survey questions (response rate, 41.2%).
2. Questionnaires and preparation
Socio-demographic data including age, sex, smoking history, alcohol consumption, educational level, religious status, and marital status were obtained from the questionnaires.
Participants were also asked about factors that might be related to public perceptions of cancer, such as cancer worry, having cared for a family member or friend with cancer as a caregiver, and having a disease other than cancer.
Cancer worry was assessed by averaging responses to four Likert scale items adapted from Lerman’s Cancer Worry Scale (1, not at all or rarely; 2, sometimes; 3, often; and 4, a lot or all the time). The questions addressed the frequency of cancer worry, the impact of worry on mood, the impact of worry on daily functioning, and the level of cancer concern (alpha, 0.70) [16].
The survey questionnaire assessed respondents’ perceived lifetime incidence rate and 5-year survival rate for cancer in general as well as for eight site-specific cancers (stomach, lung, liver, colorectal, breast [women], uterine cervix [women], thyroid [women], and prostate [men]).
To assess perception of the lifetime cancer incidence rates among the general population, we asked the participants the following open-ended question: “What would you estimate is the average Korean person’s likelihood of being diagnosed with cancer in their lifetime?” Participants answered the question for each cancer using probability estimates.
To assess perceptions of the 5-year cancer survival rate, we asked participants the following open-ended question: “What would you estimate is the likelihood of 5-year survival after being diagnosed with cancer?” Participants answered the question for each cancer using probability estimates.
3. Statistical analysis
The participants’ baseline socio-demographics are described using frequency and percentages or median values. Descriptive statistics were used to describe responses to the questions regarding incidence and survival rates.
We categorized participants into three groups according to their perceptions of lifetime cancer incidence or 5-year survival rates: the accurate estimation group (participants’ responses in the ±5% range of actual cancer incidence or survival statistics were regarded as accurate), the underestimation group (incidence and survival estimates were lower than the accurate range), or overestimation group (incidence or survival estimates higher than the accurate range). For example, when the actual survival rate of total cancer was 57.6% in men, we regarded the range of accurate estimation as 52.6%-62.6%. Associations between participants’ perceptions of incidence or survival and potential factors, such as cancer worry or having cared for a family member or friend with cancer as a caregiver, were analyzed using a multinomial regression model.
In order to control of type 1 error in the analysis of multiple comparisions, the Bonferroni correction was used.
All statistical analyses were conducted using STATA ver. 12.0 (STATA Corp., College Station, TX).
4. Ethics approval
The purpose of the study was explained to all of the participants and informed consent was procured. All data were self-reported by participants.
This study was approved by the Institutional Review Board of the National Cancer Center, Korea
Results
1. Participant characteristics
Two thousand participants completed the survey. Table 1 shows participants’ basic characteristics. The median age was 52 years old and 51% were women. Most of the participants were married, and 84% of women and 79% of men carried private cancer insurance. Approximately 40% of the men and women had a family member or friend with a history of cancer.
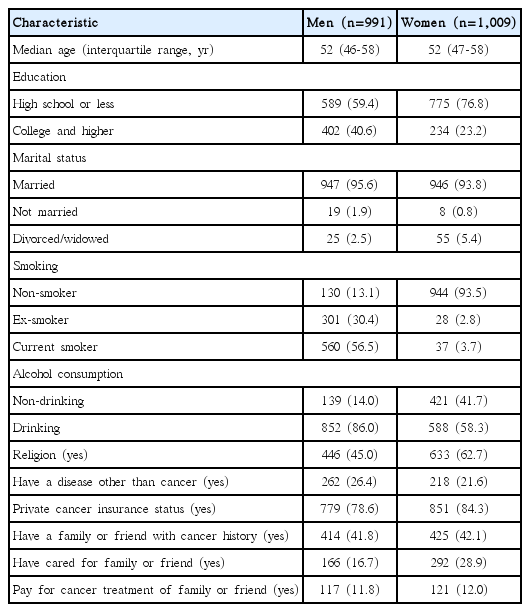
Subject demographics
2. Perception of lifetime cumulative cancer incidence rates in general population
Table 2 and Fig. 1 show the perceived lifetime cumulative incidence rate of total cancer, as well as those of eight site-specific cancers in the Korean general population.

Perceived lifetime cumulative incidence rates compared to actual rates

Distributions of participants’ perceptions of the lifetime, cumulative incidence rate by cancer site. The red vertical line in each figure indicates the actual incidence rate for each cancer based on an analysis of cancer statistics in Korea from 2011.
Widespread discrepancies were observed between the perception of probability and the actual epidemiological data regarding cumulative cancer incidence rates. The actual lifetime cumulative incidence rates of total cancer, based on an analysis of cancer statistics in South Korea from 2011, are 38.1% in men and 33.8% in women [2]. Defining accurate estimation rate as in the range of ±5% of the actual incidence of total cancers (men, 33.1%-43.1%; women, 28.8%-38.8%), only 19% of men and women came close to this actual incidence rate. Korean men have a lifetime cumulative incidence rate of less than 10% for five specific cancers (stomach, lung, liver, colon, and prostate) (Table 2). When we considered the accurate estimation rate in the range of ±5% that focused on actual incidence of specific cancers (except 0%), most respondents overestimated lifetime cancer incidence rates (e.g., men: stomach cancer, 80.7%; lung cancer, 70.6%; and prostate cancer, 85.9%; women: stomach cancer, 93.0%; lung cancer, 88.0%; breast cancer, 82.0%; and cervical cancer, 92.8%). Approximately 10%-30% of men had accurate perceptions of the five specific cancers. Korean women have a lifetime cumulative incidence rate of less than 5% for five specific cancers (stomach, lung, liver, colon, and uterine cervix), 5.3% for breast cancer, and 12.1% for thyroid cancer (Table 2). When perceived rates of actual cancer incidence in the range of ±5% (except 0%) were regarded as accurate, a significantly low proportion of women respondents (6%-18%) had accurate perceptions for seven specific cancers.
Table 3 shows the results of multinomial regression analyses regarding factors that potentially affect public perceptions of lifetime, cancer incidence rates. For both men and women, respondents who are current drinkers were significantly more likely to provide higher estimates on incidence rates for total cancer. For men, a high score of cancer worry was inversely associated with underestimation. Respondents who had a high score of cancer worry or had cared for family or a friend as a caregiver were significantly more likely to provide higher estimates of incidence rates for total cancers in women.

Factors possibly affecting participants’ perceptions of lifetime cumulative incidence rates of cancer
High scores of cancer worry were associated with higher estimates of all specific cancers in male respondents. For women, the association between cancer worry scores and higher cancer incidence estimates was significant in several specific cancers such as lung cancer, liver cancer, breast cancer, and uterine and cervical cancer.
3. Perceptions of 5-year cancer survival rates in the general population
Table 4 and Fig. 2 show the perceived 5-year survival rates of total cancer and specific cancers in the Korean general population. Widespread discrepancies were observed between perceptions of survival for each cancer and actual 5-year survival rates according to cancer statistics in Korea from 2011. In cancers with high actual survival rates (stomach, colon, breast, uterine cervix, thyroid, and prostate), the majority of respondents underestimated 5-year survival rates in cancer. However about 50% of respondents overestimated 5-year survival rate in cancers with low actual survival rates (lung and liver).
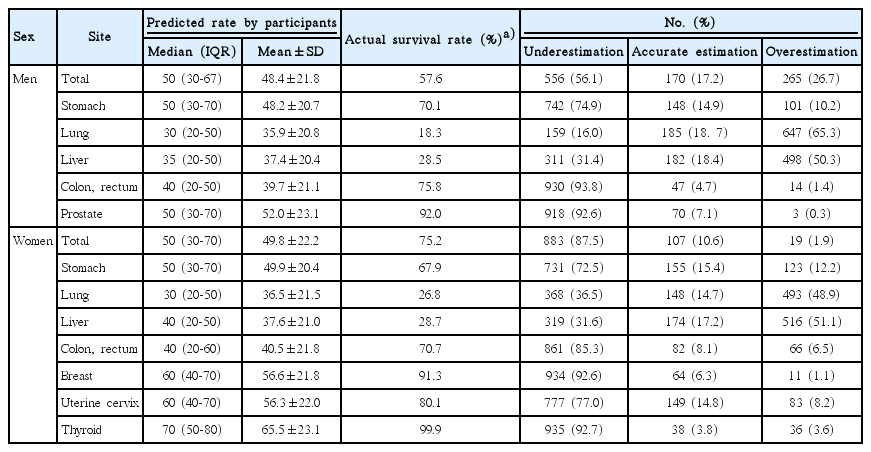
Participants’ predicted 5-year survival rates compared with actual rates
Distributions of participants’ perceptions of the 5-year survival rate by cancer site. The red vertical line in each figure indicates the incidence rate for each cancer based on an analysis of cancer statistics in Korea from 2011.
There was no consistent association between any single factor and respondents’ perceptions of 5-year survival rates for each cancer (Table 5).
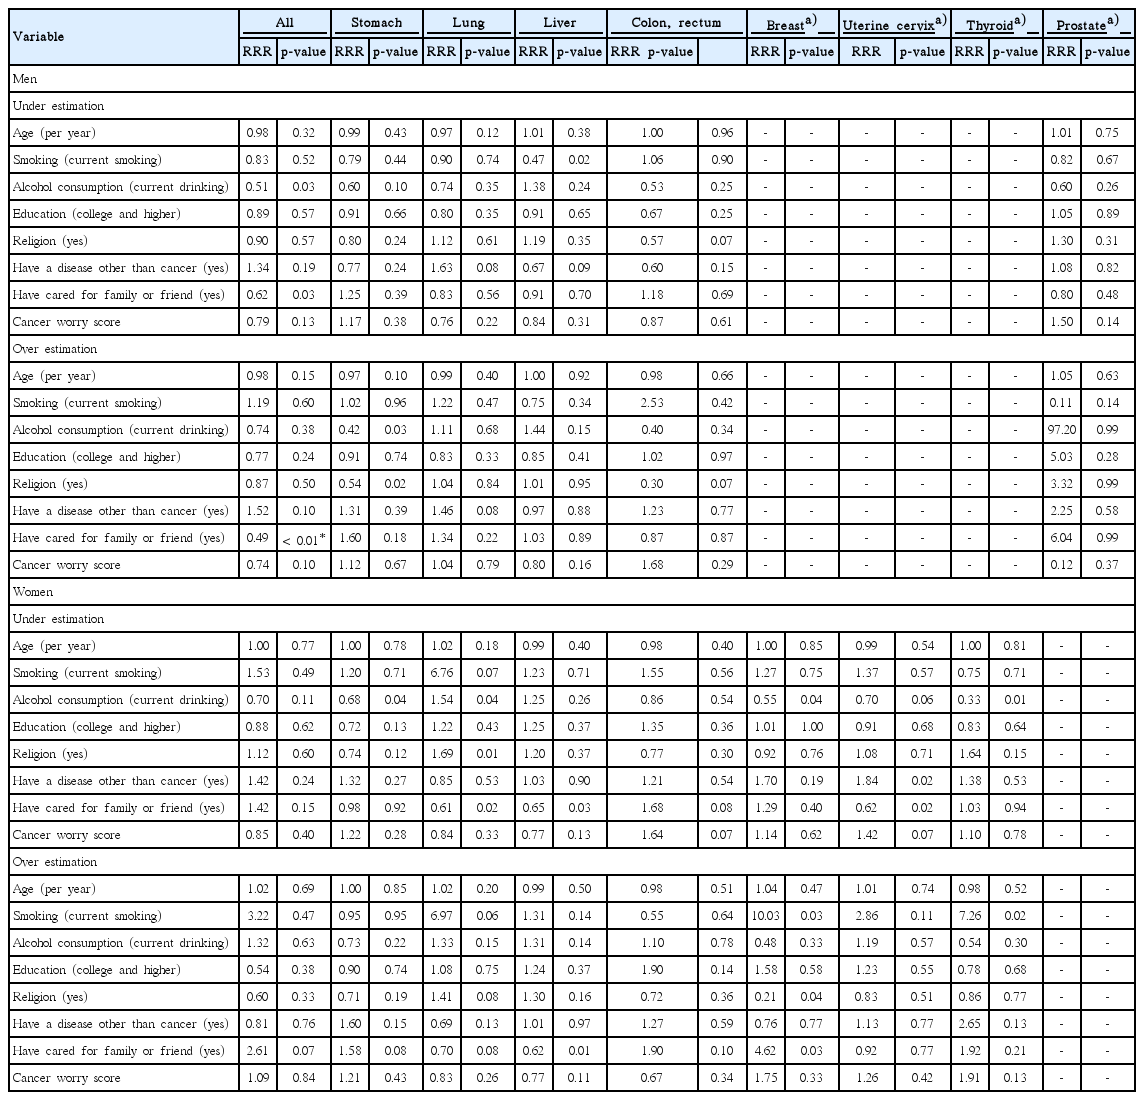
Factors possibly affecting participants’ perceptions of survival rates of total cancer and eight specific cancers
Discussion
To our knowledge, this is the first study to assess the perception of incidence and survival rates of eight common cancers and total cancer in the Korean general population. The use of numerical ratings of probability for cancer incidence and survival rates has the advantage of making it possible to compare the values with a “true” rate. In addition, this study investigated perceived risks in relation to common cancer sites, thereby enabling comparisons across the various types of specific cancers.
The perceived lifetime cumulative incidence rate of each cancer was significantly overestimated. Previous research found that 65% of women overestimated the incidence of breast cancer in Australia [17], and 66% of German women inaccurately estimated breast cancer incidence [18]. Our findings were consistent with these previous studies.
Lifetime cumulative incidence rate of total cancer should be the sum of incidence rates of each cancer. However, our results showed that the sum of the perceived incidence rates for each cancer was higher than that of total cancer. Furthermore, there was not a significant disparity between perceived incidence rates of each cancer and that of total cancer. Respondents did not distinguish the meaning between total cancer and specific site cancer. Our results suggested a high prevalence of low health literacy regarding the meaning of each cancer and low numeracy in terms of cancer incidence among the Korean population.
In our study, high estimates of incidence rates in total cancer, as well as the eight specific cancers, were significantly associated with high scores on cancer worry. Previous studies also showed that cancer risk perceptions were positively related to cancer worry. Fear of cancer is one of the factors that can lead to delays in seeking medical treatment and health promotion activities [19]. Providing people with accurate information about cancer can help them to accurately assess their cancer risk and reduce excessive worry and anxiety [20].
There were discrepancies between perceptions of survival and actual 5-year survival rates. The majority of both men and women tend to underestimate 5-year survival rates in cancers with relatively high actual survival rates such as cancers of the stomach, colon, breast, uterine cervix, thyroid, and prostate. Half of the respondents overestimated 5-year survival rate in cancers with relatively low actual survival rates, such as lung and liver cancer. A British population-based research study showed a tendency to underestimate breast cancer survival and overestimate lung cancer survival [14]. Perceived survival rates for lung cancer and leukemia, which have low actual survival rates, were overestimated in Australian adults [21]. Our findings were consistent with previous research. This may be associated with a tendency to avoid extremes on rating scales [14,22], and because the general population did not distinguish among cancers in terms of outcomes.
In our study, we could not find any factor with a consistent correlation with the respondents’ perceptions of 5-year survival rates for each cancer. Research from Japan showed that older respondents significantly overestimate 5-year survival rates for some cancers (e.g., thyroid, breast, cervix, prostate, colorectal, and stomach). Female respondents overestimate survival rates for other types (e.g., prostate and cervix), and a history of having a family member or friend with cancer was associated with survival rates for still other types (e.g., breast, prostate, cervix, colorectal, and stomach) [23]. However, consistent with our study, the pattern of association was not uniform across cancer types. While we also found that several factors are associated with underestimation or overestimation of cancer survival in total and specific cancers (e.g., have cared for family or a friend with cancer as a caregiver or have a high level cancer worry), they were not consistent across cancer types.
An often-overlooked problem in all areas of cancer communication is health literacy and numeracy. Patients are frequently assumed to have difficulty understanding health statistics such as numeric estimates of risk [24]. In addition, numeracy influences how individuals interpret medical risk information [10]. Excessive worry about cancer risks or prognosis can lead to unhealthy behaviors such as avoidance of cancer screenings [25]. Thus, it is important to reiterate that appropriate risk communication and patients’ education on health information is needed to increase health literacy and reduce cancer worry.
Conclusion
This study investigated widespread discrepancies between public perceptions and known cancer risks regarding lifetime incidence and survival rates. We found low numeric skills for cancer risk among Koreans in the general population. It is our belief that the findings of our study are important to physicians, particularly for communicating cancer risk and prognoses to the public and to patients. More efforts in risk communication and education on understanding medical information should be made to reduce these discrepancies. Such efforts would contribute to reasonable decision-making in cancer prevention and treatment and eliminate unnecessary fear of cancer.
Notes
Conflict of interest relevant to this article was not reported.
Acknowledgements
This work was supported by a grant of the National R&D Program for Cancer Control (No. 1210150).