Prognostic Significance of Defining L-Cell Type on the Biologic Behavior of Rectal Neuroendocrine Tumors in Relation with Pathological Parameters
Article information
Abstract
Purpose
In 2010, the World Health Organization categorized L-cell type neuroendocrine tumors (NETs) as tumors of uncertain malignancy, while all others were classified as malignant. However, the diagnostic necessity of L-cell immunophenotyping is unclear, as are tumor stage and grade that may guide diagnosis and management. To clarify the predictive markers of rectal neuroendocrine neoplasms (NENs), 5- and 10-year overall survival (OS) was analyzed by pathological parameters including L-cell phenotype.
Materials and Methods
A total of 2,385 rectal NENs were analyzed from our previous multicenter study and a subset of 170 rectal NENs was immunophenotyped.
Results
In univariate survival analysis, tumor grade (p < 0.0001), extent (p < 0.0001), size (p < 0.0001), lymph node metastasis (p=0.0063), and L-cell phenotype (p < 0.0001) showed significant correlation with the prognosis of rectal NENs; however, none of these markers achieved independent significance in multivariate analysis. The 10-year OS of tumors of NET grade 1, < 10 mm, the mucosa/submucosa was 97.58%, 99.47%, and 99.03%, respectively. L-Cell marker, glucagon II (GLP-1&2), with a cut off score of > 10, is useful in defining L-Cell type. In this study, an L-cell immunophenotype was found in 83.5% of all rectal NENs and most, but not all L-cell type tumors were NET G1, small (< 10 mm) and confined to the mucosa/submucosa.
Conclusion
From these results, the biological behavior of rectal NENs does not appear to be determined by L-cell type alone but instead by a combination of pathological parameters.
Introduction
A remarkably increasing incidence of gastroentero-pancreatic neuroendocrine neoplasms has been reported over the past several decades throughout the world [1-10]. In our previous nationwide study, we showed that the incidence has also been increasing in Korea over the last decade [3]. The most significant increase was found in the rectum, particularly for well-differentiated neuroendocrine tumors (NETs). In fact, the most common neuroendocrine neoplasm (NEN) site in Korea is the rectum, similar to that reported in Japan [7]. Recently the Surveillance Epidemiology and End Result (SEER) data of United States [5] and data of European Neuroendocrine Tumor Society (ENETS) [11] also described remarkable increases in the incidence of rectal NETs, although the most common site in western countries remains the small intestine [6]. The increasing incidence of rectal NETs in Korea may relate to ascertainment bias from an increasing awareness of this tumor and improved availability of endoscopy, although a true increase in incidence cannot be excluded. Rectal NETs are usually small and often incidentally discovered on endoscopy. Simple endoscopic excision is the typical mode of treatment. The prognosis for this type of local disease is known to be excellent [5,11]; however, confusion arises in cancer registries and over medical insurance compensation, particularly in relation to the 2010 World Health Organization (WHO) classification recommendations.
The WHO updated the classification of these tumors in 2010 and categorized them all as malignant, except for L-cell type and tubular NETs [12], which were designated as having uncertain malignant behavior. L-Cell NENs that are glucagon like peptide (GLP) or PP/PYY producing tumors have been approved for classification as uncertain malignancy by the International Agency for Research on Cancer (IARC)/WHO Committee for International Classification of Disease for Oncology, third edition (ICD-O3) in 2010 [12]. Coding of these tumors according this classification greatly affects the results of cancer registration and implicates L-cell phenotyping of NENs for pathology reports. Potential issues are raised because the diagnostic criteria for L-cell phenotyping are not clear-cut and the relation to other well-known prognostic factors, such as tumor grade, size, and depth remain unclear. As a practical point, this difference in classification has created confusion in the diagnosis, management, and coding of small rectal NETs that are < 10 mm, have low mitoses (WHO G1, < 2 mitosis/10 high-power field [HPF]), confined to the mucosa-submucosa and lacking additional risk factors. These lesions were formerly categorized as benign by the 2000 WHO system; however they should be classified as malignancy if it is not confirmed as L-cell type by the 2010 WHO classification. However, the National Comprehensive Cancer Network (NCCN) clinical practice guidelines recommend simple excision of small NETs [13], irrespective of lymphatic invasion or cell type of origin. Lee et al. [14] recently reported that 79% of rectal NETs were immunohistochemically defined as L-cell type but they showed no clinical significance for L-cell type in their reported rectal NETs.
In our previously published large nationwide multicenter study, rectal NENs showed the best prognosis among all gastroenteropancreatic (GEP)-NENs. However, it was unclear whether or not cell of origin affected the prognosis because information on cell type was unavailable in that study.
Here questions arise about the necessity of L-cell type immunophenotyping in daily practice for better prediction of patient’s prognosis. In addition, it is unclear whether small rectal (WHO G1) NETs by the 2010 WHO classification should be categorized as malignant, if not of L-cell type. To investigate these uncertainties, we analyzed the prognostic significance of L-cell phenotype in rectal NETs, along with previously known factors affecting biologic behavior, to assess the validity of malignancy criteria of rectal NENs.
Materials and Methods
1. Patient selection and pathological parameters
Rectal NENs from the nationwide Korean multicenter data of our previous publication were studied [3]. For survival analyses, follow-up data were collected from the National Cancer Registration Center. This protocol was reviewed and approved by the Institutional Review Board of Kangbuk Samsung Hospital (approval No. KBC13067).
Inclusion criteria required pathologically confirmed rectal NENs from January 1, 2000, to December 31, 2009. Exclusion criteria included adenocarcinomas with focal neuroendocrine differentiation. If a NEN underwent subsequent excision or surgical resection following an initial biopsy, the biopsy report from the same case was excluded in order to eliminate duplication of cases. Pathologic parameters analyzed included tumor size, grade, extent, lymph node metastasis, and patient survival.Tumor grading was based on mitotic count or Ki-67 labeling index as NET G1 or NET G2 recommended by the 2010 WHO classification [12]. However, neuroendocrine carcinoma (NEC) was diagnosed for poorly differentiated tumors with high grade small or large cell cytology with organoid features and neuroendocrine immunophenotyping, regardless of the mitotic counts. The extent of tumor was evaluated according to the 2010 American Joint Committee on Cancer (AJCC) tumor staging manual [15]. Lymph node metastasis was coded as either present or absent. Maximum tumor size was assessed in mm’s and grouped by 5-mm intervals (1, 1-4 mm; 2, 5-9 mm; 3, 10-14 mm; 4, 15-20 mm; and 5, > 20 mm).
2. Immunohistochemistry for L-cell phenotype
A total of 170 rectal NENs with available paraffin blocks and follow-up information were selected from among the nationwide data due to the limitation of the resource. To assess the relation of L-cell phenotype with other pathologic parameters and biological behavior, we included as many cases treated by surgical resection with lymph node dissection as possible, regardless of tumor grade and added cases of NET G1 treated by local excision. For comparison, 50 gastric NENs, 32 small intestinal NENs, and 22 colonic NENs were also evaluated. An auto-stainer (Benchmark XT, Ventana Medical Systems, Roche, Tucson, AZ) minimized technical and sampling error. The UltraView Universal DAB Detection Kit was used for immunohistochemical (IHC) staining. Three different primary antibodies were used for L-cell immunophenotyping: glucagon I (GLP-1, Roche), glucagon II (GLP-1&2, LifeSpan Bioscience, Seattle, WA), and PYY (Sigma, St. Louis, MO). The steps are briefly described as follows. Paraffin-embedded tissue sections from well representative blocks were deparaffinized with xylene and rehydrated through graded alcohol solutions. Antigen retrieval consisted of warming the slide to 75°C (4 minutes), and application of cell conditioning solution No. 1 (60 minutes). Endogenous peroxidase was blocked by applying UV inhibitor (4 minutes). After washing with reaction buffer, primary antibody was applied (2 hours) in a autostainer. Slides were then rinsed with reaction buffer and added one drop each of HRP UNIV MULT, DAB, and DAB H2O2 (Ventana Medical Systems, Roche) (8 minutes each). Slides were then treated with one drop of COPPER (4 minutes) before counterstaining with hematoxylin (4 minutes). Interpretation of IHC staining for glucagon I, glucagon II, and PYY was separately evaluated based on the staining intensity (1, weaker than normal control; 2, strong as control) and distribution (% of positive cells). And then they were multiplied for an immunoscore (0-200), that was grouped as 0 (< 10), 1 (10-50), 2 (51-100), or 3 (> 100). The results were interpreted as negative (score group 0) or positive (score groups 1-3). The immunostaining results were evaluated independently by two pathologists blinded to the patients’ clinical and pathologic information. L-Cell type was determined if the sample was immunohistochemically positive (immunoscore > 10) for one or more markers [14].
3. Statistical analysis
Data were presented as numbers (%) for categorical variables. In survival analysis, we excluded cases that only underwent small biopsy. To estimate the association between eligible variables and mean overall survival time, the Kaplan-Meier test was applied together with the log-rank test for comparison of various groups. The 5- and 10-year overall survival rates in each parameter were evaluated. A Cox proportional hazard regression was performed adjusting for gender and age to determine the independent prognostic factor and the significance was determined at 95% confidence level. PASW ver. 18.0 (SPSS Inc., Chicago, IL) was used for statistical analyses. A p-value of < 0.05 was considered statistically significan.
Results
1. Pathological characteristics of rectal NENs in Korea
Among 4,951 GEP-NENs in our previous nationwide data of Korea, there were 2,385 rectal NENs (48.17%) [3]. The mean age of the rectal NEN patients was 52.13±11.77 years old and the sex ratio (male:female) was 1.58:1. The pathological parameters are shown in Table 1. Follow-up data were available in only 1,621 patients and the mean survival duration was 50.93±30.16 months. Among the total rectal NENs, lymph node metastasis was confirmed in 76 cases (3.19%); however, most tumors were treated by endoscopic mucosal resection because they were small WHO NET G1 tumors confined to the mucosa-submucosa, in which case lymph nodes were not resected or examined.
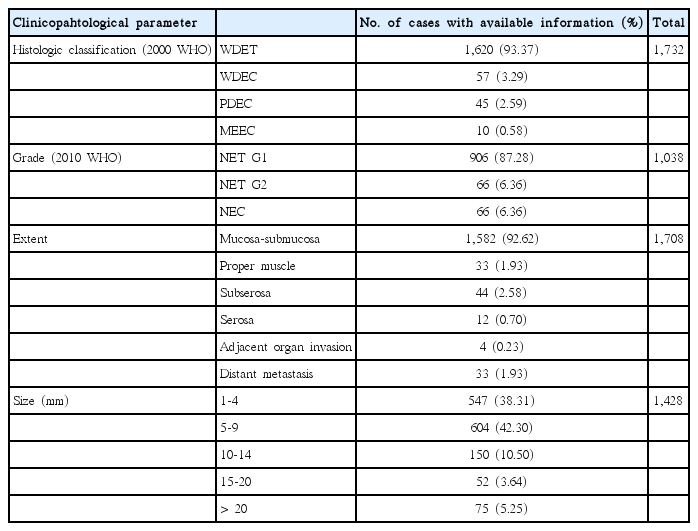
The number of rectal NENs from available recorded information by the pathological parameter collected from the nationwide multicenter data
2. Prognostic significance of pathological parameters in rectal NENs
In survival analysis, mean survival time according to the tumor grade was 74.01±0.27 months for G1, 43.14±1.62 months for G2, and 24.85±2.28 months for G3 (p < 0.0001). The tumor extent showed prognostic significance (p < 0.0001) and mean survival time was the longest in tumors confined to the mucosa and submucosa (66.05±0.15 months) and shortest in tumors with adjacent organ invasion (22.08±3.60 months) while that in tumors with distant metastasis was 35.07±2.55 months (p < 0.0001). The size of tumor was significantly correlated with patient’s survival and the size group of 10-14 mm showed the longest mean survival time (64.90±0.66 months) in contrast to the shortest in the size group of 15-20 mm (26.08±0.57) (p < 0.0001). Mean survival time according to lymph node metastasis was 33.66±1.81 months for the node positive group, in contrast to 71.35±2.90 months for the negative group (p=0.0063). Five- and 10-year OS according to the pathological parameters are shown in Fig. 1. The 10-year OS of patients with tumors < 10 mm was more than 99%, while that of patients with tumors ≥ 20 mm was 35.5%. In multivariate analysis, none of the variables of tumor size, extent, grade, or lymph node metastasis showed independent prognostic significance.
Five- and 10-year overall survival rates in patients with rectal neuroendocrine neoplasms (NENs) according to the grade (A), size group (B), lymph node (LN) metastasis (C), extent (D) and L-cell type (E). Rectal neuroendocrine tumors (NETs) with < 2 mitoses per 10 high-power field’s (World Health Organization G1), confined to the mucosa-submucosa, with no lymph node metastases, and of L-cell type showed excellent prognosis. In particular, 10-year survival rate of NETs G1 confined to mucosa-submucosa was more than 99%.
Lymph node metastasis showed significant correlation with tumor grade (p=0.0069), extent (p=0.0273), and size (p=0.0039). Among 774 NET showing G1 and < 10 mm, eight cases were confirmed as having lymph node metastasis. Although the lymph node negative group showed significantly better survival compared to node positive patients when all samples were analyzed (p < 0.0063), there was no significant survival difference between them if cases of NET G1 and G2 were selectively analyzed (mean survival time±standard deviation: 40.49±2.48 months for positive group and 74.6 months for negative group, p=0.4830) (Fig. 2).

Survival analysis according to lymph node metastasis (LN_Mets) in all samples (A), and neuroendocrine tumors (NET) G1 and G2 (B). LN_Mets was significantly related with poor prognosis in all rectal neuroendocrine neoplasms examined (p < 0.0001), but it was not if NET G1 and G2 tumors were selectively analyzed (p=0.4830).
3. Expression of L-cell markers and its prognostic significance in rectal NENs
Three L-cell markers (glucagon I, glucagon II, and PYY) clearly demonstrated L-cells scattered in the normal mucosa which served as an internal control (Fig. 3). The prevalence of L-cell type, defined by one or more markers with an immunoscore > 10, was 83.5% among all rectal NENs. L-Cell tumors with one marker positivity made up 27%, two markers 39.86%, and all three markers 35.57%. Among 104 non-rectal NENs examined, 0/50 patients with gastric NENs (0%), 3/27 patients with duodenal NENs (11.11%), and 6/18 patients with colonic NENs (33.33%) demonstrated an L-cell phenotype. The immunoscores of the three different markers were significantly correlated with each other (Table 2). In univariate analysis, all three markers showed significant correlation with prognosis (p=0.0018 for glucagon I, p < 0.0001 for glucagon II, and p=0.0209 for PYY), however only glucagon II was a significant prognostic factor in multivariate analysis of three markers (p=0.0232; hazard ratio [HR], 3.668; 95% confidence interval [CI], 1.194 to 11.268). Immunoscore was divided into four groups of increasing positivity from 0-3 and the 5-year OS were 59.48%, 82.47%, 95.24%, and 100%, respectively. Survival curves according to the immunoscore groups are shown in Fig. 4. Five- and 10-year OS of score group 1 were significantly better than those of the negative tumor (score group 0). The distribution of the L-cell score group in each histologic grade, size, extent, and node metastasis of NENs is shown in Fig. 5. Most L-cell phenotype were NET G1, small and limited to mucosa and submucosa, but few were NEC, large size or even node positive tumors.
Patterns and distribution of immunohistochemical expression of L-cell markers. The arrows (A) indicate L-cell marker cytoplasmic staining in normal endocrine cells of associated benign rectal mucosa that serves as a positive control. L-Cell immunohistochemical staining of rectal neuroendocrine neoplasms (NENs) was either focal/localized (B, C) or diffuse (D). L-Cell NEN type is defined by one or more positive markers (immunoscore > 10) (A-D, ×400).
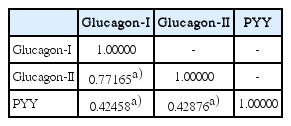
Correlation analysis of immunoexpression between the three L-cell markers

Survival analysis according to L-cell marker expression. Five- and 10-year overall survival rates (OS) in patients with immunoscore group 0 was significantly shorter than that of others (A). The survival curve according to the immunoscore groups strongly supports the reliability of using a cutoff score group of more than 0 for defining the L-cell type (B). (immunoscore group 1: p=0.0061; hazard ratio [HR], 0.226; 95% confidence interval [CI], 0.078 to 0.654; immunoscore group 2: p=0.0059; HR, 0.120; 95% CI, 0.026 to 0.544; immunoscore group 3: p ≤ 0.0001; HR, 0.051; 95% CI, 0.016 to 0.205).
Distribution of L-cell immunoscore groups by tumor grade (A), size (B), extent (C), and lymph node (LN) metastasis (D). Most neuroendocrine tumor (NET) G1 were L-cell type but seven out of 21 NET G2 (33.33%) and three out of 29 neuroendocrine carcinomas (NECs) (10.34%) were in the highest score group 3 for L-cell markers. L-Cell type tumors were rarely found in large size, invasive and even node positive tumor.
Results of clinicopathologic analysis in relation to L-cell phenotype are shown in Table 3. The immunoscore of L-cell markers showed inverse correlation with tumor size (Pearson correlation coefficient, –0.45889). Among the pathologic parameters, tumor grade (p < 0.0001) and extent (p < 0.0001) of L-cell tumor significantly differed from those of non–L-cell type tumor, but lymph node metastasis (p=0.1453) did not. Lymph node metastasis was observed in 33 out of 46 L-cell type tumors (71.74%) and in 16 out of 18 non–L-cell tumors (88.89%) among 64 cases in which the lymph node evaluation was performed. L-Cell phenotype was more common in NET G1, tumor confined to the submucosa and small size (< 1 cm).

Clinicopathologic analysis of rectal NENs in relation to L-cell phenotype
Discussion
Among all NENs in the body, rectal NETs are known to have the best prognosis, with a 5-year survival rate of 88.3% for all stages [2] and 90% for localized tumors with increased survival rates over time [1]. WHO classification based mitotic rate (grade) and stage (size and extent) are well known to predict patient’s survival but none are independent factors [16]. The 2010 WHO categorized L-cell type tumors, as uncertain malignancies, while all other NENs were classified as malignant. However, no concrete criteria were provided for defining L-cell type NET by histology or immunophenotyping and none clearly exist in the literature either. The defining L-cell type of rectal NENs by IHC stain also needs clarification as do other prognostic factors that may guide diagnosis and management. In relation to cancer registry data and medical insurance compensation, ICD-O behavior code “/1” means low malignant potential or uncertain malignant potential, and behavior code “/3” means frank malignancy. Therefore, dividing malignant tumors with low malignant potential (/1), very good prognosis and long survival from frankly malignant tumors (/3) is important.
In this study, we analyzed the 5- and 10-year OS of rectal NETs in relation to the pathological parameters, including L-cell typing. A full of 80.61% (n=1,151) of rectal NENs were less than 10 mm and these patients had an excellent prognosis with 10-year OS of more than 99%, if the tumor was NET G1 and confined to the mucosa-submucosa (small NET). Although univariate analysis showed significant prognostic significance of tumor grade, size, extent, lymph node metastasis and L-cell type, no independent prognostic factors were identified among them in multivariate analysis. The Colonoscopy Study Group of the Korean Society of Coloproctology reported lymph node metastasis in 5.1% (21 out of 414 rectal NETs) and was related to tumor size [17]. Lee et al. [14] reported that 6/151 patients with rectal NETs (4%) from 4 to 9 mm in diameter had lymph node metastasis; however patient outcome was not provided. Yamagishi et al. [18] also reported that lymph node metastasis was found in 8/20 patients with surgically resected rectal NETs, smaller than 10 mm, but no disease-related deaths were reported with a mean follow-up period of 68 months. In contrast, Jernman et al. [16] found that none of 61 patients with NET G1 had metastatic disease during follow-up (mean, 124 months). In a Japanese report, metastasis was significantly correlated with the tumor size, importantly, tumors less than 10 mm and confined to the mucosa-submucosa without vessel invasion did not show metastasis [19]. Although cases of small rectal carcinoid (< 10 mm) accompanied by multiple liver metastases have rarely been reported in the literature [20], but the pathological characteristics of these tumor, such as grade and extent are not clearly described. In the survival analysis of our data, 5- and 10-year OS were more than 99% if the tumor size was less than 10 mm, irrespective of lymph node metastasis. As mentioned, lymph node metastasis in patients with NET G1 and G2 did not show any prognostic significance in the survival analysis, however it is very difficult to determine the true incidence of lymph node metastasis in small NET because most of these NET were treated by endoscopic mucosal resection without lymph node dissection. We disagree with the 2000 WHO classification considering well-differentiated NETs as benign, because all NETs have malignant potential of varying degree as seen in our data. On the other hand, we reconfirm the excellent prognosis for patients with small rectal NETs, showing that this series is representative of prior literature and not biased by the Korean nationality of this study population. Therefore we believe that NETs have distinguished biological characteristics from NEC, frank malignancy (ICD-O code /3), although their pathogenetic mechanism is not yet clear.
In this study, to define the L-cell phenotype by immunohistochemistry, we compared three primary antibodies (2 glucagons and 1 PYY). The glucagon I primary antibody can detect the GLP-1 but the glucagon II can detect both GLP- 1 and 2. Gastric and duodenal NENs were almost all negative for all L-cell markers (except for 3 duodenal NENs), while 33.33% of non-rectal, colonic NENs and 83.7% of rectal NENs were defined as L-cell type. Even though the immunoscores of the three markers were significantly correlated with each other and all were prognostically significant by univariate analysis (p=0.0018, p < 0.0001, and p=0.0209, respectively), the patterns of expression were heterogeneous across cases (Fig. 3). In multivariate analysis of three markers, only glucagon II was prognostically significant (p=0.0232; HR, 3.669; 95% CI, 0.094 to 11.269). Immunoscoring was divided into four groups of increasing positivity from 0-3 and the 5-year OS were 48.33%, 91.47%, 94.44%, and 95.29%, respectively. These survival data strongly support the reliability of using a cutoff score group of more than 0 (immunoscore < 10) for these three markers for defining the L-cell type. Lee et al. [14] reported that the L-cell type was 79% in rectal NETs with varying immunoscores of 1-300. They divided the intensities into three groups while we divided them into two. We evaluated the intensity of immunoexpression by comparing tumor cells to normal L-cells in the non-neoplastic mucosa, classifying expression as weaker than or equal to that of L-cells in normal mucosa, because L-cells in normal mucosa showed uniform strong staining. Differences in L-cell tumor incidence may be related to use of different L-cell markers and absence of a standardized definition. In this study, we described the differences in immunoexpression patterns across L-cell markers. We found that glucagon II, which detects GLP-1 and GLP-2, was better than glucagon I and PYY because of the highest hazard ratio in multivariate analysis. In NET G1 and G2 tumors, L-cell type made up 96.56% and 95.24%, respectively, and 96.7% of mucosa/submucosa tumors and 92.1% of tumors < 1 cm. These findings may support that 2010 WHO classification describes L-cell type as uncertain malignancy/low malignant potential (ICD-O code/1).
Although the univariate analysis suggested size, grade, extent, lymph node metastasis, and L-cell phenotype as significant prognostic factors, multivariate analysis failed to show that only a single factor may not adequately predict prognosis. This also validates the conclusion that the suggested combined criteria are suitable for assessment of the biological behavior of rectal NENs. Therefore, in practice, we recommend perform IHC staining for L-cell markers for phenotyping of rectal NET and L-cell type best define classification as uncertain malignancy or low malignant potential (ICD-O code /1) [21,22] as indicated by the 2010 WHO classification if it is small (< 10 mm), G1 (< 2 mitoses per 10 HPF's), and with mucosa/submucosa-limited invasion.
Conclusion
We reconfirm the excellent prognosis for patients with rectal NET G1 if the tumor size was less than 10 mm and confined to the mucosa/submucosa, irrespective of lymph node metastasis. L-Cell type made up 96.56% of NET G1, 96.7% of mucosa/submucosa tumors, and 92.1% of tumors < 1 cm. These findings may support that 2010 WHO classification describes L-cell type as uncertain malignancy/low malignant potential (ICD-O code /1). Because multivariate analysis failed to show that only a single factor can adequately predict patient’s prognosis, we suggest combined criteria are suitable for assessment of the biological behavior of rectal NENs.
Notes
Conflict of interest relevant to this article was not reported.
Acknowledgements
We acknowledge and thank Dr. Mary Bronner, Professor and Division Chief of Anatomic Pathology at the University of Utah for her helpful review of our manuscript. Professor Myeong-Cherl Kook at the National Cancer Center of Korea kindly provided the gastric NENs samples as a control.