Nomogram to Predict Treatment Outcome of Fluoropyrimidine/Platinum-Based Chemotherapy in Metastatic Esophageal Squamous Cell Carcinoma
Article information
Abstract
Purpose
The degree of benefit from palliative chemotherapy differs widely among patients with metastatic esophageal squamous cell carcinoma (MESCC). The purpose of this study was to develop and validate a prognostic nomogram to predict survival and aid physicians and patients in the decision-making process regarding treatment options.
Materials and Methods
Clinicopathologic variables and treatment outcomes of 239 patients who were diagnosed with MESCC and received either fluorouracil/cisplatin (FP) or capecitabine/cisplatin (XP) as first-line chemotherapy were reviewed. A nomogram was developed as a prognostic scoring system incorporating significant clinical and laboratory variables based on a multivariate Cox proportional hazards regression model. An independent series of 61 MESCC patients treated with FP served as an independent data set for nomogram validation.
Results
No difference in response rate was observed between the FP group (44.8%) and the XP group (54.2%). Similarly, no significant differences in median progression-free survival and median overall survival were observed between regimen groups. Multivariate analysis showed that poor performance status (Eastern Cooperative Oncology Group [ECOG] status≥2), weight loss (10% of the weight loss for 3 months), low albumin level (≤3.5 g/dL), and absence of previous esophagectomy at the time of chemotherapy were significantly associated with low OS in both groups (p<0.05). Based on these findings, patients were classified into favorable (score, 0 to 90), intermediate (91-134), and poor (>135) prognostic groups. The median survival for those with a favorable ECOG was 13.8 months (95% confidence interval [CI], 10.8 to 18.6 months), for intermediate 11.2 months (95% CI, 8.7 to 11.9 months), and for poor, 7.0 months (95% CI, 3.6 to 10.0 months). External validation of the nomogram in a different patient cohort yielded significantly similar findings.
Conclusion
The nomogram described here predicts survival in MESCC patients and could serve as a guide for the use of FP/XP chemotherapy in MESCC patients.
Introduction
The incidence of esophageal cancer has increased in recent years, reflecting a shift in histologic type and primary tumor location in the West [1,2]. Although adenocarcinoma of the esophagus is more prevalent in Western countries, squamous cell carcinoma is still the most prominent histologic type worldwide [3]. Esophageal cancer is a highly aggressive disease with a 3-year survival rate of less than 1% [4]. Approximately 50% of patients have distant metastasis at the time of diagnosis, and of the remaining patients who initially present with only locoregional disease, 25% develop distant metastases [5].
Compared to other solid tumors, randomized phase III trials to test the efficacy of cytotoxic chemotherapy are lacking for metastatic esophageal squamous cell carcinoma (MESCC). One randomized phase II study published in Europe more than 20 years ago showed that a combination of cisplatin/fluorouracil (5-FU) (FP) was superior to cisplatin alone (response rate, 35% vs. 19%, respectively), although no clear improvement in overall survival (OS) was observed (33 weeks vs. 28 weeks, respectively) [6]. Hematological and non-hematological toxicities were more prominent in the combination treatment arm, with aplasia and septicemia being the most frequent toxicities observed. Treatment-related deaths were observed in seven patients (16%) in the combination treatment arm, whereas no treatment-related deaths were observed in the cisplatin alone treatment arm [6]. In contrast, another phase II study investigating capecitabine/cisplatin combination therapy in a different ethnic population showed promising anti-tumor activity, with a 57.8% response rate and more tolerable toxicity levels [7].
The combination of cisplatin and 5-FU is the most commonly used regimen as first-line chemotherapy for MESCC. However, the differences in treatment responses and toxicity levels in these two different clinical trial study populations highlight the difficulty in determining the most effective treatment regimens for MESCC patients. These studies further illustrate the importance of identifying patients who would benefit from cytotoxic chemotherapy. Here, we developed and validated a prognostic nomogram to predict survival that will aid physicians and patients in making an appropriate clinical decision regarding treatment.
Materials and Methods
1. Patients
This study was approved by the Institutional Review Board (IRB) of the Samsung Medical Center, Seoul, South Korea and is registered on clinicaltrials.gov (NCT#NCT 01472419). The informed consent form was waived by the IRB. Between January 2000 to December 2010, 239 patients were diagnosed with recurrent MESCC and received either FP or capecitabine/cisplatin (XP) as first-line chemotherapy. The following clinicopathologic variables and treatment outcomes were collected: patient demographics, laboratory data at the time of first-line palliative chemotherapy, surgical record, pathologic report, TNM stage, treatment record, and vital status.
2. Treatment
FP and XP regimens used to treat the patients are described below. In the FP group, 5-FU and cisplatin were administered in 4-day courses, once every 21 days. 5-FU (1,000 mg/m2) was infused over 24 hours during the four days. Cisplatin was given in one dose of 60 mg/m2 at the beginning of each cycle. In the XP group, capecitabine (1,250 mg/m2 bid) was administered for 14 days and cisplatin was given in one dose of 60 mg/m2 at the beginning of each cycle. The clinical tumor response was assessed according to World Health Organization (WHO) criteria or Response Evaluation Criteria in Solid Tumors criteria (RECIST 1.0).
3. External validation
As an external validation data set, 61 patients with MESCC who received palliative fluoropyrimidine/platinum chemotherapy (XP or FP) at Northern France Cancer Center were included.
4. Statistical analyses
The primary endpoints of the study were OS and progression-free survival (PFS). OS was measured from the date of first chemotherapy to the date of death or the last follow-up visit, and PFS was calculated from the date of first chemotherapy to the date of progression. OS and PFS were estimated using the Kaplan-Meier product-limit method. Survival rates were compared for statistical differences using log-rank analysis. A prognostic model was established by identifying all variables that significantly influenced OS or PFS at a p-value less than or equal to 0.05 in univariate analysis. Multivariate analysis was performed using stepwise Cox proportional hazards regression modeling. Factors included in the multivariate analyses were the following: age, sex, performance status, previous esophagectomy, weight loss (10% of weight lost for 3 months) at the time of chemotherapy, stent or percutaneous endoscopic gastrostomy, tracheoesophageal fistula, primary tumor location, histologic tumor grade, and metastatic site (lung, liver, bone, and adrenal gland). In addition, laboratory findings at the time of chemotherapy were included as categorical variables based on the normal ranges and consisted of the following: hemoglobin (>11.2 g/dL vs. ≤11.2 g/dL), white blood cell count (>8,630/µL vs. ≤8,630/µL), platelet count (> 138×103/µL vs. ≤138×103/µL), serum albumin (>3.5 g/dL vs. ≤3.5 g/dL), total bilirubin (>1.5 mg/dL vs. ≤1.5 mg/dL), aspartate aminotransferase (>40 U/L vs. ≤40 U/L), alanine aminotransferase (>40 U/L vs. ≤40 U/L), alkaline phosphatase (>128 U/L vs. ≤128 U/L), and serum creatinine (>1.1 mg/dL vs. ≤1.1 mg/dL).
A nomogram was developed as a prognostic scoring system incorporating significant clinical and laboratory variables based on a multivariate Cox proportional hazards regression model. Points for variables in the nomogram were determined by their Cox regression model coefficients. Variables were selected based on their statistical significance (p<0.05) in multivariate analysis. For example, the predicted 12-month OS hazard rate was calculated as follows: 12 months OS hazard rate=0.06501×exp (0.6755×ECOG 0-1 [if the ECOG grade was 0-1, the score could be 1, if not, the score is 0])+1.0682×ECOG 2 (if the ECOG grade1 was 2, the score could be 1, if not, the score is 0)+0.3784×weight loss (absence of weight loss=0, presence of weight loss=1)-0.6562×albumin (if serum albumin >3.5 g/dL, the score is 1, if serum albumin ≤3.5 g/dL, the score is 0)-0.2848×previous esophagectomy (absence=0, presence=1). The nomogram was then constructed using coefficients from the Cox proportional hazard model for convenience.
On the basis of the nomogram, patients were categorized into three groups according to their risk score percentile: favorable (0-50 percentile), intermediate (50-75 percentile), and poor (75-100 percentile) risk score. Performance of the nomogram was evaluated using discrimination and calibration. Discrimination was examined using the area under the receiver operating characteristic (ROC) curve (AUC). For internal validation, random sampling was repeated with replacement using the bootstrapping method over 1,000 times, and a new bias-corrected 95% confidence interval (CI) for AUC was calculated using R 2.13.2 (R Foundation for Statistical Computing, Vienna, Austria; ISBN 3-900051-07-0; http://www.R-project.org). The nomogram was externally validated in a different patient cohort from another hospital.
Results
1. Patients and treatment outcomes
Between January 2000 to December 2010, 239 MESCC patients were treated with either FP or XP chemotherapy. Patient characteristics are provided in Table 1. The median age of the patients was 62 with a range of 40 to 79. Two hundred and twenty-five patients (94.1%) had an Eastern Cooperative Oncology Group (ECOG) performance score of 0 to 1 at the time of chemotherapy. Ninety-three patients developed recurrence even after curative resection (n=93), and 11 patients showed recurrence after definitive concurrent chemo and radiotherapy. The other 135 patients (56.5%) were diagnosed with metastatic disease at initial presentation. The most common metastatic site was the lung (n=97) followed by the liver (n=36). Sixty percent (n=143) of patients received FP and 40% received XP treatment as first-line chemotherapy. No significant differences in baseline characteristics were observed between the XP and FP groups, except for the proportion of patients who received esophagectomy (data not shown).
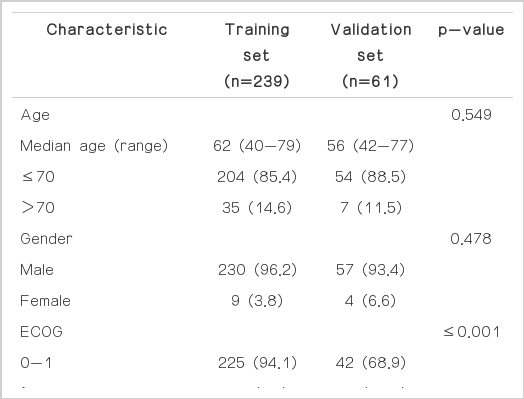
Patient characteristics
The baseline characteristics of the validation patient set are also provided in Table 1. The median age of this group of patients was 56, with a range of 42 to 77, and all patients received palliative fluoropyrimidine/platinum chemotherapy. Again, no significant differences in baseline characteristics were observed between the FP and XP groups. The patients in the validation set had fewer previous esophagectomies, more lung and liver metastases, and poorer performance status scores as a group than the patients in the training set. No difference in OS and PFS was observed between the validation and training sets.
2. Prognostic factor analysis and prognostic model
Univariate analyses revealed that poor ECOG score, weight loss (loss of at least 10% of weight for 3 months), absence of previous esophagectomy, low hemoglobin level (≤11.2 g/dL), and low albumin level (≤3.5 g/dL) were significantly associated with low OS. Moreover, poor ECOG score, weight loss, absence of previous esophagectomy, low albumin level, leukocytosis (>8,630/µL), elevated alanine aminotransferase level, and the presence of liver metastasis predicted short PFS in univariate analysis (Table 2). Multivariate analysis showed that poor performance status (ECOG≥2) (p=0.01), low albumin level (p<0.01), previous esophagectomy (p<0.01), and weight loss (p=0.04) at the time of chemotherapy retained statistical significance to predict poor survival (Table 3). Previous esophagectomy (p=0.03) and low albumin level (p<0.01) were also significant for predicting PFS in multivariate analysis.
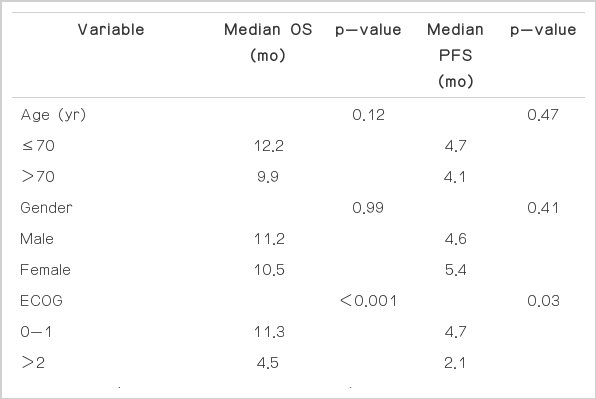
Univariate analysis for overall survival and progression-free survival
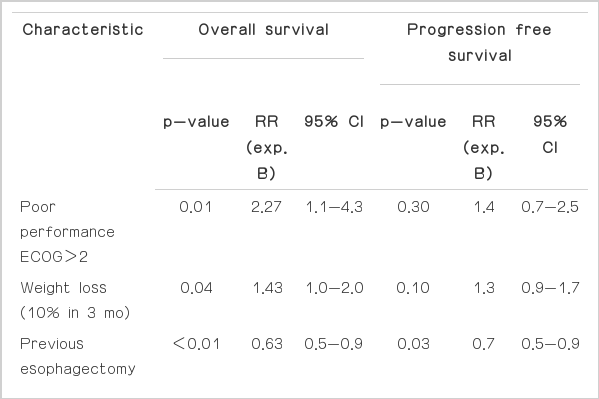
Multivariate analysis for overall survival and progression-free survival
To build a nomogram to predict survival following frontline palliative chemotherapy in MESCC, a scoring system was constructed that incorporates significant variables such as performance status scores, weight loss, low albumin levels, and previous esophagectomy (Fig. 1). For performance status, patients were categorized into ECOG 0, 1, or ≥2 and scored at 0, 63, or 100 points, respectively, based on the Cox regression model. For other variables, the scoring system was as follows: weight loss (+) vs. (-) (35 points vs. 0 points), low albumin vs. normal albumin (61 points vs. 0 points), and esophagectomy (+) vs. (-) (27 points vs. 0 points).

Nomogram for overall survival. ECOG, Eastern Cooperative Oncology Group; OS, overall survival.
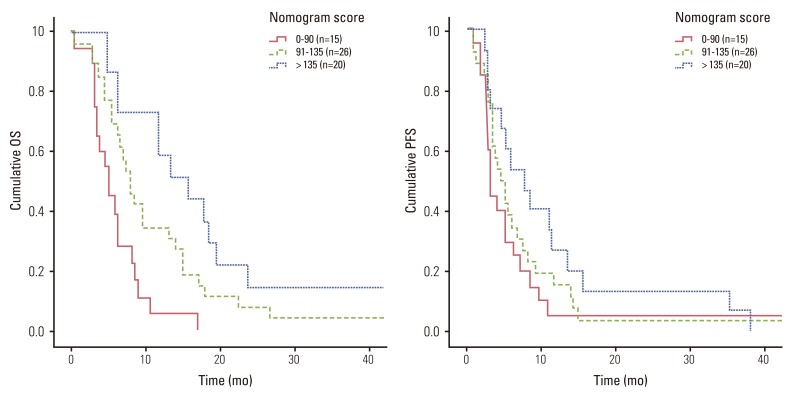
All 239 patients were scored according to the nomogram. Patients were then categorized into three groups by risk scores based on the nomogram: favorable (score 0-90, n=119), intermediate risk (score 91-135, n=58), and poor (score > 135, n=61) risk score (Table 4). The nomogram could discriminate between risk groups very well with the following median OS for each risk group: favorable risk group, 13.8 months (95% confidence interval [CI], 10.82 to 18.58 months); intermediate risk group, 11.2 months (95% CI, 8.7 to 11.89 months); and poor risk group (7.0 months; 95% CI, 3.56 to 10.04 months; p<0.001) (Fig. 2). The nomogram was applied in the same patient cohort to predict PFS. Similar to the OS findings, the nomogram significantly identified the PFS of the three groups as follows: favorable risk group, 5.9 months (95% CI, 4.6 to 7.2 months); intermediate risk group, 4.3 months (95% CI, 3.3 to 5.3 months); and poor risk group, 3.0 months (95% CI, 2.3 to 3.8 months) (p<0.001) (Fig. 2).
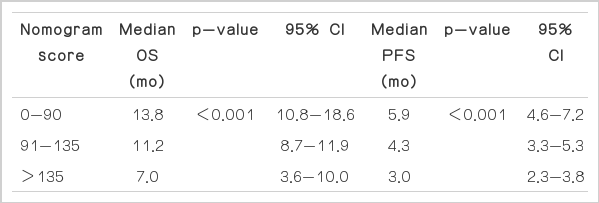
Prognostic risk groups based on nomogram score

Survival curve according to nomogram score. OS, overall survival; PFS, progression-free survival.
3. Internal validation and external validation
The ROC curve for 12-month OS is shown in Fig. 3A (AUC, 0.688; 95% CI, 0.58 to 0.74). The calibration curve showed the robustness of the nomogram to predict OS probability at 12 months (Fig. 3B). The nomogram was internally validated by repeated random sampling with replacement by bootstrapping over 1,000 times, yielding a bias-corrected 95% CI for AUC of 0.59 to 0.74, in accord with the 95% CI for AUC (0.58-0.74). The nomogram was also assessed on an external validation data set and discriminated the three risk groups with survival curves significantly similar to those obtained for the training data set (Fig. 4). The median OS according to risk groups were: favorable risk group, 15.5 months; intermediate risk group, 7.8 months; and poor risk group, 5.1 months (p<0.001) (Fig. 4).
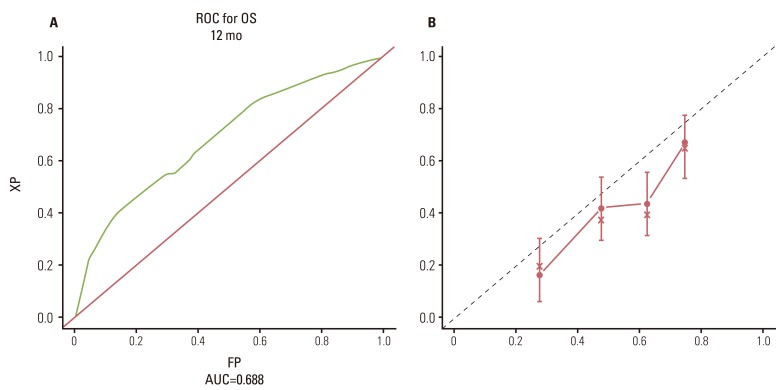
(A) Receiver operating characteristic curve for 12-month overall survival. (B) Calibration curve for predicted 12-month survival probability. Axis X, predicted 12-month survival probability; axis Y, observed 12-month survival probability; dashed line, ideal reference line; solid line, current nomogram performance with 95% confidence intervals; circle, median observed survival probability; x, median observed survival probability after bias correction. ROC, receiver operating characteristic; OS, overall survival; XP, capecitabine/cisplatin; AUC, receiver operating characteristic curve; FP, fluorouracil/cisplatin.
Survival curves (overall survival [OS] and progression-free survival [PFS]) according to the nomogram score in the validation set.
Discussion
Very little research has been done on the role of palliative chemotherapy in MESCC. This is largely because of the absence of largescale phase III randomized clinical trials, since MESCC is included as part of esophageal adenocarcinoma/gastric cancer in most trials. Despite the lack of clear evidence that palliative chemotherapy confers a survival benefit in MESCC, many physicians are firmly convinced that chemotherapy has a favorable impact on outcome because some drugs (or combination of cytotoxic agents) have shown antitumor activity in phase II trials [6,8-11]. These discrepancies between what is known and what is done mean that practice patterns differ greatly between continents, countries, and institutions. Moreover, no guidelines exist to select patients who might benefit the most from chemotherapy.
Only a few studies to date have focused on prognostication of MESCC with palliative chemotherapy [12]. One study analyzed 351 patients either with adenocarcinoma or with squamous cell carcinoma and found that performance status and the extent of disease predict treatment outcome [13]. The major limitation of this study was the heterogeneous patient population and the variety of chemotherapeutic regimens used. Another large-scaled prognostication paper included 1,080 patients from three randomized trials although only 50 patients had MESCC [14]. The largest study was reported by a French group who analyzed 284 patients, of whom 80% had MESCC [12]. This study identified dysphagia and the occurrence of a second primary cancer as independent predictors of poor outcome in a first set of 171 patients and validated these findings in a second set of 113 patients. However, when survival was adjusted with these prognostic factors, they found that chemotherapy did not substantially alter the natural course of MESCC [12].
In our study, we found that poor performance status (ECOG≥2), low albumin level (≤3.5g/dL), absence of previous esophagectomy, and weight loss (at least 10% for 3 months) significantly predicted poor survival and short PFS following first-line fluoropyrimidine/cisplatin chemotherapy. It is worth noting that all of these factors, although independent prognosticators, are more or less related to nutritional matters in esophageal cancer. Hence, the actual benefit from chemotherapy in MESCC patients with poor nutritional status as indicated by low albumin, poor performance or weight loss needs to be taken into consideration during decision making. The greatest advantage of our nomogram is that it is based on clinical parameters that are prospectively collected before chemotherapy. The robustness of the model was demonstrated using internal validation via the bootstrapping method as well as external validation on a series of French patients with MESCC who received an FP regimen. Our study is also the largest study analyzing the prognostic factors of outcome in MESCC treated with a fluoropyrimidine/cisplatin regimen, the most commonly used and most efficient regimen according to a review of 96 different trials performed by Grunberger et al. [15]. The limitation of our study would be an inherent bias from retrospective analysis. The number of prospective clinical trials is very limited in MESCC. In conclusion, the nomogram developed here predicts survival in MESCC and should aid physicians and patients in decision-making regarding the use of FP chemotherapy. This nomogram may also be useful in stratifying patients in future clinical trials, similar to what is currently being done in an ongoing randomized phase II trial for MESCC (clinicaltrials.gov NCT #NCT00816634).
Conclusion
The nomogram including the variables, ECOG performance, albumin, weight loss and previous esophagectomy predicts survival in MESCC patients and could serve as a guide for the use of FP/XP chemotherapy in MESCC patients.
Notes
Conflict of interest relevant to this article was not reported.