Radiation-Induced Autophagy Contributes to Cell Death and Induces Apoptosis Partly in Malignant Glioma Cells
Article information
Abstract
Purpose
Radiation-induced autophagy has been shown to play two different roles, in malignant glioma (MG) cells, cytocidal or cytoprotective. However, neither the role of radiation-induced autophagy for cell death nor the existence of autophagy-induced apoptosis, a well-known cell-death pathway after irradiation, has been verified yet.
Materials and Methods
We observed both temporal and dose-dependent response patterns of autophagy and apoptosis to radiation in MG cell lines. Additionally, we investigated the role of autophagy in apoptosis through knockdown of autophagy-related proteins.
Results
Autophagic activity measured by staining of acidic vesicle organelles and Western blotting of LC-3 protein increased in proportion to radiation dose from day 1 to 5 after irradiation. Apoptosis measured by annexin-V staining and Western blotting of cleaved poly(ADP-ribose) polymerase demonstrated relatively late appearance 3 days after irradiation that increased for up to 7 days. Blocking of pan-caspase (Z-VAD-FMK) did not affect apoptosis after irradiation, but silencing of Atg5 effectively reduced radiation-induced autophagy, which decreased apoptosis significantly. Inhibition of autophagy in Atg5 knockdown cells was shown to be beneficial for cell survival. Stable transfection of GFP-LC3 cells was observed after irradiation. Annexin-V was localized in cells bearing GFP-LC3 punctuated spots, indicating autophagy in immunofluorescence. Some of these punctuated GFP-LC3 bearing cells formed conglomerated spots and died in final phase.
Conclusion
These findings suggest that autophagy appears earlier than apoptosis after irradiation and that a portion of the apoptotic population that appears later is autophagy-dependent. Thus, autophagy is a pathway to cell death after irradiation of MG cells.
Introduction
Radiation therapy, which is one of the primary treatment modalities for malignant glioma (MG), is considered standard therapy after cytoreductive surgery [1]. Although radiation has long been used, MGs easily acquire radioresistance, resulting in tumor recurrence, even in the radiation field [1,2].
To define the cellular mechanism of radio-resistance, it is necessary to identify a responsible cell death pathway after irradiation. Apoptosis is known to be a primary mechanism of cell death following radiation injury in cancer cells. However, radiation-induced apoptosis is delayed (within days) in solid tumors relative to the rapid response (within hours) that occurs in sensitive hematopoietic cell lines [3]. This delayed cell death after irradiation occurs at the cell cycle transition at the G2/M phase, and some aberrant cells of incomplete mitosis undergo post-mitotic apoptosis [4]. This post-mitotic cell death after irradiation has been known to reflect inadequate DNA damage, which could not provoke immediate apoptosis, in cells with defective apoptotic machinery or following exposure to sublethal doses of radiation [4,5].
Autophagy is an augmented cellular protein recycling pathway in some cancer cells that was recently shown to lead to programmed cell death (PCD) type II in certain circumstances [6]. Many investigators have agreed to the dual role of autophagy in established cancer cells. Specifically, autophagy helps cancer cells survive under nutrient-limiting conditions by recycling protein and protecting cancer cells from cellular damage caused by anti-cancer drugs or ionizing radiation, possibly by removing damaged macromolecules or organelles. Additionally, some anti-cancer therapy typically induces autophagy in proportion to noxious stimuli, and defective or excessive autophagy leads to autophagic cell death [7,8]. Although its role in radiation response remains obscure, autophagy can be observed in cancer cells, including MG cells, after irradiation [9,10]. Yao et al. [10] reported that apoptosis did not occur in MG cell lines after irradiation, but that autophagic cell changes were observed regardless of the relative radio-sensitivity of the cell lines. They suggested that continued high level autophagic response may lead to cell death, but they evaluated neither the dose-response relationship nor cross-talk between autophagy and apoptosis [10]. In contrast to this concept of autophagy-mediated cell death, some researchers showed that inhibition of autophagy could sensitize glioma cells to radiation [11]. It is generally accepted that autophagy-mediated cell death occurs in proportion to the degree of intracellular damage, and that autophagy occurs more under apoptosis-defective conditions [12,13]. Thus, we could postulate that autophagy after irradiation plays different roles according to the dose of radiation and propensity of cells to undergo apoptosis after lethal damage.
Herein, we investigated the temporal and dose-relationship of cell cycle change, autophagy and apoptosis in MG cells after irradiation with doses ranging from sublethal damage to lethal based on growth inhibition assay. Through the specific knockdown of autophagy-related molecules (Vps34, autophagy-related gene 5 [Atg5], and Beclin1) with each shRNA-expressing lentivirus infection, we observed the effects of autophagy-inhibition on radiation-induced cell death or apoptosis. To evaluate if autophagy-bearing cells translate into apoptosis after irradiation, we stained green fluorescent protein (GFP)–light chain 3 (LC3) stably transfected cells with annexin-V, an early apoptosis marker, and then observed samples using immunofluorescence techniques. We also traced these GFP-LC3 bearing autophagic cells after irradiation using a live cell image analyzer to determine if these autophagic cells eventually die or overcome radiation-induced damage.
Materials and Methods
1. Cell culture, reagent and γ-irradiation
U87, U373 MG, and LN229 human glioma cell lines were obtained from the American Type Culture Collection and maintained in Dulbecco’s modified Eagle medium supplemented with 50 units of penicillin and streptomycin and 10% heat-inactivated fetal bovine serum at 37°C under 5% CO2. Cells were irradiated using a Gammacell 1000 Elite Cesium137 source (MDS Nordion, Ottawa, ON, Canada) at a dose rate of 0.063 Gy/sec. Acridine orange, rapamycin, and puromycin were purchased from Sigma-Aldrich (St. Louis, MO), while N-benzyloxycarbony-Val-Ala-Asp (O-methyl)– fluoromethy-ketone (Z-VAD-FMK) was acquired from MBL International Corporation (Woburn, MA). Annexin-V–fluorescein isothiocyanate (FITC) and propidium iodide (PI) staining solution were obtained from BD Biosciences (San Diego, CA), while Lipofectamine 2000 was from Invitrogen Life Technologies (Grand Island, NY).
2. shRNA and lentiviral transfections
Lentiviral constructs expressing Beclin1-shRNA, Vps34-shRNA, Atg5-shRNA, and GFP-LC3 were subcloned into pCDH-EF2-MCS-T2A-Puro, a lentiviral vector for cDNA expression (Sigma-Aldrich). All lentiviral vectors were transfected into 293T cells using Lipofectamine 2000 reagent according to the manufacturer’s instructions. Virus particles were collected 2 days after the transfection of lentiviral plasmids and infected into U87, U373, and LN229 cells. Lentivirus-infected U87, U373, and LN229 cells were puromycin-selected and established stable cell lines were used experiments.
3. Cell viability assay
Growth inhibition in culture was measured by two assays. First, cell viability was measured by clonogenicity. Briefly, cells were plated at clonal density (1.0×10³ per plate) in a 60-mm dish and treated with radiation at a dose indicated in the results section the next day. Cells were then allowed to form colonies for 10-14 days with regular media changes. Colonies were fixed with ice-cold methanol for 15 minutes, then stained with 0.4% crystal violet after washing with distilled water. A cluster of 50 cells or more was scored as a colony and the surviving fraction was calculated in relation to the un-irradiated control. Second, cell viability was analyzed by sulforhodamin-B (SRB) assay. Cells were seeded in 96-well plates at 1,500 cells per well and allowed to attach overnight before treatment with radiation. Five days after exposure to radiation, cells were fixed by adding 50 μL of cold 10% trichloroacetic acid to each well followed by incubation for at least one hour at 4°C. The fixed cells were then washed with distilled water five times and air-dried, after which the dried cells were stained with 0.4% SRB in 1% acetic acid solution for 30 minutes, washed with 1% acetic acid solution and again air-dried. Stained SRB, which is proportional to cellular protein mass, was resolved with 10 mM Tris-base solution (pH 10.5) and its absorption was measured at 510 nm.
4. Flow-cytometry analysis of cell cycle
To measure changes in the cell cycle, 1.5×10⁴ cells were plated on 60-mm plates and then subjected to radiation during the log growth phase. Samples were then maintained until the designated time at a sub-confluency. Cells (including non-adherent cells) were prepared at the indicated time after irradiation, fixed in 70% ethanol and kept overnight at 4°C. Fixed cells (1×10⁶ cells/mL) were suspended in PI (50 μg/mL in phosphate buffered saline [PBS]) containing 100 μg/mL RNase A (CosmoGenetech, Seoul, Korea), then incubated at 37°C for 1 hour. DNA content was analyzed using a fluorescence-activated cell sorter (FACSCalibur, BD Biosciences) and the CellQuest software (BD Biosciences).
5. Autophagy measurement using acridine-orange vital staining
To detect and quantify autophagic activity, cells were plated and irradiated on 60 mm plates under the same conditions as for cell cycle measurement. For acidic vesicular organelle (AVO) staining, cells were incubated at 37°C for 15 minutes with acridine orange (1 μg/mL) containing medium. After trypsinization and washing, pelleted cells were suspended in PBS and subjected to fluorescence-activated cell sorter (FACS) analysis as previously described [14].
6. Analysis of apoptosis with annexin-V–FITC
Following treatment with radiation under the same conditions as for AVO detection, cells were trypsinized, washed twice with PBS, and then resuspended at a concentration of 1×10⁶ cells/mL in binding buffer (10 mM HEPES/NaOH pH 7.4, 140 mM NaCl, 2.5 mM CaCl2). Next, 10 μL of annexin-V– FITC (BD Biosciences) and 5 μL PI were added, and the cells incubated at room temperature for 15 minutes in the dark. The stained cells were subsequently analyzed with a FACSCalibur flow cytometer and data were collected and analyzed using the CellQuest software.
7. Autophagy measurement using GFP-LC3
Cells were transfected with a GFP-LC3 expression plasmid kindly provided by Dr. Seiji Kondo [14] incorporated into the lentiviral vector using Lipofectamine 2000 reagent (Invitrogen Life Technologies). After selection with puromycin, expression of fluorescence was confirmed by microscopic evaluation before irradiation. Following irradiation at the indicated doses, cells were observed for the fluorescence of GFP-LC3 under a fluorescence microscope and LC3 punctate spots were counted. Cells were scored as undergoing autophagy if they had six or more GFP-LC3 spots. The percentage of cells undergoing autophagy was calculated from the ratio of autophagic cells to normal cells bearing GFP-LC3 fluorescence.
8. Immunofluorescence analysis
U373 cells expressing GFP-LC3 were seeded on a cover glass in a 60-mm culture dish at 1×10⁵ cells/mL. After incubation for 24 hours, U373 cells were irradiated with 10 Gy and then incubated for 5 days. Cells on the cover glass were washed with cold PBS and fixed with 4% paraformaldehyde for 10 minutes at 4°C. For permeabilization and blocking, cells on the cover glass were incubated with 0.2% Triton X-100 on ice for 20 minutes, then with 1% bovine serum albumin for 1 hour at 37°C. Rabbit polyclonal anti–annexin-V or anti–cleaved poly(ADP-ribose) polymerase (PARP) antibody was used as the primary antibody, and Alexa Flour594–conjugated anti-rabbit antibody was used as the secondary ant body. After adding one drop of 4', 6-diamidino-2-phenylindole dihydrochloride (DAPI) cotaining mounting solution, cells were analyzed by fluorescence microscopy.
9. Live cell imaging
U373 stably expressed GFP-LC3 cells were grown on 12-well glass-bottom dishes (Falcon, BD Biosciences) overnight (2×10⁴ cells per well). Irradiation was conducted in a Gammacell chamber 1 day after plating as previously described. Images were acquired automatically from each well using the cell observer system (Carl Zeiss, Jena, Germany) composed of an AxioObserverZ1 inverted microscope with a scanning stage fitted with a LD Plan-Neofluar 20×/0.4 Korr Ph 2 M27 and AxioCam CCD camera. The system was controlled using the AxioVision software. The microscope was housed in a custom-designed 37°C chamber with a secondary internal chamber that delivered humidified 5% CO2. Fluorescence and differential interference contrast images were obtained every 30 minutes from 3 to 5 days after irradiation. For analysis of the fate ofautophagic cells, cells were analyzed if they showed punctuated GFP-LC3 3 days after irradiation. The cells wereconsidered to be apoptotic if they showed segregation of GFP-LC3 and/or shrinkage of the cell membrane. Cells were considered to undergo mitosis if separation of the nucleus (telophase) and/or division into two cells were observed.
10. Western blotting
Cells were lysed in lysis buffer (20 mM Tris-HCl pH 7.4, 150 mM NaCl, 1% Triton X-100, 0.1 mM ethylenediaminetetraacetic acid, 1 mM ethylene glycol tetraacetic acid, 2 mM sodium orthovanadate, 2 mM NaF, and complete protease inhibitor mix (Roche Molecular Biochemicals, Mannheim, Germany) for 20 minutes on ice, then cleared by centrifugation at 12,000 rpm at 4°C. Proteins were resolved by 10% or 15% sodium dodecyl sulfate polyacrylamide gel electrophoresis, transferred onto nitrocellulose membranes, blocked with 5% nonfat dry milk in TBS-T (10 mM Tris-HCl pH 7.5, 100 mM NaCl, and 0.05% Tween 20), and then incubated with thefollowing primary antibodies: anti–cleaved PARP, anti-Beclin1, anti-Vps34 (phosphoinositide-3 kinase class III [Vps34] PI3KCIII; Cell Signaling Biotechnology, Berverly, MA), anti-LC3, anti-Atg5 (Novus Biologicals, Littleton, CO), and anti–β-actin (Sigma-Aldrich). Blots were washed and incubated with horseradish peroxidase– conjugated secondary antibody. Antibody complexes were visualized using an enhanced chemo-luminescence Western blotting detection system (Pierce Biotechnology, Rockford, IL).
11. Statistics
Quantitative data were expressed as the mean±standard deviation or ±standard error of the mean, as indicated. All measurements for each condition were performed in triplicate. Dose-response curve-fit was determined using GraphPad Prism (ver. 6.0, GraphPad software, La Jolla, CA). Statistical significance of differences was assessed using a two-tailed unpaired Student’s t test and one-way ANOVA (ver. 11.0, SPSS Inc., Chicago, IL). Statistical significance was considered to have been reached if the p-value was less than 0.05.
Results
1. Radio-sensitivity of cell lines
The radiation dose was as high as 20 Gy, which was equivalent to the dose prescribed for MG in fractionated conventional radiation therapy (60 Gy in 30 fractions) using the linear-quadratic formula [15].
To determine the radio-sensitivity of human MG cell lines by growth inhibition assay, radiation was applied to cells in 96-well plates at 20% to 30% confluency, which was the same confluency used in experiments measuring the cell cycle, autophagy and apoptosis. U87 revealed surviving fractions of 0.96 at 2 Gy, 0.79 at 5 Gy, 0.68 at 10 Gy, and 0.55 at 20 Gy. U373 showed similar sensitivity to radiation as the surviving fraction of 0.86 at 2 Gy, 0.73 at 5 Gy, 0.62 at 10 Gy, and 0.47 at 20 Gy. LN229 showed relative radiosensitivity when compared with U87 and U373 cells, with surviving fractions of 0.76 at 2 Gy, 0.54 at 5 Gy, 0.42 at 10 Gy, and 0.30 at 20 Gy (Appendix 1A). Based on these findings, the calculated 50% inhibitory concentration (IC50) of radiation was 9.3 Gy for U87, 9.1 Gy for U373 and 8.7 Gy for LN229 (non-linear regression, Sigmoid-response model). A colony forming assay measuring the ability of cells to form a colony at clonal density (1.0×10³/21 cm2) revealed surviving fractions of less than a half at 5 Gy (Appendix 1B). Subsequent experiments measuring both autophagy and apoptosis at subconfluent cell culture density showed no remarkable change compared to the control at 5 Gy.
Based on these results, we set a target radiation dose of 10 Gy for a lethal condition to observe autophagy and apoptosis after irradiation.
2. G2/M arrest is earlier than subG1 accumulation representing apoptosis
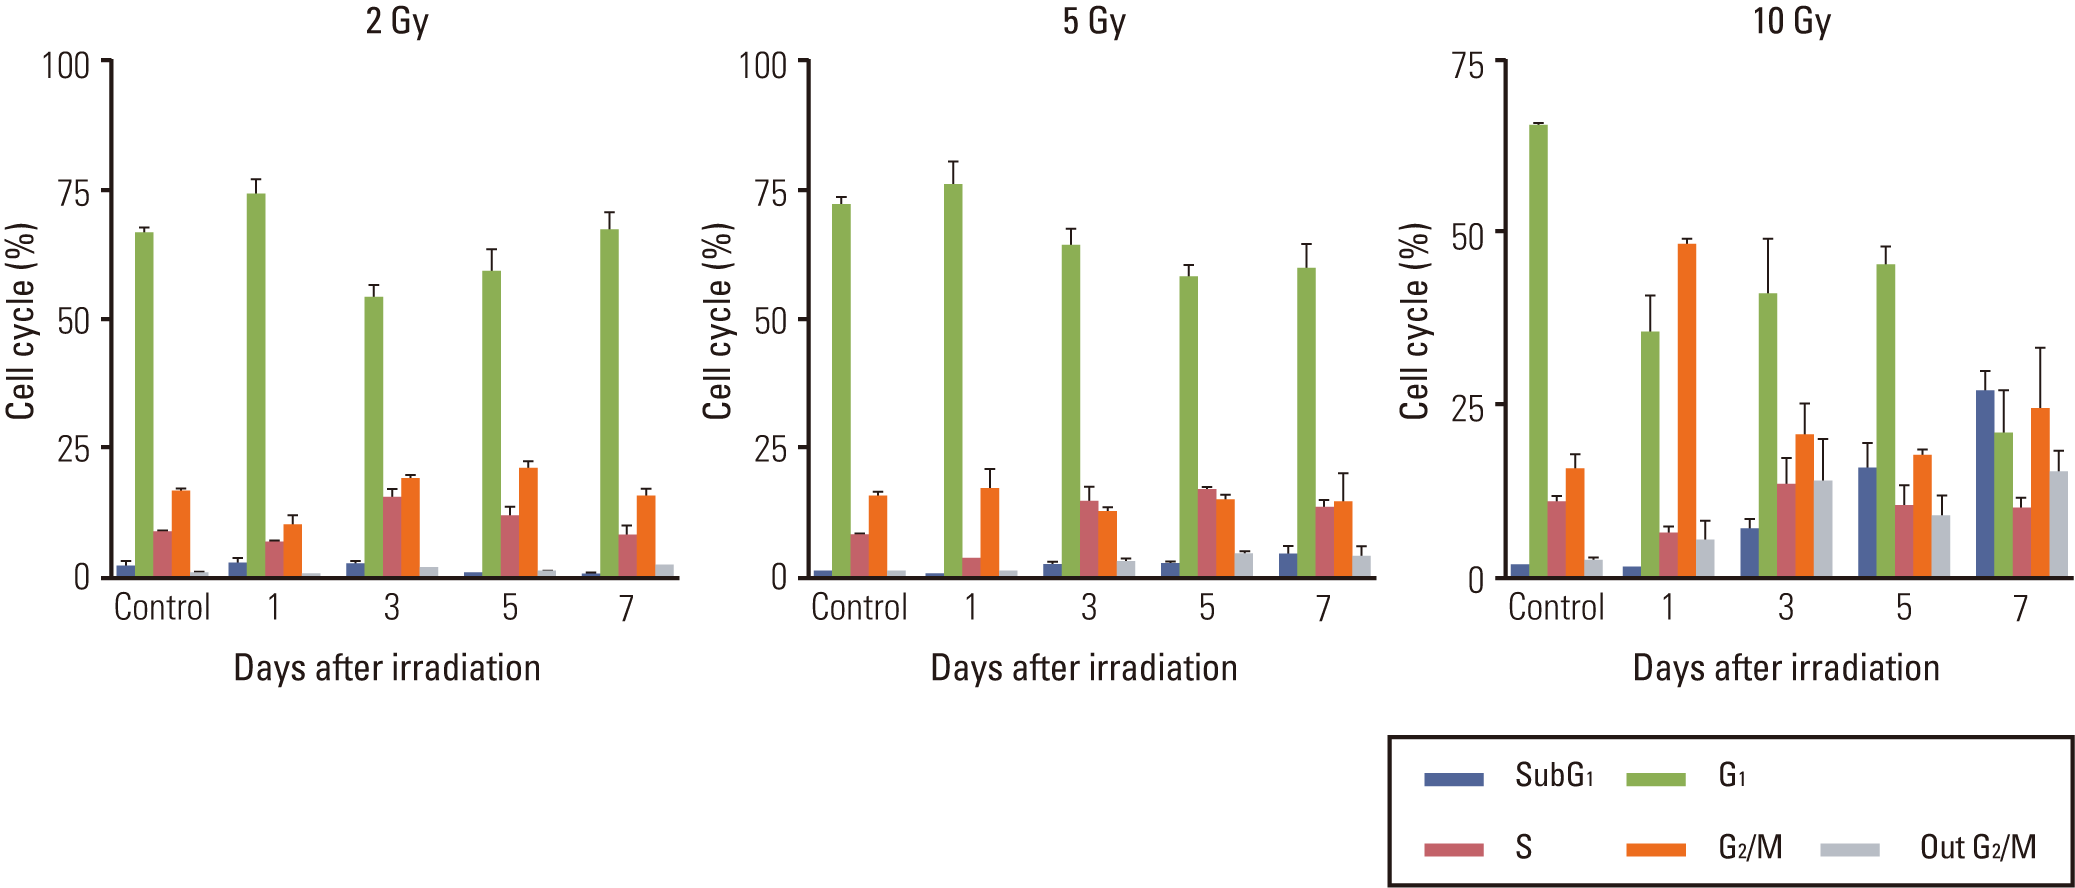
Both temporal and dose-dependent changes in the cell cycle were observed after irradiation upon flow cytometry analysis. The G2/M transition at 1 day after irradiation was proportional to the radiation dose in each cell line (Fig. 1B). At a dose range of 10 to 20 Gy (5 to 20 Gy in LN229), the subG1 population became apparent at 3 days after irradiation and it was proportional to the radiation dose. At a lethal dose of 10 Gy, significant G2/M accumulation was evident as early as 1 day after irradiation with aneuploidy (4n) compared to the unirradiated control (Fig. 1A, upper panels). The subG1 population, which was not observed at 1 day after irradiation, became apparent at 3 days after irradiation. The subG1 accumulation increased at 5 and 7 days after irradiation in concordance with the decrease of both the G2/M transition and aneuploidy (Fig. 1A, lower panels). At a sublethal dose of 2 Gy, neither the G2/M transition nor the subG1 population was discernibly observed for up to 7 days after irradiation (Fig. 1B, first column). At 5 Gy, the amount of cells accumulated in the G2/M phase did not differ significantly from the control in U87 and U373 at 1 and 3 days after irradiation and those G2/M transitions were recovered without discernible accumulation of the subG1 population. The increased G2/M portion turned into subG1 accumulation of up to 20% at 7 days after irradiation in LN229, the more radiosensitive cell line (Fig. 1B, second column). These results are in accordance with relative radio-sensitivity of LN229 compared to U87 and U373 at 5 Gy. The appearance of aneuploidy was not significantly upregulated in proportion to irradiation dose at 10 Gy and 20 Gy, but showed the same tendency for transient increase at 3 to 5 days with G2/M accumulation.
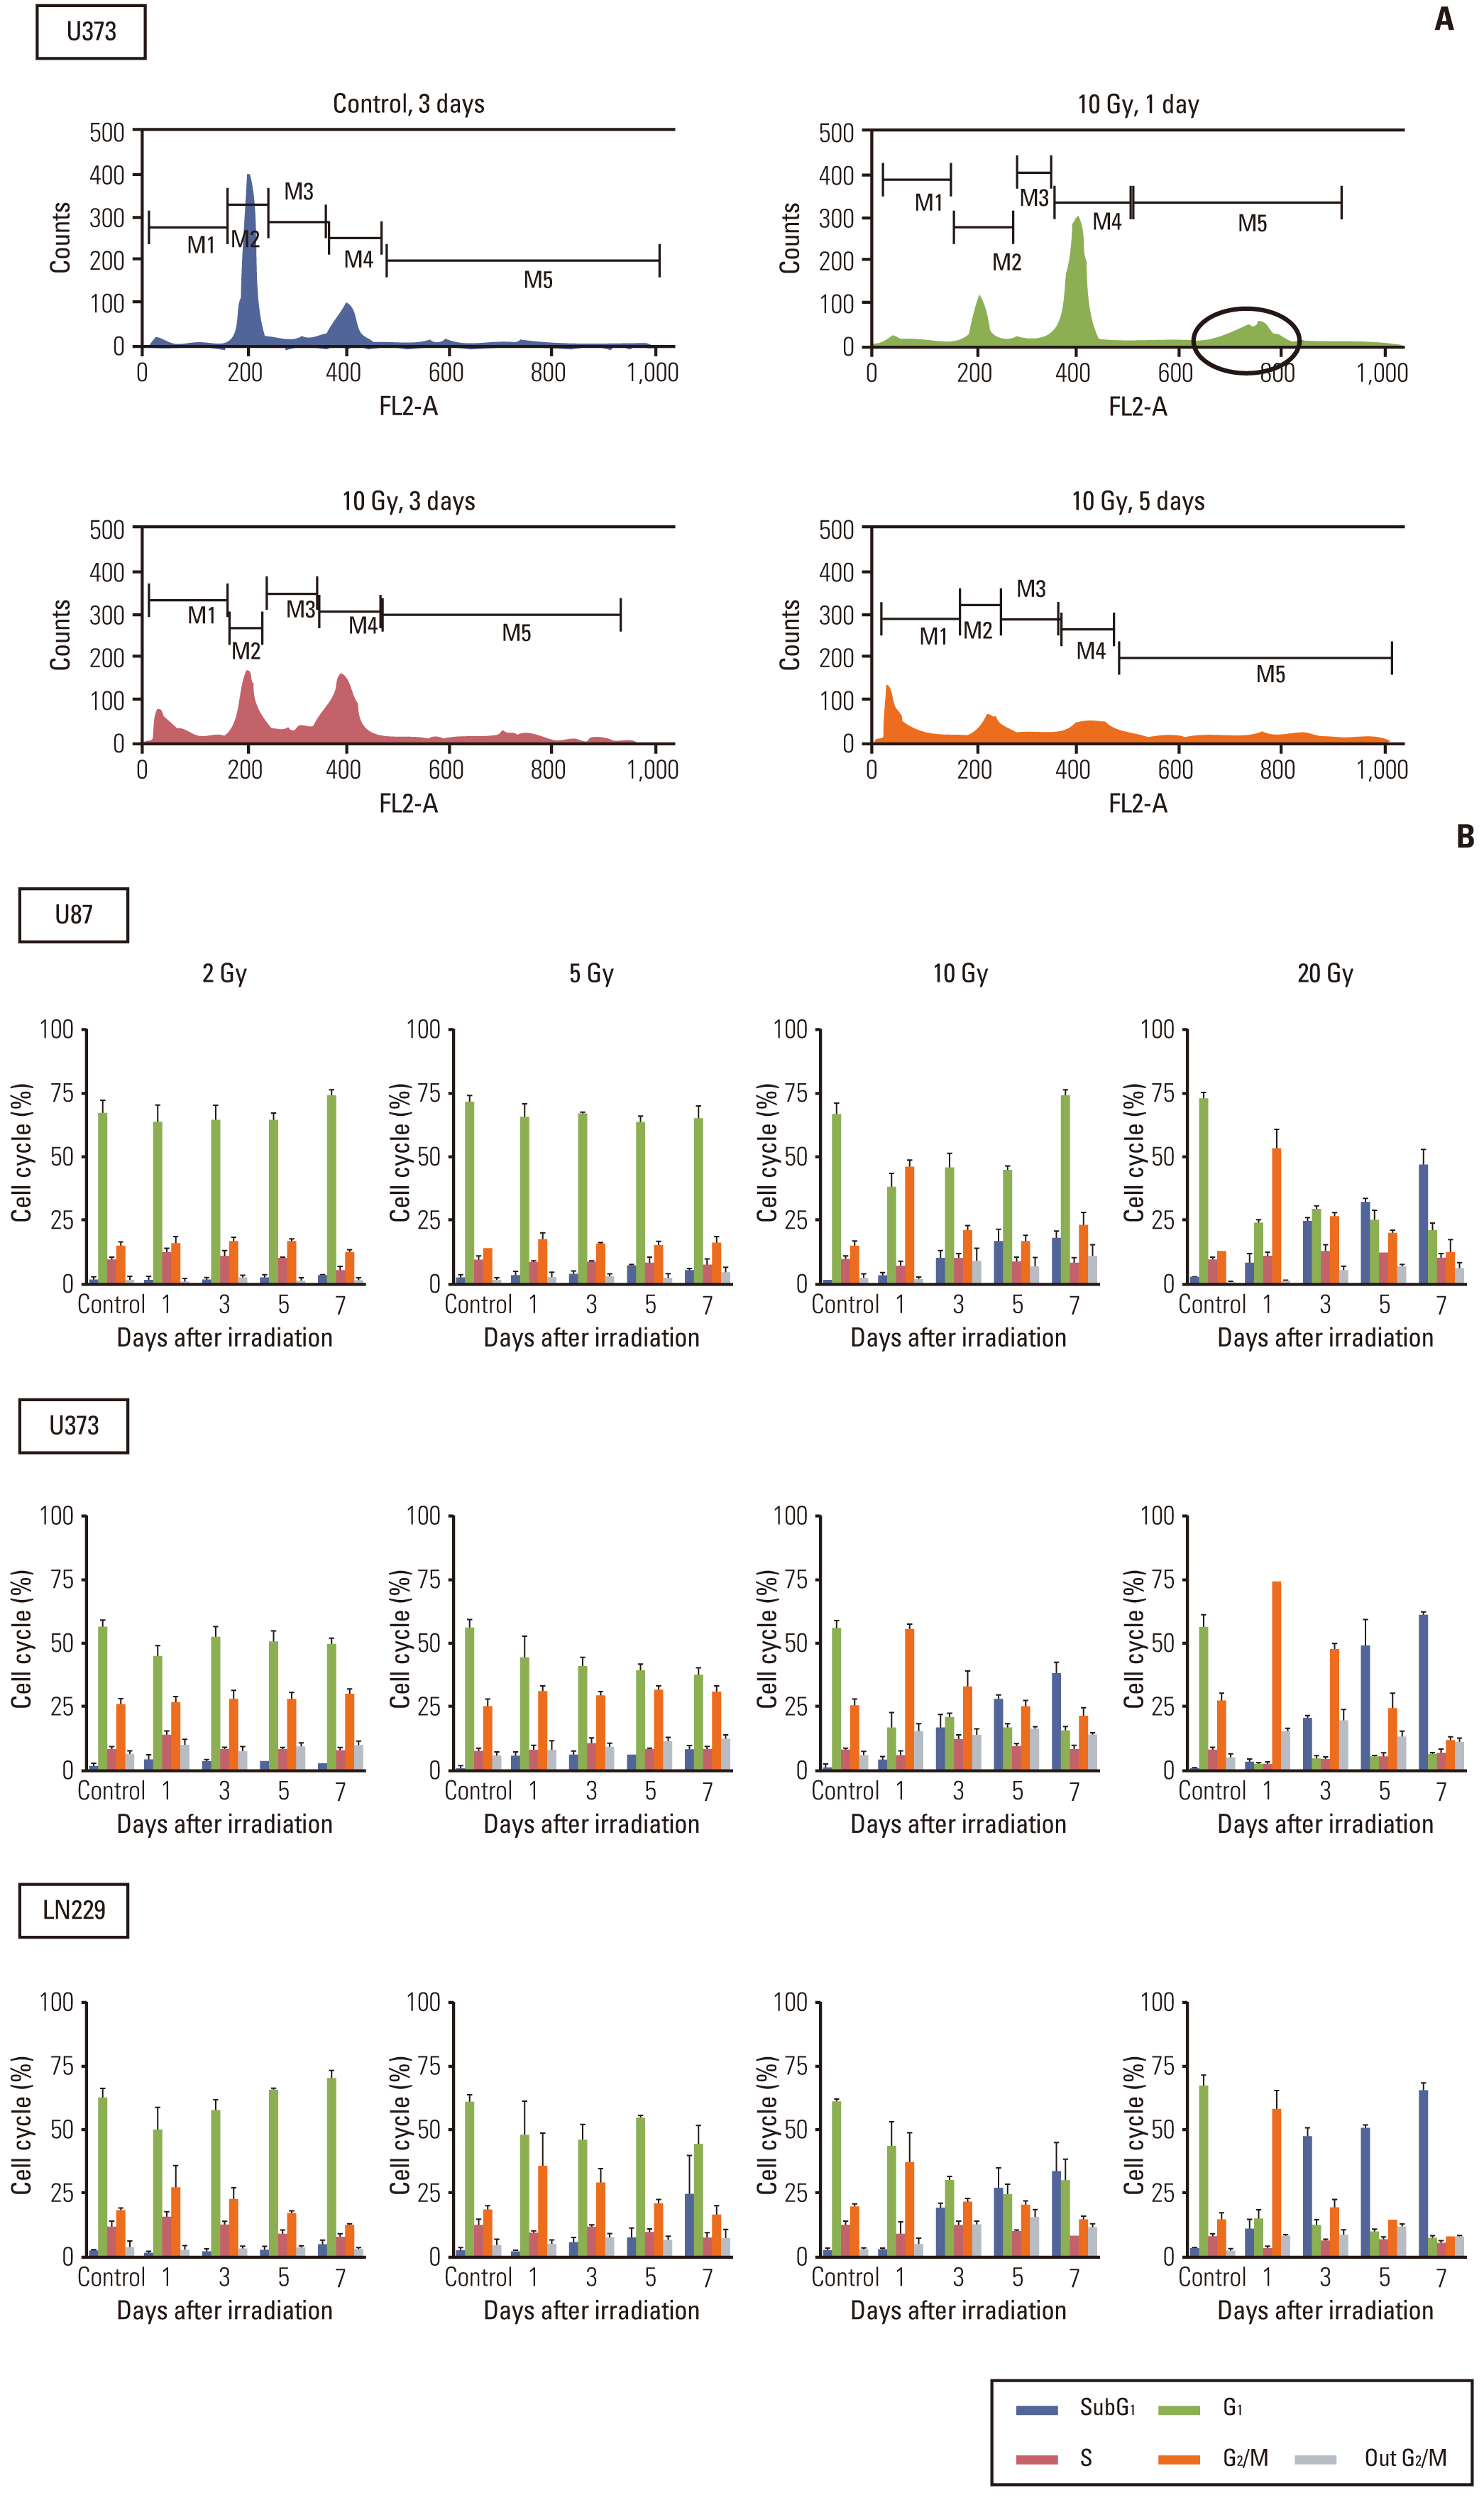
Cell cycle analysis of malignant glioma cells after irradiation. Cell cycle was determined according to the DNA content in cells by flow cytometry. (A) G2/M arrest occurred as early as 1 day after irradiation (upper, right panel) and earlier than subG1 accumulations, which became apparent after 3 days (lower panels). Aneuploidy was observed at a position of 4n (circle) on 1 day after irradiation (upper, right panel). (B) Malignant glioma cells were irradiated with different doses of radiation and incubated for the indicated time. Radiation-induced G2/M arrest was minimal or recovered without a significant increase of the subG1 population in response to sublethal dose (2 Gy for all 3 cell lines and 5 Gy for U373 and U87), but prominent G2/M arrest decreased from 1 day after irradiation and was transformed into subG1 accumulation from 3 to 7 days after irradiation with lethal dose (5 Gy or more for LN229 and 10 Gy or more for U373 and U87).
These data suggest that G2/M arrest is an earlier event after irradiation than subG1 accumulation, which is wellknown to be suggestive of apoptosis. The decrease in G2/M transition occurred concurrently with accumulation of the subG1 population at lethal doses, while it did not occur at 2 Gy and was repaired or accumulated as the subG1 population at 5 Gy.
3. Radiation-induced autophagy occurs early and is dose-dependent
We measured autophagy after irradiation by counting AVO containing cells in given time frames and dose ranges (Fig. 2A). Increases in autophagy from 1 to 7 days after irradiation were demonstrated at 10 and 20 Gy and a dosedependent increase in autophagy after irradiation was confirmed at each designated time of measurement in all three cell lines. At 2 Gy, significant increases in AVO containing cells were not observed any of the cell lines. At 5 Gy, a discernible increase in AVO containing cells in proportion to days after irradiation was only observed in LN229 cells.
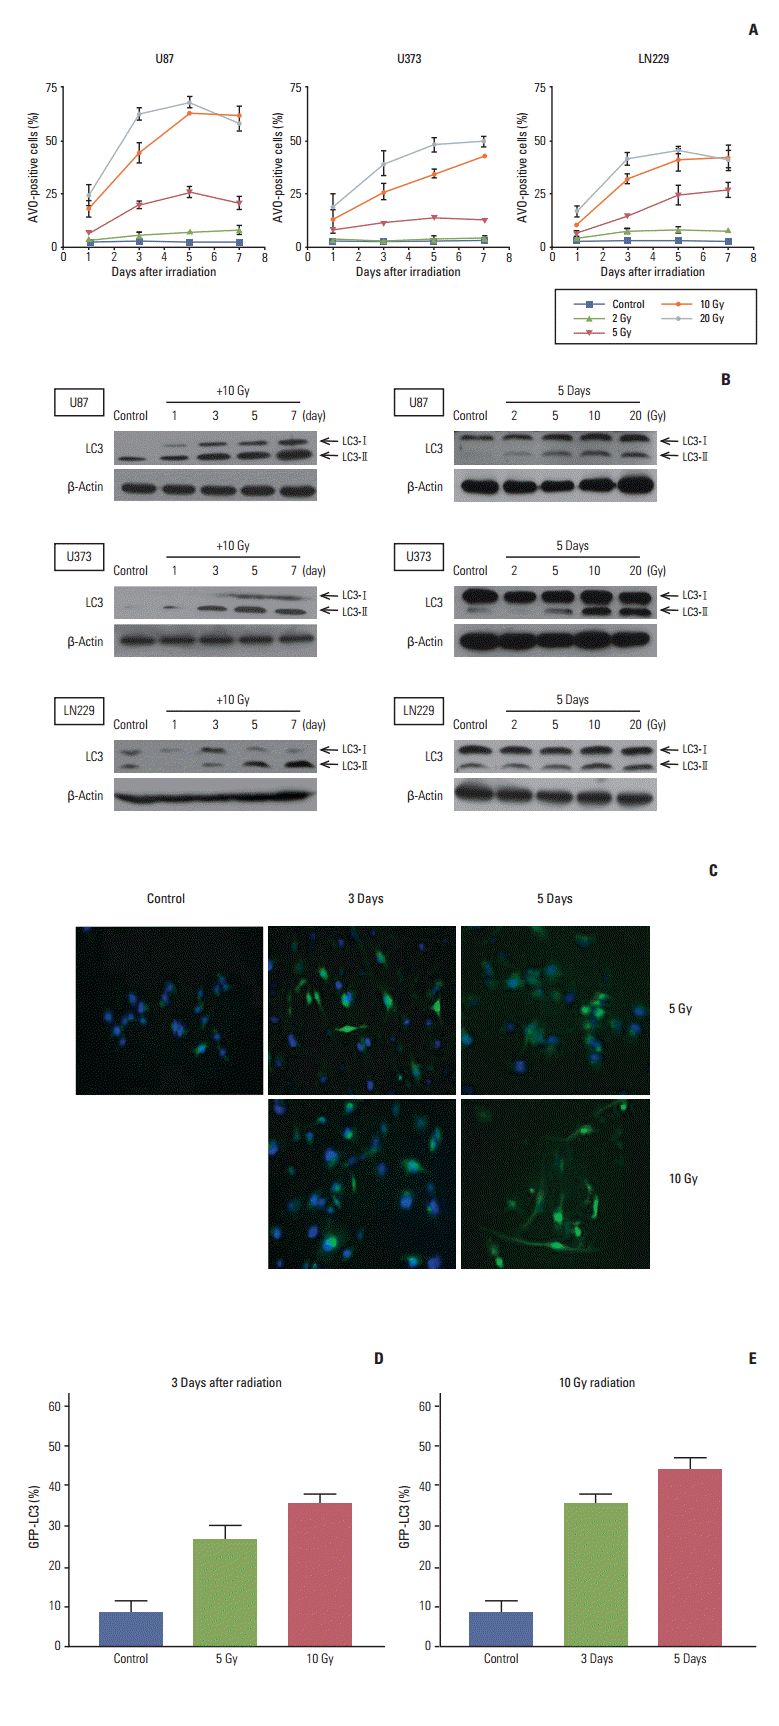
Analysis of autophagy after radiation according to time and radiation dose. (A) Glioma cells were irradiated with different doses of radiation and then incubated for the indicated times. To measure acidic vesicular organelle (AVO), which is indicative of autophagy formation, cells were stained with acridine orange and analyzed quantitatively by flow cytometry. Data from three independent experiments were combined. The error bars indicate ±standard error of mean. (B) Western blot analysis of LC3 according to time and radiation dose. Western blotting of LC3 generated two separate bands (an upper one of 18-kDa for LC3-bI and a lower one of 16-kDa for LC3-bII). An increase in the lower band accompanied by an increase in the ratio of the lower to the upper band is indicative of autophagy. Each membrane was stripped and re-blotted with β-actin to confirm equal loading. (C) U373 cells stably expressing GFP-LC3 revealed an increase of LC3 dots from 5 to 10 Gy and from 3 to 5 days (×200). Cells bearing GFP-LC3 puncta, which were quantified and averaged from 10 high-power fields, showed a dose-dependent increase at 3 days after irradiation (D) and an increase from 3 to 5 days after irradiation at 10 Gy (E).
We checked the expression of LC3 protein, which is known to be a standard indicator of autophagy. Among two separate bands observed upon Western blot (an upper one of 18-kDa for LC3-bI and a lower one of 16-kDa for LC3-bII), the lower band representing fusion of the autophagosome to lysosome was increased according to the time after irradiation at 10 Gy (Fig. 2B, left column) and in proportion to the radiation dose given at 5 days (Fig. 2B, right column).
We also checked the amount of autophagy after irradiation using stable GFP-LC3 expression in U373 cells. The punctuated pattern of GFP-LC3 granules was identified as an indicator of autophagy after irradiation. The number of autophagic cells, which was counted under a fluorescence microscope, increased from 3 to 5 days and showed a dosedependent increase at 3 days after irradiation from 5 to 10 Gy (Fig. 2C-E). These data can be summarized as follows: 1) radiation-induced autophagy occurred as early as 1 day after irradiation and increased for up to 7 days when applied at a lethal dose; 2) autophagy occurred in a dosedependent manner at a designated time of observation when radiation was applied at a lethal dose. Taken together, these finding suggest that radiation-induced autophagy is proportional to cell death after irradiation at lethal doses.
4. Radiation-induced apoptosis occurs later than autophagy and is caspase-independent
Radiation-induced apoptosis based on the early apoptotic marker annexin-V was not observed 1 day after irradiation in any of the cell lines, which is in accordance with previous finding of no subG1 population upon cell cycle analysis (Fig. 3A). At sublethal doses (2 Gy and 5 Gy), annexin-V was not stained until 7 days after irradiation in U87 and U373 cells, but the annexin-V staining population was increased to 18% in response to 5 Gy in LN229. At lethal doses (10 Gy and 20 Gy), this apoptotic marker became evident 3 days after irradiation and increased linearly for up to 7 days.

Analysis of apoptosis after irradiation according to time and radiation dose. (A) Glioma cells were treated with different doses of radiation and then incubated for the indicated times, after which they were analyzed quantitatively by flow cytometry for detection of annexin-V staining, which is an early marker of apoptosis. Annexin-V–positive cells were not observed at 1 day after radiation, but appeared after 3 days and increased thereafter. Data from three independent experiments were combined. The error bars indicate ±standard error of mean.(B) Cleaved poly(ADP-ribose) polymerase (PARP), a marker of late apoptosis, was not detected at 1 day after irradiation with 10 Gy. However, it was present at 3 days after irradiation and its expression increased for up to 7 days. Caspase-3 did not change after irradiation. Each membrane was stripped and re-blotted with β-actin to confirm equal loading. (C) Cells were treated with Z-VAD-FMK (50 μM) immediately after irradiation with 10 Gy to determine if radiation-induced apoptosis in malignant glioma cells is caspase-dependent. Apoptosis was then observed and compared to that of irradiated parent cells without the inhibitor at 5 days after the irradiation.
We next checked the expression of cleaved PARP, which is specific to late stage apoptosis, to determine if apoptosis measured by annexin-V staining continued to the late phase of apoptosis. Cleaved PARP was not detected on day 1, but appeared at 3 days after irradiation at 10 Gy and increased for up to 7 days (Fig. 3B).
It is well known that post-mitotic apoptosis after irradiation in radio-resistant solid cancer cell lines or sublethal dose in hematopoietic cancer cells is independent of caspase-inhibition [16]. To evaluate whether observed apoptosis is caspase-dependent or not, we treated cells with 50 μM of Z-VAD-FMK, a pan-caspase inhibitor, immediately after irradiation with 10 Gy. Apoptosis was measured at 5 days after irradiation by calculating the percentage of annexin-V staining cells, and treatment with Z-VAD-FMK did not alter the fraction of apoptosis significantly (Fig. 3C). Western blotting of caspase-3, a common final executor of prototype apoptosis, was conducted to evaluate any change after radiation. Caspase-3 did not change after treatment with 10 Gy until 7 days after irradiation (Fig. 3B) and did not show a dose-dependent response to treatment with up to 30 Gy, whereas staurosporine (500 nM-1 μM) induced a decrease in caspase-3 (Appendix 2). These results suggest that radiationinduced apoptosis measured by annexin-V is independent of caspase activation.
5. Effects of autophagy-inhibition on radiation-induced apoptosis
To examine whether regulation of autophagy through inhibition of autophagy-related proteins affects apoptosis after irradiation in MG cell lines, cells were stably transfected with Beclin1-shRNA, Vps34-shRNA, and Atg5-shRNA by lentiviral transfection, after which protein levels of Beclin1, Vps34, and Atg5 were measured by Western blotting to confirm silencing of the target protein (Appendix 3A). The percentage of AVO-positive cells after irradiation with 10 Gy was used to measure the degree of inhibition of autophagy at 3 days after irradiation. Among tested cell lines, U87 showed no significant inhibition of autophagy after silencing of autophagy-related proteins. In both U373 and LN229, knockdown of Atg5 resulted in an average of 46% and 60% of AVO-stained cells, respectively, relative to parent cell lines (Fig. 4A and B). However, the knockdown of Beclin1 and Vps34 did not inhibit radiation-induced autophagy significantly (Appendix 3B).
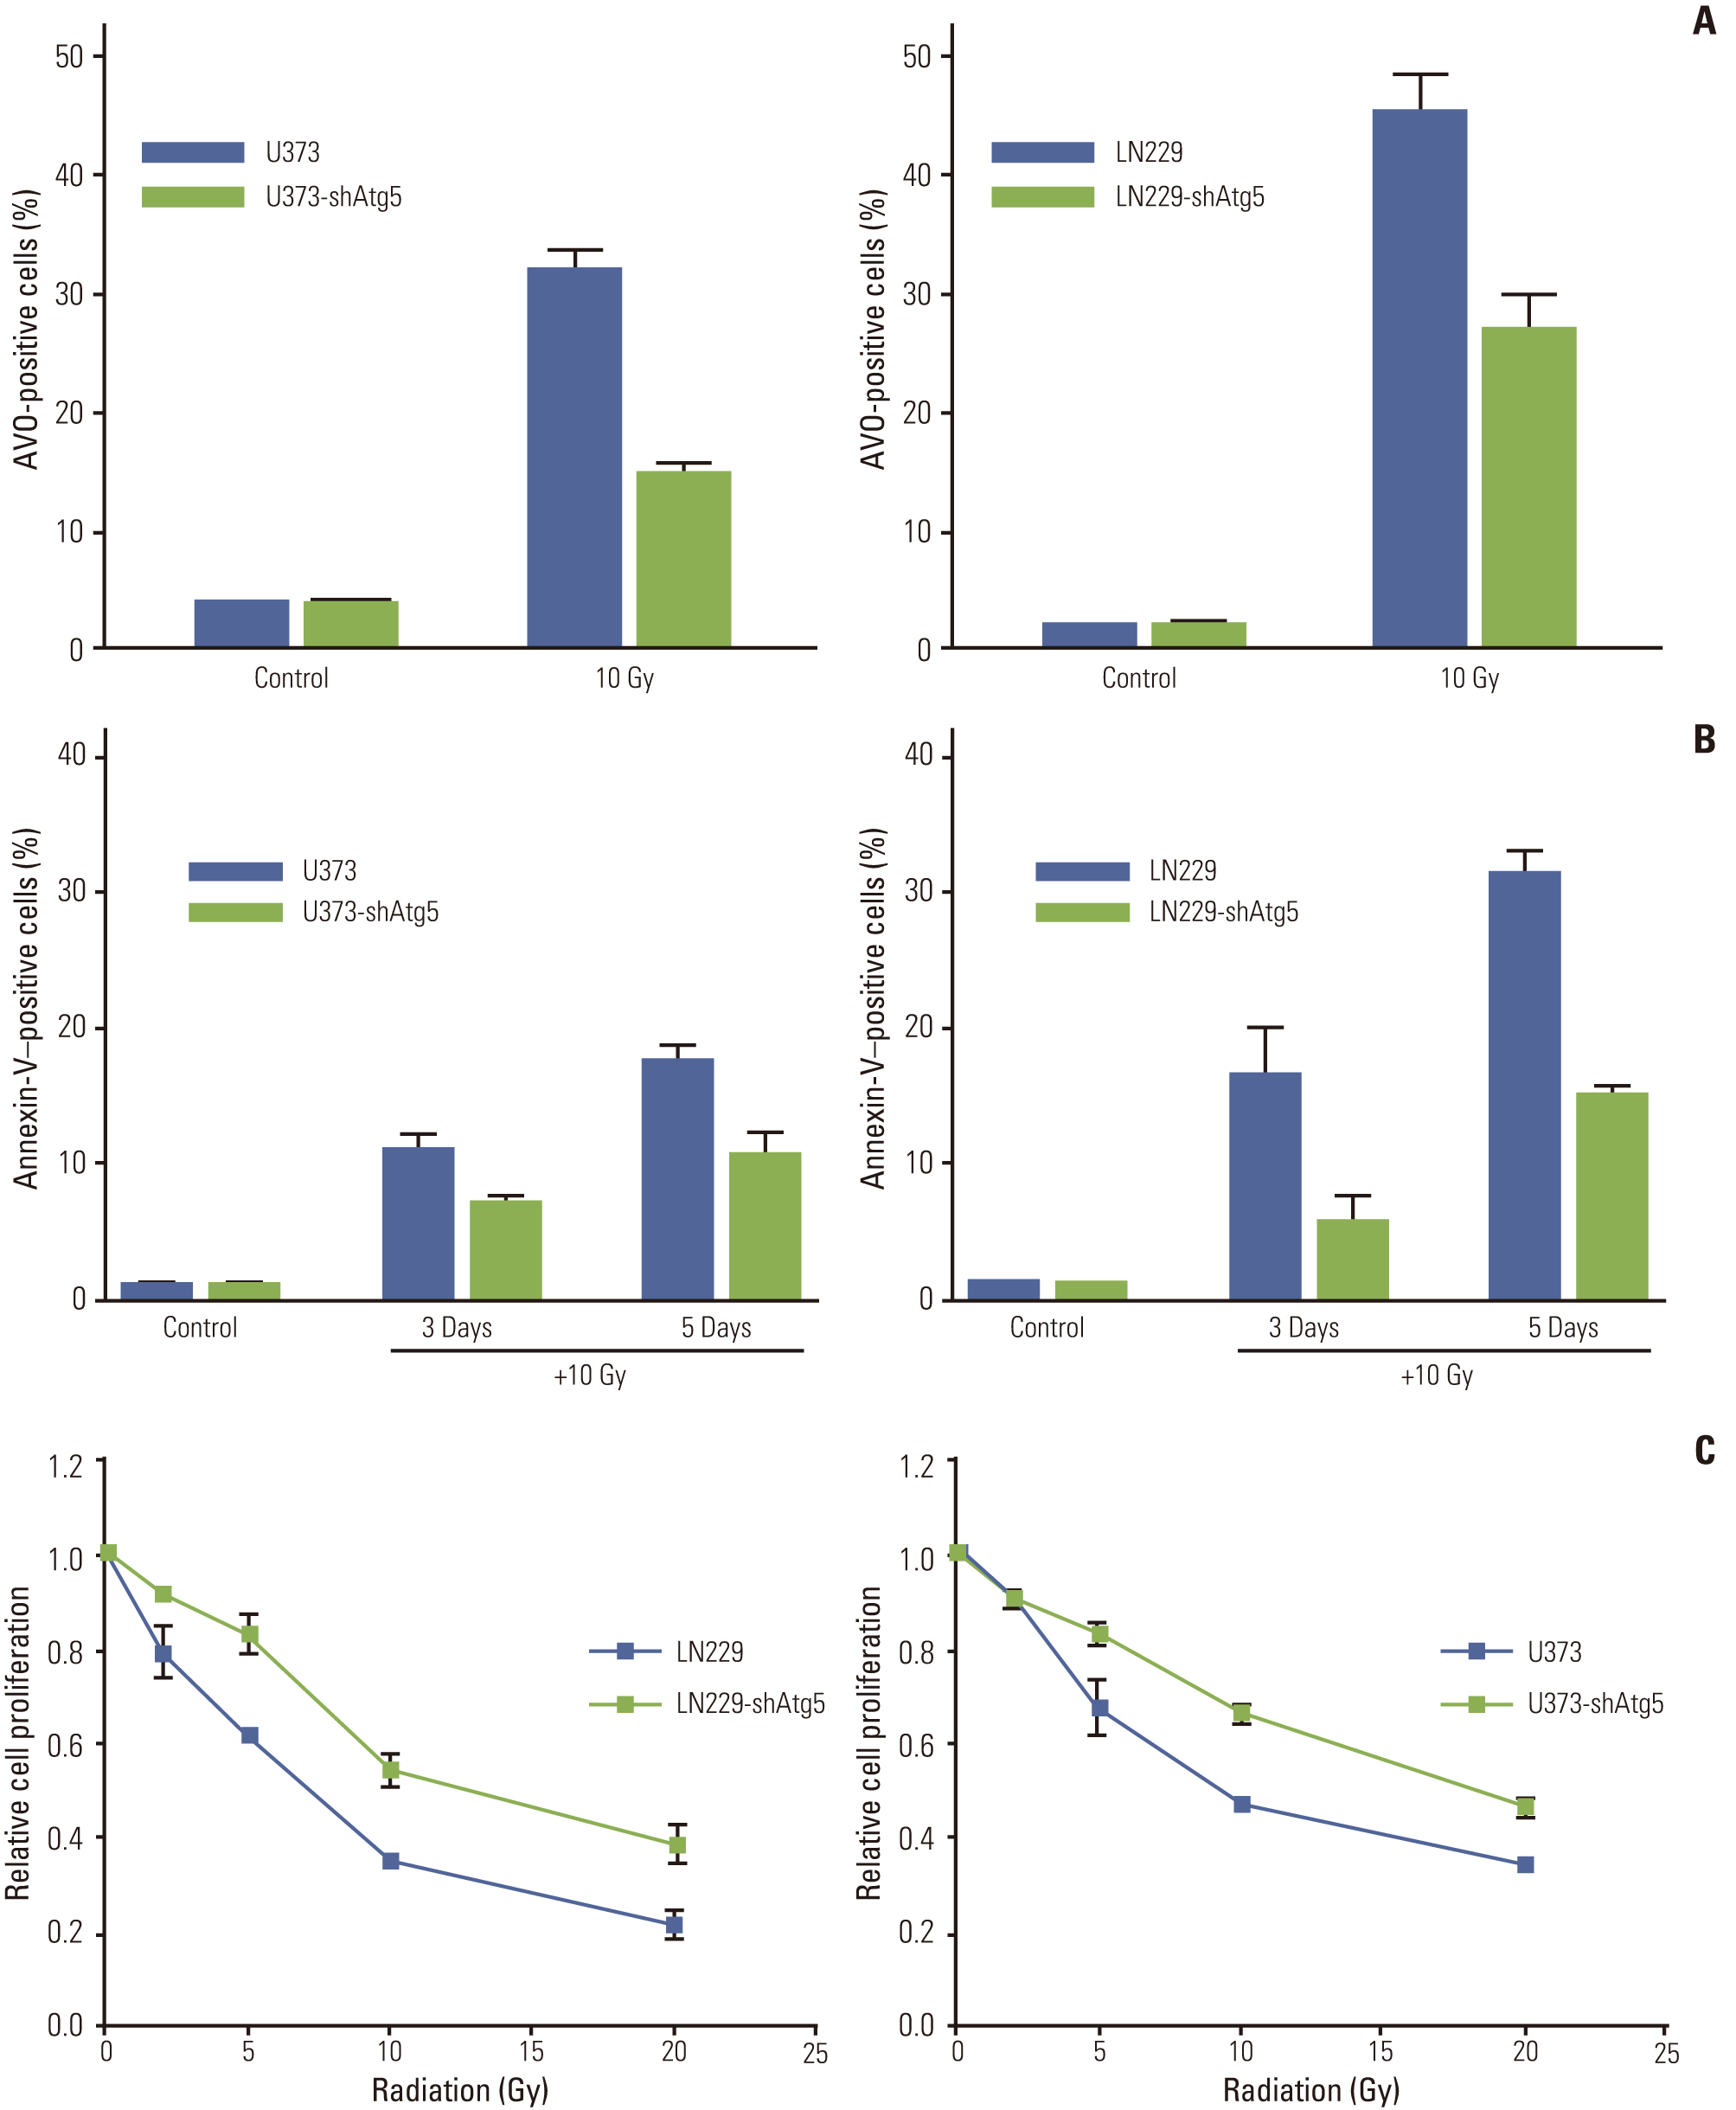
Inhibition of autophagy significantly reduces apoptosis after irradiation and results in a cell survival benefit. (A) Knockdown of Atg5 effectively inhibited autophagy formation after irradiation in both U373 and LN229 cells. (B) The inhibition of autophagy translated into reduced apoptosis measured by annexin-V staining at 3 and 5 days after irradiation with 10 Gy. (C) Cell survival assay showed that autophagy inhibition resulted in cell survival. Data from three independent experiments were combined. The error bars indicate ±standard error of mean. AVO, acidic vesicular organelle.
The effects of autophagy-inhibition by knockdown of Atg5 on apoptosis were analyzed by flow cytometry with annexin-V staining (Fig. 4B). In the U373 and LN229 cells, apoptosis after irradiation with 10 Gy decreased significantly to 65% and 35% of that in the parent cells, respectively, with the inhibition of autophagy occurring at 3 days and the inhibition of apoptosis being observed at 5 days. To evaluate whether the observed decrease of apoptosis after autophagyinhibition is related to cell death, we conducted a cell survival assay of the Atg5 knockdown cell line. The Atg5 knockdown cells showed significantly increased cell survival relative to the control group after irradiation (Fig. 4C).
These results indicated that at least some portion of radiation-induced apoptosis is dependent on the autophagic process in the tested cell lines, and that inhibition of autophagy could decrease cell death after irradiation.
6. Autophagic cells bearing markers for apoptosis after irradiation
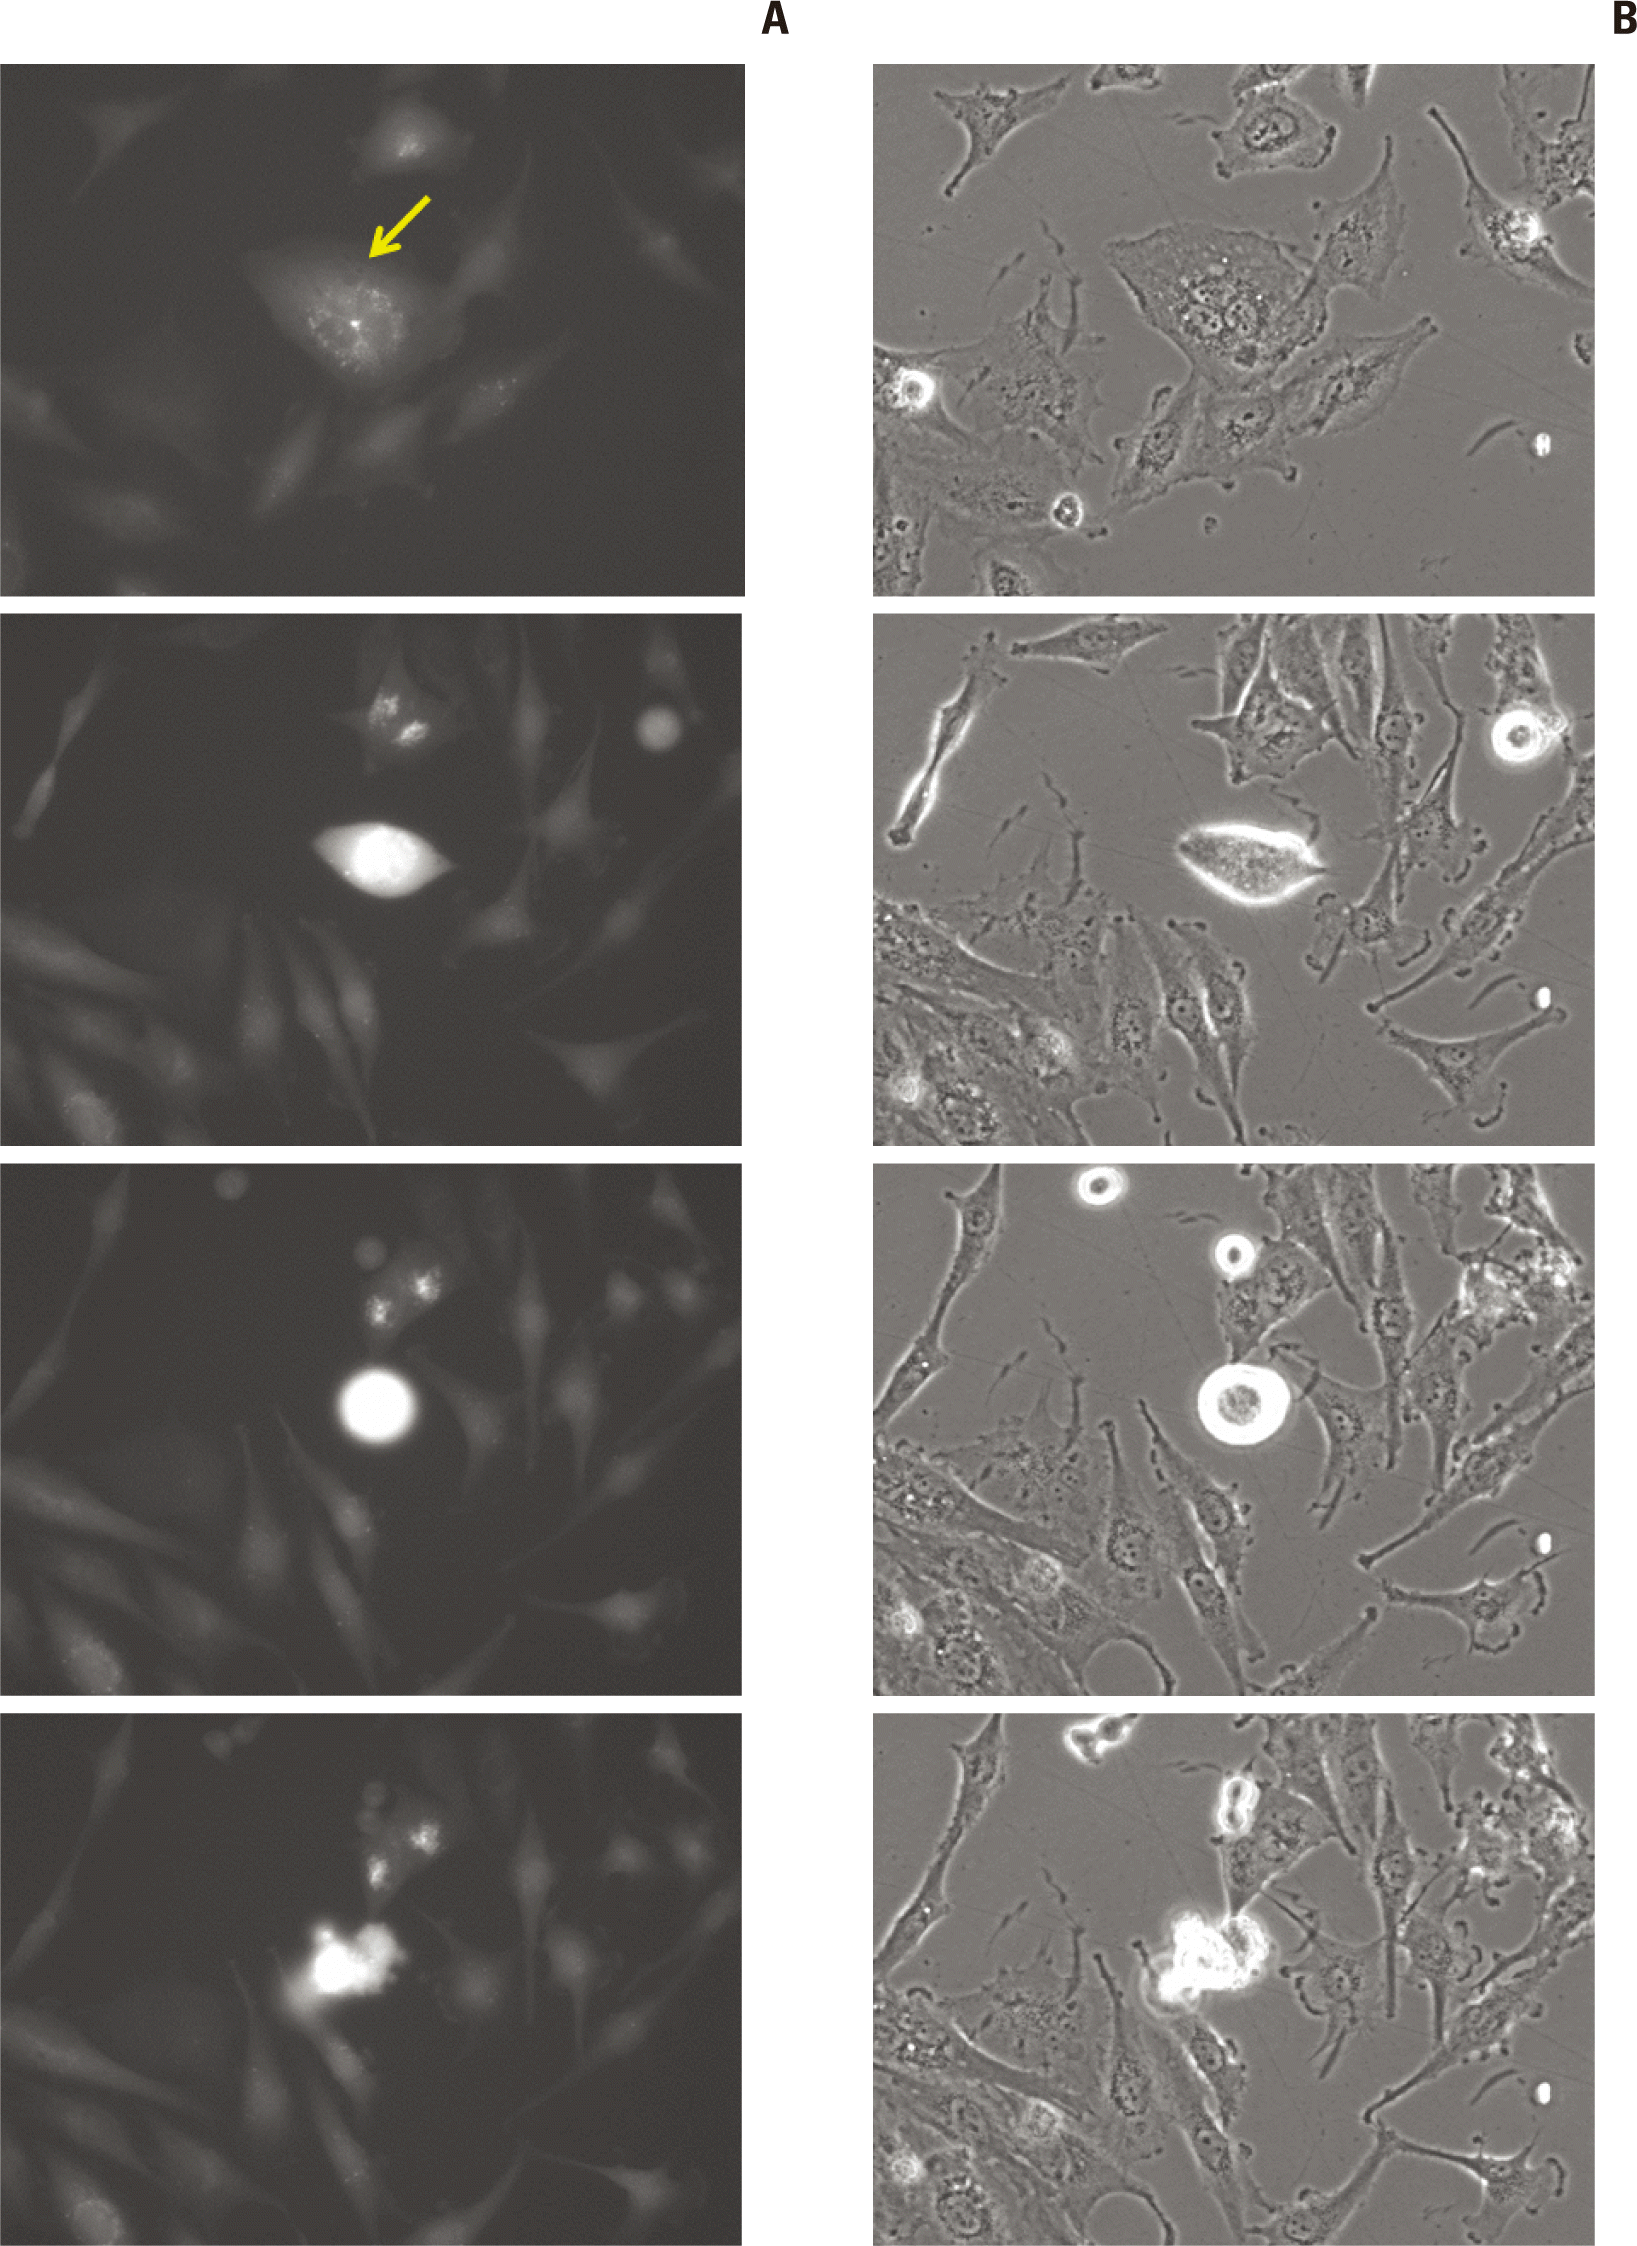
To determine if cells bearing autophagosome-accumulation, an indicator of autophagy, undergo apoptosis after irradiation, we irradiated GFP-LC3 stable transfection U373 cell lines at a dose of 10 Gy. The cells were fixed for immunofluorescence at 5 days after irradiation, when both autophagy and apoptosis were prominent in the previous experiment. Cells with punctuated GFP-LC3 dots indicating autophagy were stained with annexin-V, representing early apoptosis (Fig. 5A). These results suggest that cells bearing autophagic indicators underwent apoptosis and that autophagy could be an interim state leading to apoptosis after irradiation.
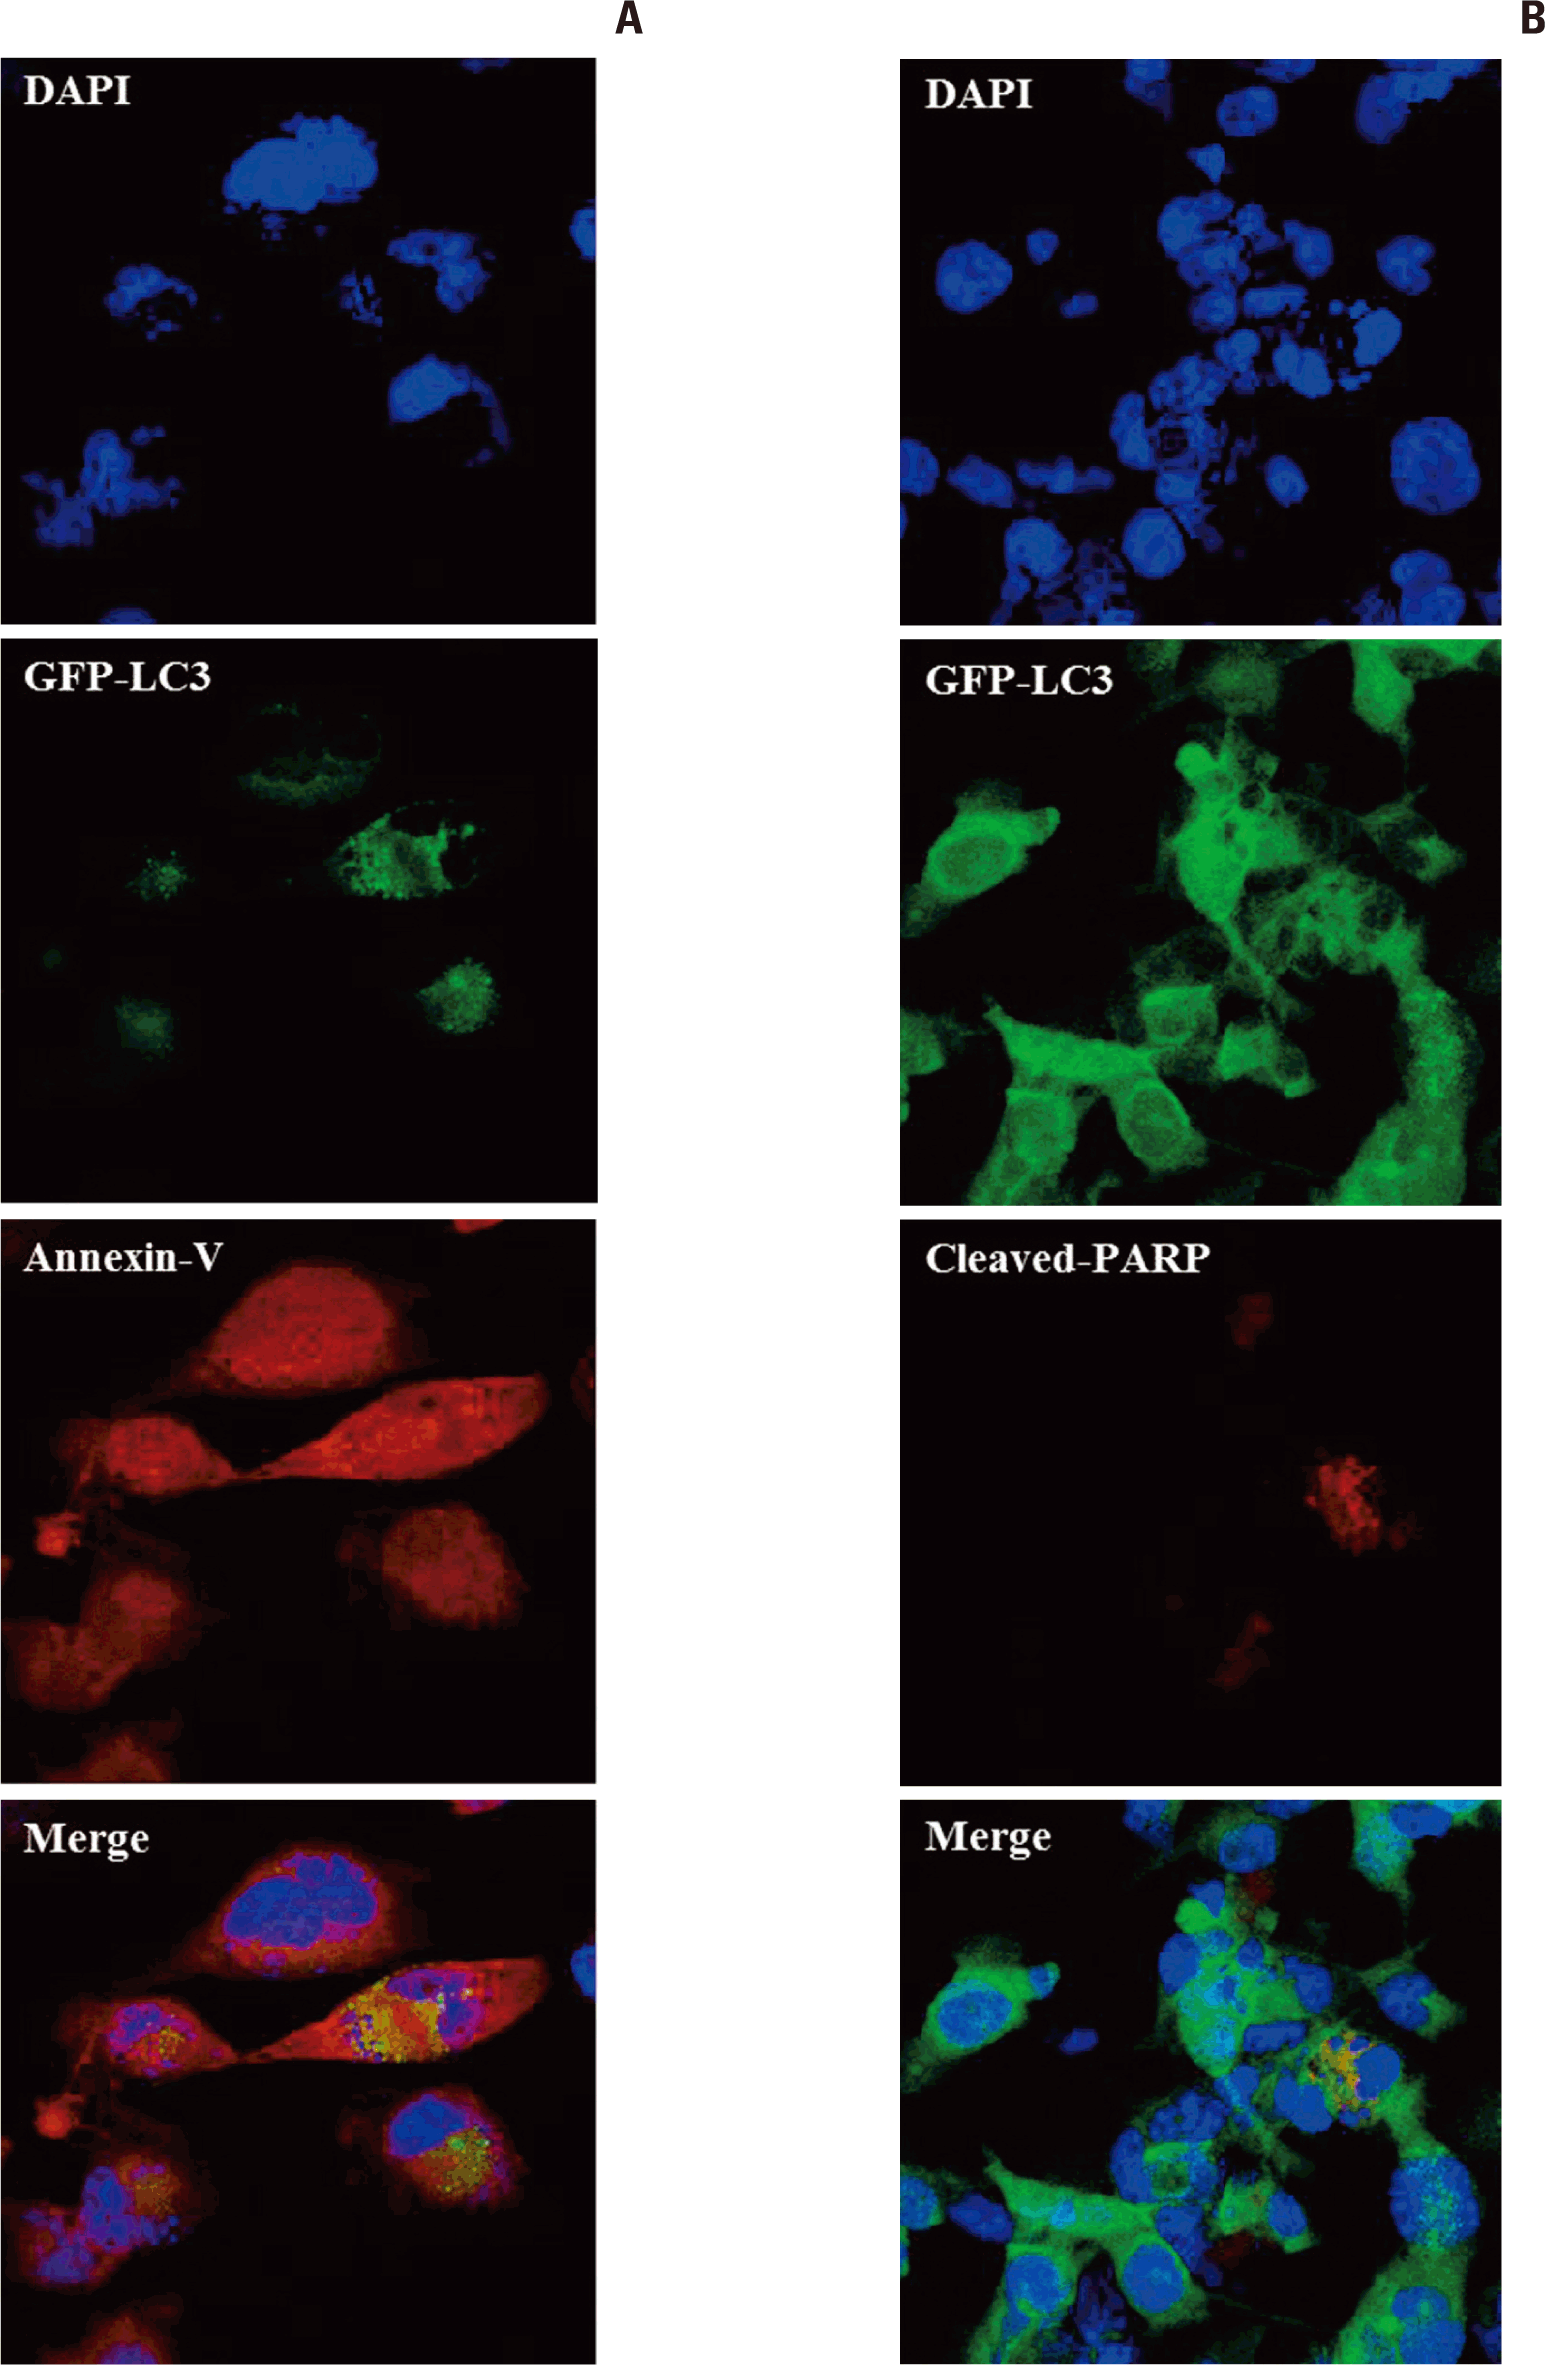
Immunofluorescence of GFP-LC3, an indicator of autophagy, stably expressing U373 cells. Annexin-V and poly(ADPribose) polymerase (PARP) were used as markers of early and late apoptosis, respectively, at 5 days after irradiation with 10 Gy (×400). (A) Annexin-V is localized to cells showing a GFP-LC3 punctuated pattern representing autophagy. This co-localization suggests that autophagic cells are being converted to apoptosis. (B) Cells positive for PARP do not show a typical punctuated pattern of GFP-LC3, but show multi-nucleated cells (aneuploidy).
Cleaved-PARP, an indicator of late apoptosis, was typically observed in multi-nucleated cells following mitotic catastrophe (Fig. 5B). These cells did not express a punctuated pattern of GFP-LC3 dots, but instead harbored condensed dots. This finding suggests that few typical punctuated GFP-LC3 were observed in the late phase of apoptosis.
7. The fate of autophagic cells after irradiation
To observe how radiation-induced autophagic cells change with time and determine if multi-nucleated cells have autophagic indicators in their initial stage, we observed GFPLC3 stable transfection U373 cells using a fluorescence live cell image analyzer from 3 to 5 days after irradiation at 10 Gy. Some autophagic cells showed condensation of their scattered GFP-LC3 granules and disruption of their cell membrane at the end of the experiment (Fig. 6A), while other GFP-LC3 granule bearing cells divided with time, after which the divided cells cleared up the LC3 dots (Fig. 6B). Although this observation was not a quantitative measurement, there was a tendency for cells bearing more dense GFP-LC3 dots to have a higher probability of undergoing cell death. This long-term observation of irradiated cells revealed that multi-nucleated cells (aneuploidy), which had shown no discrete LC3 dots but cleaved PARP staining in the previous section, showed a punctuated pattern of GFP-LC3 in the early stages of their aneuploidy or when they attempted mitosis (Appendix 4). The observation of GFP-LC3 granule bearing cells suggests that irradiated cells are commonly present with indicators of autophagy and that some of these autophagic cells eventually die via either membrane disruption or post-mitotic catastrophe.

Live cell image analysis of autophagic cells bearing punctuated GFP-LC3 dots (arrows) after irradiation (10 Gy) (× 200). (A) Autophagic cells showing clumping of LC3 dots and entering necrosis. (B) Other autophagic cells divide and are clear of LC3 dots.
Discussion
1. Cell cycle change after irradiation of MG cells
It is known that G1 arrest of the radio-sensitive cell line (U937) after high dose radiation (20 Gy) is an indicator of immediate apoptosis within several hours, while cells having sublethal radiation-induced damage (5 Gy) passed the G1 cell cycle check point, but arrested at the more stringent G2/M check point [16]. Two different types of cell death according to radiation dose were evident with different possible cell death mechanisms. The former was called pre-mitotic apoptosis, while the latter was termed postmitotic apoptosis, which was not blocked by caspaseinhibitor.
Observation of changes in cell cycle after irradiation in MG cells are rare, but Yao et al. [10] observed transient G1 arrest (A172, relatively radiosensitive cell line) or no change (T98G, radiosensitive one) at 5 Gy. However this transient G1 arrest, which had been evidence of pre-mitotic apoptosis in previous studies, was not converted to subG1 accumulation after one week, and they could find no evidence of apoptosis upon terminal deoxynucleotidyl transferase dUTP nick end labeling (TUNEL) staining. In our study, administration of 5 Gy as a sublethal dose did not induce discernible subG1 accumulation in U87 or U373 cells, but did result in transient G2/M arrest followed by subG1 accumulation in relatively radiosensitive LN229. These findings suggest that the results reported by Yao et al. [10] were indicative of sublethal irradiation, which could vary according to cell characteristics. We observed the same transient G1 arrest on day 1 after irradiation with 2 and 5 Gy in A172 cells, but G2/M arrest occurred at day 1 after irradiation and resulted in subG1 accumulation in response to treatment with 10 Gy (Appendix 5). Our observation of G2/M arrest on day 1 after irradiation followed by the appearance of apoptotic markers at 3 days after irradiation with 10 and 20 Gy was similar to the post-mitotic apoptosis reported by Shinomiya et al. [16] in response to irradiation at 5 Gy in the radio-sensitive U937 cell line.
It has been suggested that the role of G2/M arrest after exposure to radiation favors mediation of cell death rather than checking and repair of damaged DNA. A prolonged G2/M delay was observed in proportion to radiation dose, and labeling of S phase cells with BrdU revealed that cells blocked at the G2/M phase entered the subG1 phase later [16,17]. In our study, a fraction of the G2/M phase increased in proportion to radiation dose. Although we neither labeled the cells at the S phase nor abrogated G2/M transition, the degree of late apoptosis in view of subG1 accumulation also increased with time in proportion to the previous G2/M arrest. Shinomiya et al. [16] reported that G2/M arrest after irradiation could reflect post-mitotic apoptosis, which resulted from accumulation of secondary damage in cells that failed to divide but managed to survive metabolically [4]. These stressed cells activated autophagy to recycle proteins in response to increasing demand for energy.
Our observation of aneuploidy cells after irradiation by FACS was confirmed with immunofluorescence staining. Although we failed to co-localize cleaved PARP with GFPLC3 granules in these cells that failed to divide, we did observe a prominent GFP-LC3 punctuated pattern in the early phase of aneuploidy upon live cell image analysis, and most of these cells died later. This observation of aneuploidy resulting in delayed apoptosis was also observed in relatively radio-resistant non-small cell lung cancer cell lines by Stuschke et al. [18].
2. Is radiation-induced apoptosis caspase-independent?
Autophagy and mitotic catastrophe are alternative PCD pathways to apoptosis, and these cell death pathways are independent of caspase, which is an essential executor of apoptosis. In the experiment conducted to investigate late apoptosis with non-small cell lung cancer cell lines, neither over-expression of apoptosis inhibitor (Bcl-2 or Bcl-xL) nor pan-caspase inhibitor (Z-VAD-FMK) showed any protective effect against cell death [19]. We observed apoptosis based on annexin-V staining after irradiation in MG cells and found that it was not influenced by caspase inhibitor.
In a model of high-dose lethal irradiation developed by Shinomiya et al. [16], activation of caspase-3 was a very early event that occurred within one hour, and early apoptosis (pre-mitotic apoptosis) was effectively blocked by caspase inhibitor. However, in their experiments, the addition of caspase-inhibitor to the low-dose (5 Gy) post-mitotic apoptosis model could not reduce the PARP cleavage rate. Shinomiya et al. [16] interpreted their results as an accumulation of changes in the cellular environment in response to reactive oxygen species, ceramide formation or cytochrome C release at 24 hours or later after irradiation and reported that their cell death could be independent of caspases.
Caspase independent apoptosis can occur via one of the following routes: 1) late onset intracellular changes induces apoptosis via a detour in the caspase cascade, 2) early apoptotic marker of annexin-V is not only coupled to caspasedependent apoptosis, but also to PCD other than apoptosis, 3) time lapse between the duration of action of caspase inhibitor and initiation of caspase activation. Cummings et al. [20] reported that apoptosis measured by annexin-V staining was reduced with Z-VAD-FMK in cancer cells treated with cisplatin and staurosporine, but that the percentage of TUNEL staining was not affected or only partially decreased with caspase-inhibition. They suggested that a significant proportion of apoptosis induced by diverse toxicants is caspase-independent. To investigate this, we treated cells with caspase inhibitor 2 days after irradiation; however, we still saw no change in apoptosis rate (data not shown). Although PARP is a substrate of caspase-3, PARP cleavage, which we observed as a late apoptosis marker after irradiation, could occur from cellular damage via either apoptosis or non-apoptotic cell death [21].
3. Role of autophagy in radiation-induced cell death and/or apoptosis
Most studies of radiation-induced apoptosis mechanisms were performed before 2000, when autophagy was first considered, and most studies conducted in this period used cell of lymphoid lineages, in which apoptosis is the main pathway of cell death after irradiation. Thus, few studies investigating the relationship among late apoptosis, autophagy, and apoptosis have been conducted to date. Autophagy can be an indicator of accumulated intracellular stress as in starvation or exposure to noxious stimuli, including radiation.
Therefore, we examined the relationship between autophagy and apoptosis in MG cells after irradiation by inhibition of autophagy using knockdown of autophagyrelated proteins. Although autophagy after radiation is proportional to radiation dose, it is not clear that the degree of autophagy is related to radiosensitivity. Among the measurements of autophagy activity in this study, flow cytometry of AVO, the ratio of LC3 protein bands, and the observation of GFP-LC3 did not accurately reflect direct radiosensitivity since the degrees observed were relative and the basal levels differed between cell lines [22]. Thus, only chronological changes in a cell line or dose-dependency at a certain time point could be obtained. Nevertheless, our study demonstrated knockdown of Atg5 decreased autophagy and reduced autophagy measured by AVO formation, resulting in decreased apoptosis. However, it is still not clear if this autophagy-inhibition related reduction of apoptosis is autophagy-dependent or the direct effect of Atg5 knockdown. Atg5 has been nominated as a switch molecule to convert autophagy into apoptosis [12,13]. Independent of its function in autophagy, Atg5 can be cleaved following death stimuli, and the cleaved product appears to promote mitochondria-mediated apoptosis [23]. Therefore, knockdown of the pro-apoptotic molecule Atg5 could cause the inhibition of apoptosis directly. Yousefi et al. [12] reported that Atg5-overexpressing cells exhibit sensitization to various death stimuli, and that silencing of Atg5 reduces drug-induced cell death. Truncated Atg5 (24-kDa) translocated from the cytosol to mitochondria, triggering cytochrome c release and caspase activation. However, the role of Atg5 provoking apoptotic cell death according to the different kinds of death stimuli remains elusive [12].
Various data indicate a potential interconnection between autophagy and apoptosis. Shimizu et al. [24] tested the role of autophagy in a Bax/Bak double knockout system and found that autophagy suppression by 3-MA reduced nonapoptotic cell death, and that the suppression was dependent on autophagic activity and Atg5. Kim et al. [25] confirmed the role of radiation-induced autophagy as Bax/Bak double knockout cancer cells (Bax/Bak–/–), which were defective in undergoing apoptosis, showed more radio-sensitivity than parent cells and enhanced autophagy after irradiation. These experiments indicate that autophagy is a cell death pathway after exposure to therapeutic intervention including radiation, especially under apoptosis-defective conditions.
In our experiment, inhibition of autophagy by knockdown of Atg5 reduced radiation-induced apoptosis, and in turn, cells were partially protected from the cell death after irradiation. Our experiment of MG cell lines with 20 Gy or less irradiation is similar to apoptosis-defective condition in terms of delayed appearance of annexin-V staining and lack of TUNEL staining. However, autophagy is a primary, dosedependent, cellular response to radiation of 20 Gy or less in MG cells. Thus, we could assume that autophagy in MG cell lines after irradiation is at least partially responsible for cell death, suggesting that it is important to sensitize MG cells to radiation to control autophagy after irradiation.
Conclusion
We demonstrated that autophagy appears earlier (1 day after irradiation) than apoptosis (3 or more days after irradiation) in MG cells subjected to radiation at clinically applicable doses. Inhibition of autophagy reduced apoptosis, which was independent of caspase activation, partially protected cells from radiation-induced cell death. Immunofluorescence of GFP-LC3, an autophagy marker, co-localized with annexin-V, an early apoptotic indicator after irradiation at lethal doses (10 Gy). Additionally, tracking of GFP-LC3 bearing cells using a live cell image analyzer revealed that some autophagic cells clear-up autophagosomes after mitosis, while others failed to divide and condensed and died. These findings suggest that autophagy is a cell death pathway after irradiation in MG cells.
Notes
Conflict of interest relevant to this article was not reported.
Acknowledgements
This work was supported by the Basic Science Research Program through the National Research Foundation of Korea funded by the Ministry of Education, Science and Technology [2009-0089971; 2010-0016811].
References
Appendices
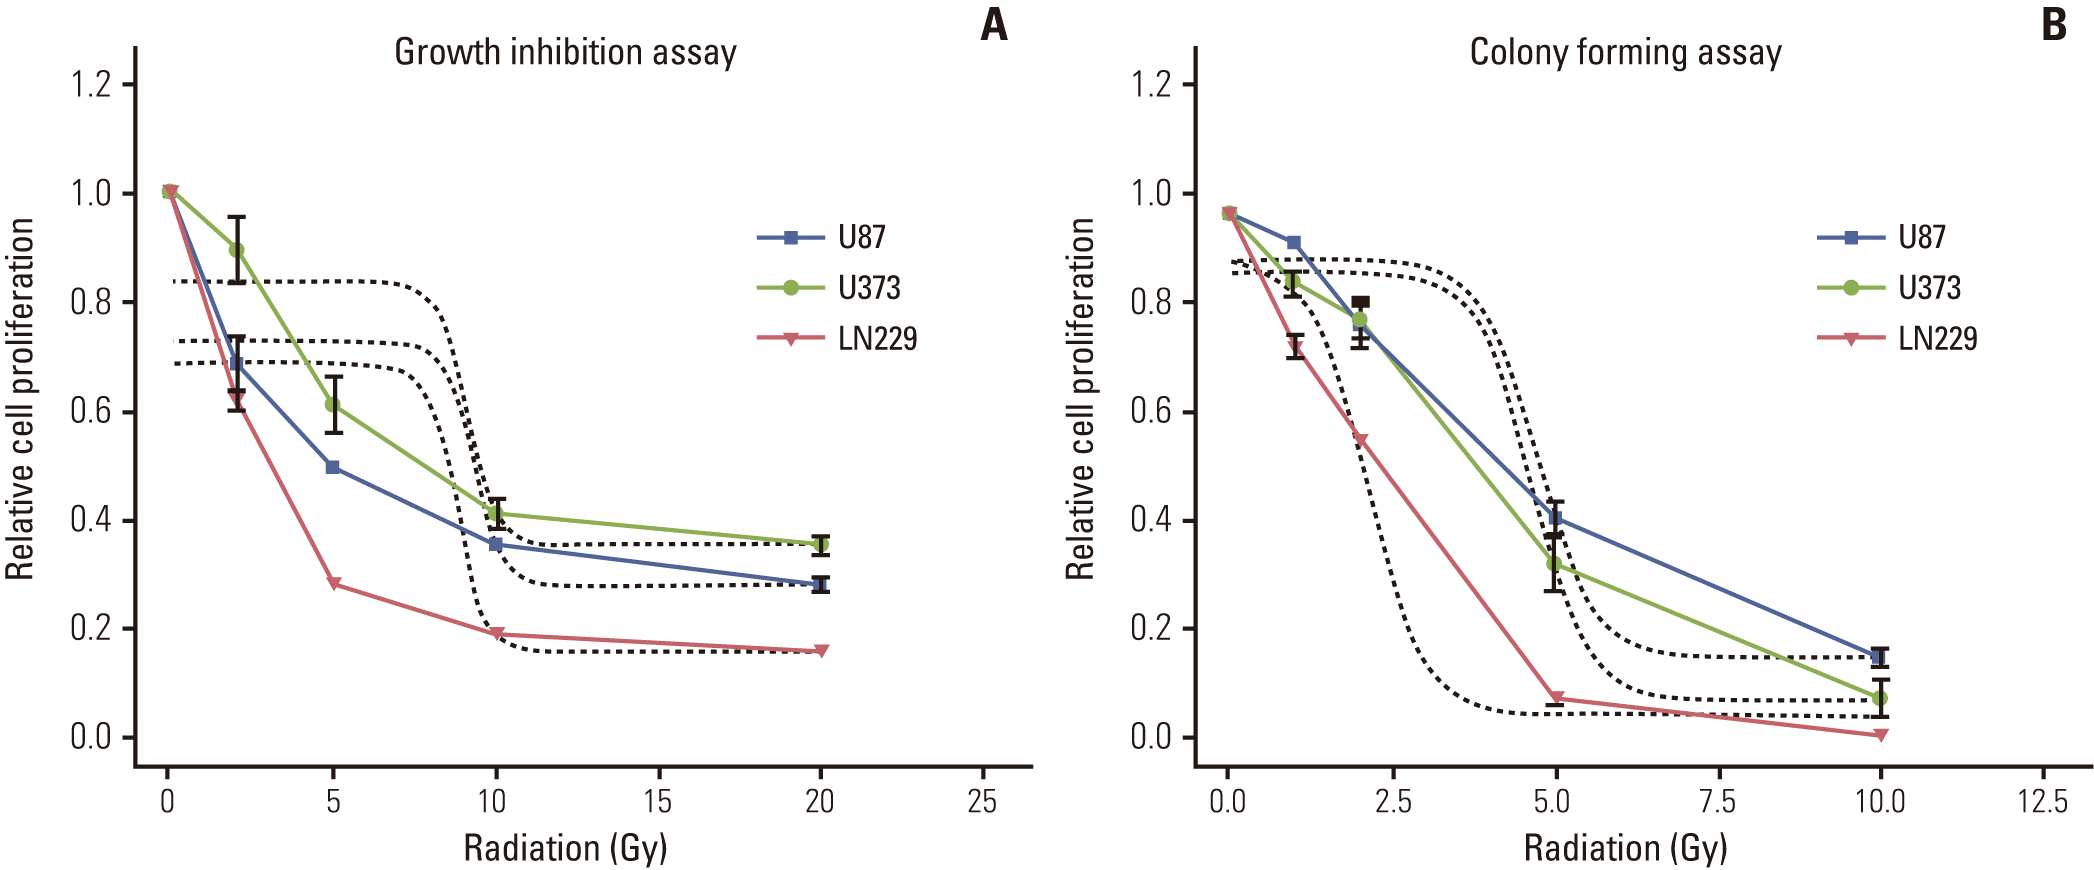
Cell survival after radiation measured by growth inhibition assay (A) and colony forming assay (B) after irradiation in malignant glioma cell lines. Malignant glioma cells (U87, U373, and LN229) were plated at 96 wells at subconflucency or 60-mm plate at clonal density. Different dose of radiation as indicated on the abscissa was given to determine dose-response relationship and effective dose of killing 50% of cells (ED50). ED50 is around 10 Gy in growth inhibition assay while it is less than 5 Gy in colony forming assay (Dotted lines are representing curve fit for sigmoid dose response model). Data from three independent experiments were combined and error bars indicate ±standard error of means.

In LN229 cell, radiation up to 30 Gy dose not change caspase-3 level on Western blot. Whereas staurosporin (1 μM), which is well-known apoptosis inducer reduces caspase-3 level dose and time dependently. Cleaved caspase-3, a by-product of caspase-3 activation, is only observed in HT-29 colon cancer cell line 48 hours after exposure. (B) In U373 cell, radiation dose not change caspase-3 level while staurosporin reveals decrease of caspase-3 level.
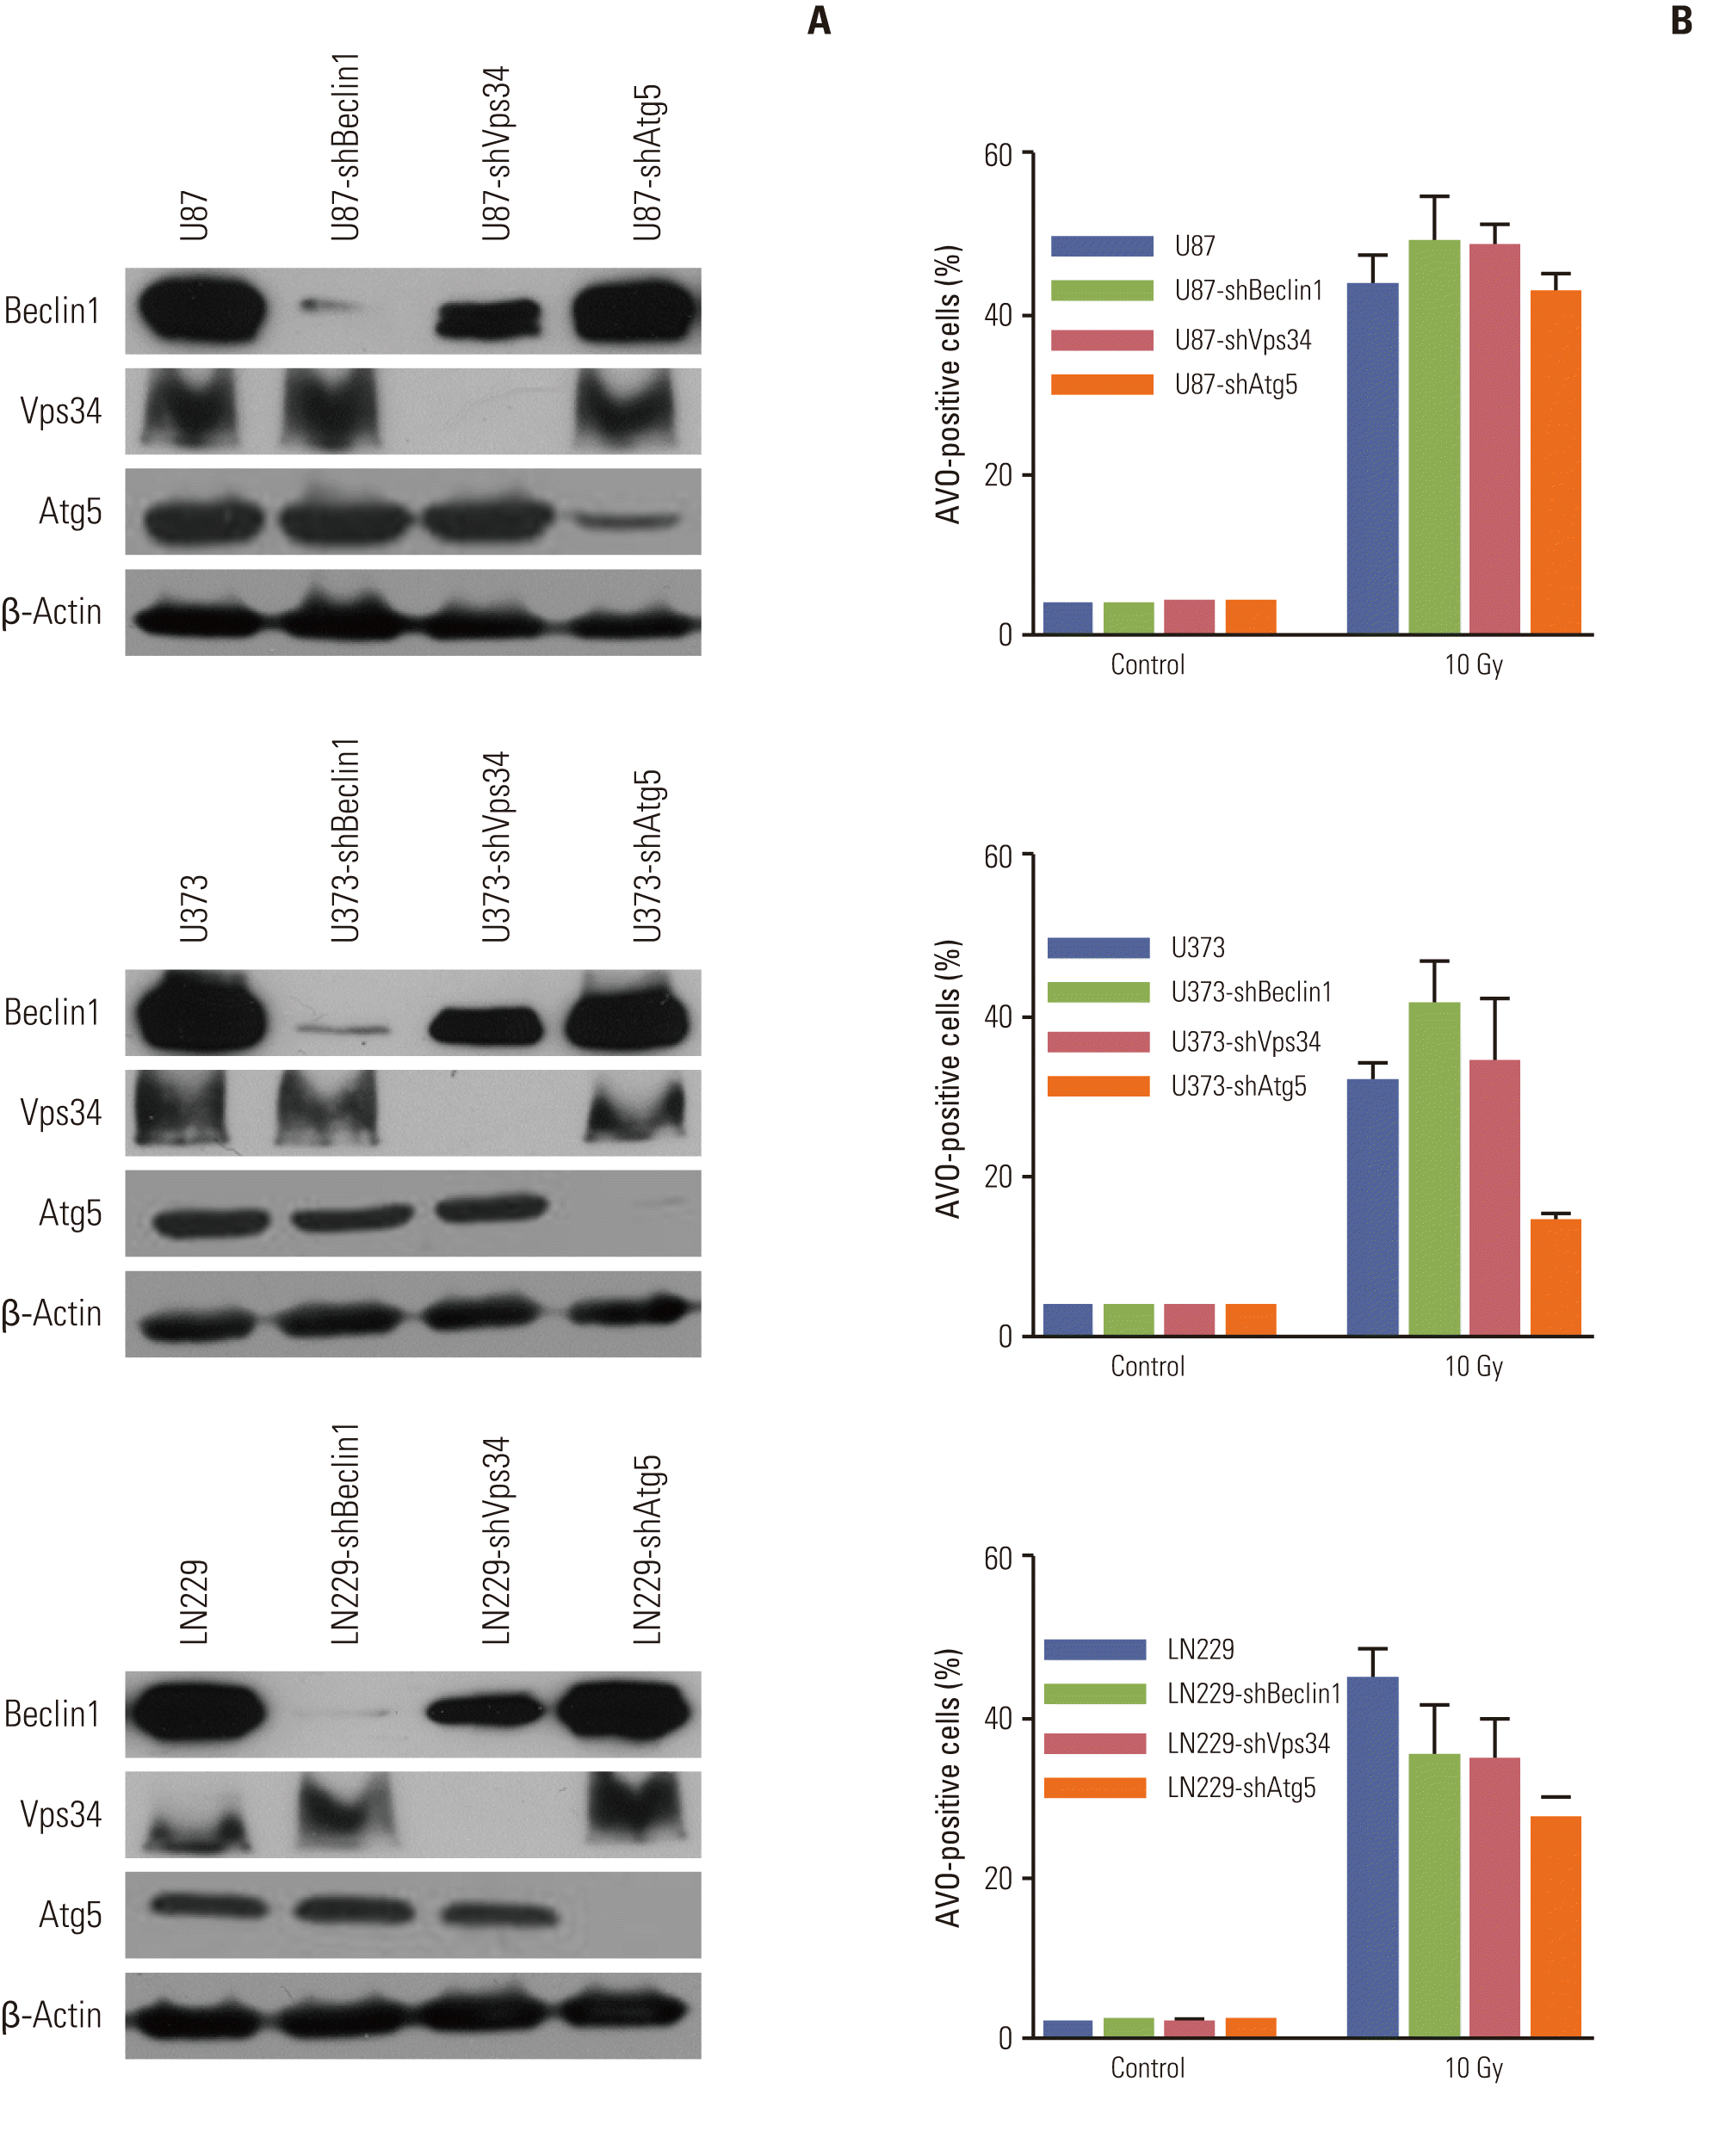
(A) Knockdown of autophagy-related proteins by lentiviral transfection of shRNA is confirmed by Western blot. (B) The inhibition of autophagy by Knockdown of autophagy-related proteins was varied among the target proteins and only Atg5 can effectively decrease autophagy after irradiation in both U87 and LN229 cells. AVO, acidic vesicular organelle.
(A) Live cell imaging of GFP-LC3 bearing multi-nucleated cells (arrow) reveals typical punctuated pattern of LC3 granules during evolutionary phase under fluorescence. (B) The nucleus is seen clearly in the differential interference contrast images.
Cell cycle analysis of A172 cells. G1 transition at 2 and 5 Gy is not converted to subG1 accumulation up to 7 days. However, irradiation of 10 Gy induces G2/M arrest followed by subG1 accumulation.