Cancer Statistics in Korea: Incidence, Mortality, Survival, and Prevalence in 2011
Article information
Abstract
Purpose
This study aimed to report nationwide cancer statistics in Korea, including incidence, mortality, survival, and prevalence, and their trends.
Materials and Methods
Incidence data from 1993 to 2011 were obtained from the Korea National Cancer Incidence Database, and vital status was followed through December 31, 2012. Mortality data from 1983 to 2011 were obtained from Statistics Korea. Crude and age-standardized rates for incidence, mortality, and prevalence, and relative survival were calculated.
Results
A total of 218,017 cancer cases and 71,579 cancer deaths were reported to have occurred in 2011, and there were 1,097,253 prevalent cases identified in Korea as of January 1, 2012. Over the past 13 years (1999-2011), overall incidence rates have increased by 3.4% per year. The incidence rates of liver and cervical cancers have decreased, while those of thyroid, breast, prostate, and colorectal cancers have increased. Notably, thyroid cancer increased by 23.3% per year in both sexes, and became the most common cancer since 2009. The mortality for all cancers combined decreased by 2.7% per year from 2002 to 2011. Five-year relative survival rates of patients diagnosed in the last 5 years (2007-2011) have improved by 25.1% compared with those from 1993 to 1995.
Conclusion
Overall cancer mortality rates have declined since 2002 in Korea, while incidence has increased rapidly and survival has improved.
Introduction
Cancer has been the leading cause of death in Korea since 1983 [1] and is the most burdensome disease [2]. More than 200,000 new cancer cases are diagnosed in Korea each year, and cancer is responsible for one in four total deaths [3]. This article reports the most recent nationwide cancer statistics in Korea, including incidence, mortality, survival, prevalence, and their trends.
1. Data sources
The Ministry of Health and Welfare, Korea, initiated a nationwide hospital-based cancer registry called the Korea Central Cancer Registry (KCCR) in 1980. The registry collected 80-90% of cancer cases annually from more than 180 training hospitals throughout the country. In 1999, the KCCR expanded cancer registration to cover the entire population under the Population-Based Regional Cancer Registry program. Details of the history, objectives, and activities of the KCCR have been documented elsewhere [4]. Incidence data for 1999-2011 were obtained from the Korea National Cancer Incidence Database (KNCI DB). The completeness of incidence data for 2011 was 97.1%, as determined by the Ajiki method [5].
Cancer cases were classified according to the International Classification of Diseases for Oncology, 3rd edition [6] and converted according to the International Classification of Diseases, 10th edition (ICD-10) [7]. The survival analysis used 2,197,413 cancer cases first diagnosed between 1993 and 2011 from the KNCI DB, and followed vital status until December 31, 2012.
Mortality data from 1983 to 2011 were obtained from Statistics Korea [1]. Cause of death was coded and classified according to ICD-10 [7]. Population data were also obtained from Statistics Korea using the resident registration population on July 1 of specified years.
2. Analysis
Crude rates (CRs) and age-specific rates of cancer incidence and mortality were calculated. Age-standardized rates (ASRs) were calculated using Segi's world standard population [8]. Cumulative risks of cancer, which represent the probability of developing cancer during one's lifetime, were also calculated. Changes in the annual ASRs of cancer incidence were examined by calculating the annual percentage change over a time period as (exp(b)-1)×100, where b is the slope of the regression of log ASR for a given calendar year [9].
Prevalence was also calculated to assess cancer burden, which includes new and pre-existing cancer patients diagnosed during a given time period still alive on an index date. Using cancer incidence database data from 1999 to 2011, we defined prevalent cases as patients who were diagnosed between January 1, 1999 and December 31, 2011, and still alive on January 1, 2012. We calculated limited-duration prevalences, namely, 1- and 5-year prevalences. For example, the 5-year prevalence was calculated as the number of people alive on January 1, 2012 who had been diagnosed with cancer within the previous 5 years. We applied this counting method using the SEER*Stat software [10] to calculate the number of cases while adjusting for patients lost to follow-up.
The survival duration for each case was determined as the interval between the date of initial diagnosis and the date of death, date of loss to follow-up, or closing date for follow-up. Observed survival rates were calculated using the life-table method and relative survival rates with the Ederer II method [11] were based on an algorithm written in SAS by Paul Dickman [12], with some minor modifications.
Selected Findings
1. Incidence
The overall number of incident cancer cases, deaths, and prevalent cases by sex and cancer site for 2011 in Korea are shown in Table 1. A total of 218,017 incident cancer cases and 71,579 deaths were reported to occur in 2011. As of January 1, 2012, 1,097,253 prevalent cancer cases diagnosed between 1999 and 2011 were identified. The cumulative risk of developing cancer during one's lifetime in 2011 was 38.1% for males and 33.8% for females.
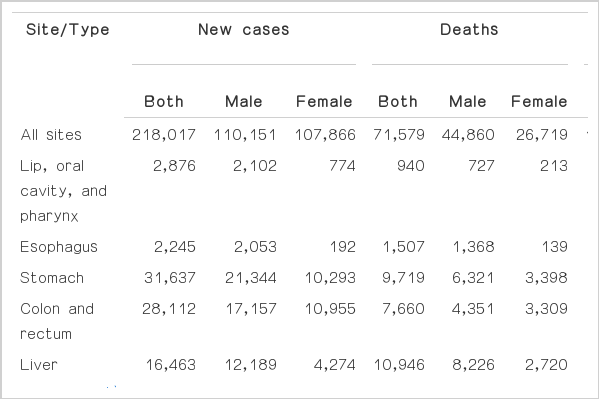
2011 Cancer incidence, prevalence, and deaths by sex in Korea
The cancer incidence rates in 2011 by sex and cancer site are shown in Table 2. The 2011 CRs per 100,000 of all sites combined were 439.2 and 431.0 for males and females, respectively. The ASRs per 100,000 of all sites combined were 332.9 and 286.2 for males and females, respectively. In males, the five leading primary cancer sites were stomach (CR, 85.1; ASR, 63.3), colon and rectum (CR, 68.4; ASR, 51.4), lung (CR, 60.5; ASR, 46.0), liver (CR, 48.6; ASR, 35.6), and prostate (CR, 35.7; ASR, 27.4), which together accounted for 67.9% of all newly diagnosed cancers in 2011. In females, the most common cancer site was thyroid (CR, 134.1; ASR, 96.8), followed by breast (CR, 63.7; ASR, 43.8), colon and rectum (CR, 43.8; ASR, 26.4), stomach (CR, 41.1; ASR, 25.1), and lung (CR, 26.3; ASR, 15.1), which together accounted for 71.7% of all newly diagnosed cancers. Thyroid cancer alone accounted for 31.1% of incident cases (n=33,562) among females in 2011.

Crude and age-standardized cancer incidence rates by sex in Korea, 2011
2. Mortality
A total of 71,579 cancer deaths were reported in Korea for 2011, accounting for 27.8% of all deaths (Table 3). In 2011, the CRs per 100,000 for all sites combined were 178.9 and 106.7 in males and females, respectively. The ASRs per 100,000 for all sites combined were 137.3 and 59.1 for males and females, respectively. Cancers of the lung, liver, stomach, and colon/rectum were the main leading causes of cancer death, together accounting for approximately 61.7% of all cancer deaths in 2011 (Table 4).

The top 10 leading causes of death in Korea for 2011

Crude and age-standardized cancer mortality rates by sex in Korea, 2011
In males, the five most common sites of cancer death in 2011 were lung (CR, 45.9; ASR, 35.0), liver (CR, 32.8; ASR, 24.3), stomach (CR, 25.2; ASR, 19.3), colon and rectum (CR, 17.3; ASR, 13.4), and pancreas (CR, 9.5; ASR, 7.3). In women, lung cancer (CR, 17.4; ASR, 9.1) was the leading cause of cancer death in 2011, followed by stomach (CR, 13.6; ASR, 7.1), colon and rectum (CR, 13.2; ASR, 6.9), liver (CR, 10.9; ASR, 6.1), and breast (CR, 8.0; ASR, 5.2).
3. Trends in cancer incidence
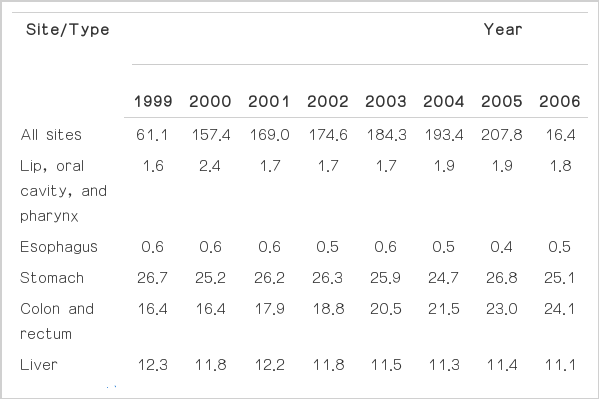
The cancer incidence rates from 1999 to 2011 in Korea for all sites combined and for selected sites are shown in Tables 5,6,7. The incidence for all sites combined increased by 3.4% per year (1.6% in males, 5.4% in females) from 1999 to 2011. The rapid increase in cancer incidence is also illustrated in Fig. 1.

Trends in cancer incidence rates for both sexes from 1999 to 2011 in Korea

Trends in cancer incidence rates in males from 1999 to 2011 in Korea
Trends in cancer incidence rates in females from 1999 to 2011 in Korea
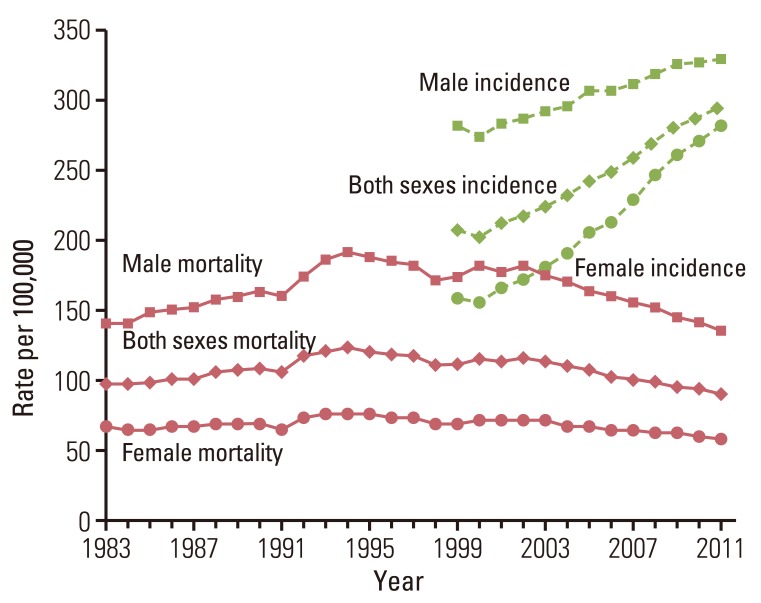
Annual age-standardized cancer incidence and death rates by sex for all sites from 1983 to 2011 in Korea. Age standardization was based on the world standard population.
The incidence rates for colorectal and thyroid cancers have continued to increase in both sexes, as have those for prostate cancer in males and breast cancer in females (Fig. 2). In contrast, the incidences of liver cancer in both sexes, lung cancer in males, and cervical cancer in females have decreased. Notably, thyroid cancer increased by 23.3% per year rapidly in both sexes, and became the most common cancer since 2009. Improvements in the sensitivity of diagnostic techniques for thyroid cancer, such as the advent of ultrasound and fine-needle aspiration, have enabled the detection of small-sized thyroid cancers. Furthermore, screening rates have increased. Therefore, the increased incidence of thyroid cancer might reflect the identification of previously undetected diseases rather than a true increase in the occurrence of thyroid cancer [13,14,15,16]. Furthermore, due to the construction of a 1999-2011 KNCI DB, the completeness of the Korean cancer registry data has improved gradually, and this may have contributed, in part, to the gradual overall increases in cancer incidence, particularly among elderly patients.
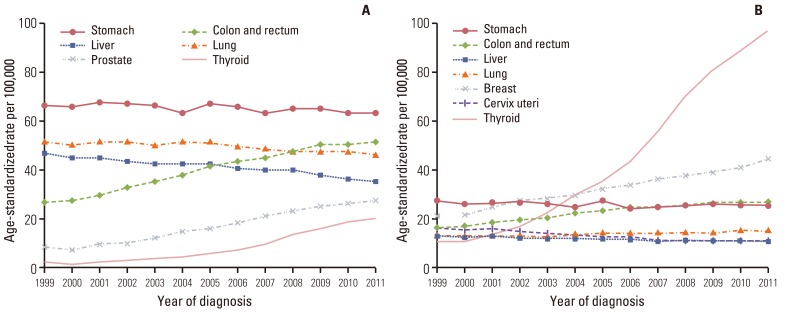
Trends in age-standardized incidences of selected cancers by sex from 1999 to 2011 in Korea. Age standardization was based on the world standard population. (A) Male. (B) Female.
4. Age-specific incidence rates
The most common cancer sites by sex and age group in 2011 are shown in Table 8. Leukemia and thyroid cancer were the most common cancer in both sexes in patients aged 0-14 and 15-34 years, respectively. For males, stomach cancer was the most common cancer in those aged 35-64, while lung cancer was more frequent among patients aged 65 and over. Thyroid cancer was the most common cancer in females aged 35-64 years, and colorectal cancer was the most common cancer among older females aged 65 and over.

The five major sites of cancer incidence by age group and sex for 2011 in Korea
The age-specific incidence rates for selected cancers in males and females in 2011 are shown in Fig. 3. The graphs show that the incidences of stomach, lung, liver, and colorectal cancers increased gradually with age. Incidences of breast and thyroid cancers in females were highest among patients in their late 40s and early 50s, respectively, and leveled off thereafter. The age-specific pattern of breast cancer is different from those in Western countries [17].
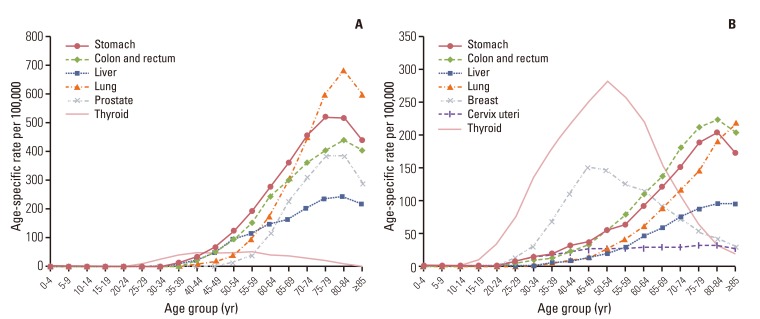
Age-specific incidence rates of major cancers for 2011 in Korea. (A) Male. (B) Female.
5. Trends in cancer mortality
The trends in cancer deaths for all sites combined and for selected sites are shown in Figs. 1 and 4. ASRs of mortality for all sites combined decreased 2.7% per year in both sexes since 2002. Lung cancer surpassed stomach cancer as the leading cause of cancer death in 1999 and is expected to account for 22.2% of all cancer deaths in 2011. However, the ASRs of mortality due to lung cancer have decreased slightly in both males and females since 2002. The ASRs of mortality due to stomach and uterus cancers also have decreased continuously. Along with significant increases in colorectal, prostate, and female breast cancer incidence rates, mortality rates of these cancers have also continued to increase.
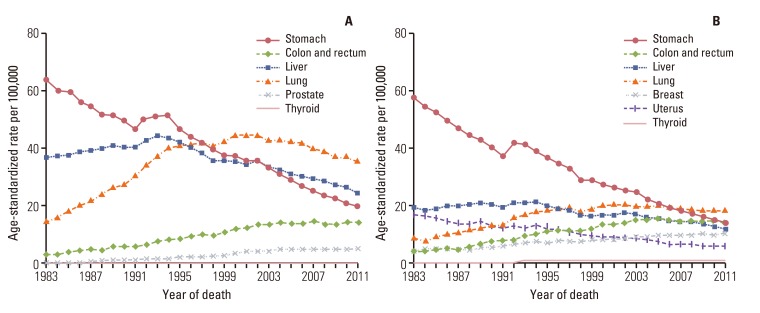
Annual age-standardized cancer mortalities of selected cancers by sex from 1983 to 2011 in Korea. Age standardization was based on the world standard population. (A) Male. (B) Female.
6. Survival rates
The trends in relative survival for all sites combined among both sexes by year of diagnosis from 1999 to 2011 are shown in Fig. 5. The relative survival for all sites combined increased with year of diagnosis, and also increased when we excluded thyroid cancer cases in our analysis.
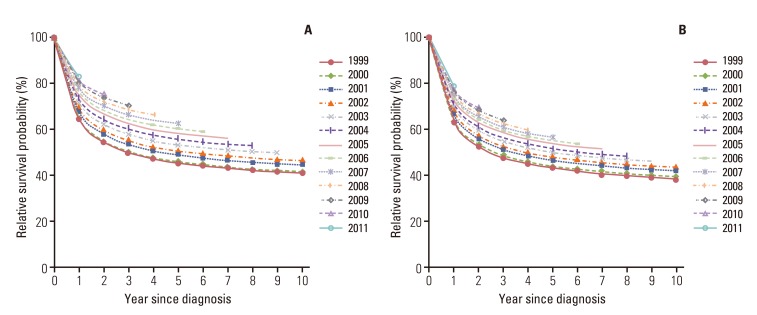
Trends in relative survival by year of diagnosis from 1999 to 2011. (A) All sites for both sexes. (B) All sites except thyroid cancer for both sexes.
Table 9 shows the 5-year relative survival rates for four diagnosis periods: 1993-1995, 1996-2000, 2001-2005, and 2007-2011. Patients who were diagnosed with cancer in the most recent period (2007-2011) had a 5-year relative survival rate of 66.3% for all sites combined in both sexes (57.6% in males and 75.2% in females). When compared with earlier periods, notable improvements in the 5-year relative survival rates were observed for all sites combined. The higher cancer survival rate in females might be partly explained by cancers common in females (e.g., thyroid, breast, and cervix uteri cancers) having relatively good prognoses.
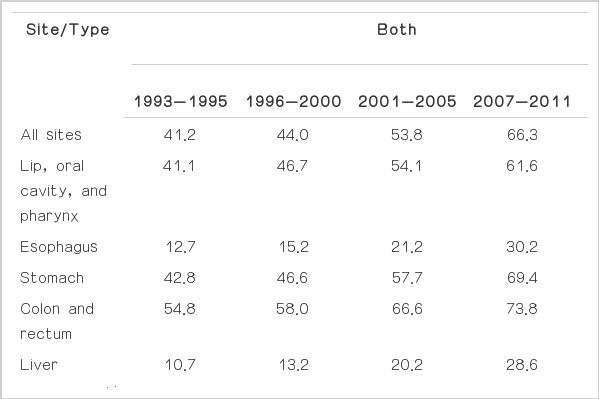
Trends in the 5-year relative survival rates (%) by year of diagnosis from 1993 to 2011 in Korea
When examined by year of diagnosis and cancer site, the 5-year relative survival rates appeared to be higher for most major cancers in patients diagnosed from 2007 to 2011 compared with those diagnosed from 1993 to 1995, with the exception of pancreatic cancer. The greatest improvements were seen in cancers of the prostate, stomach, leukemia, lip/oral cavity/pharynx, and non-Hodgkin lymphoma. The improving survival rates could be attributable to early detection and improved treatments [18,19], but this requires further evaluation. Only pancreatic cancer showed no improvement in 5-year relative survival rate compared with 1993-1995. A lack of progress in early detection and treatment could explain the observed absence of improvement in the survival rate for pancreatic cancer [20].
7. Prevalence rates
The cancer prevalence rates by sex and cancer site on January 1, 2012 in Korea are shown in Table 10. The CRs per 100,000 of cancer prevalence for all sites combined were 1,959.6 and 2,420.1 in males and females, respectively, and the ASRs per 100,000 of cancer prevalence for all sites combined were 1,488.7 and 1,618.5 in males and females, respectively. In males, the five leading primary sites of cancer for prevalence were stomach (CR, 500.5; ASR, 372.7), colon and rectum (CR, 367.7; ASR, 276.4), prostate (CR, 168.1; ASR, 129.0), liver (CR, 142.3; ASR, 105.6), and thyroid (CR, 132.0; ASR, 94.7), which together accounted for 66.9% of all prevalent cancer cases. In females, the most common cancer site was thyroid (CR, 727.4; ASR, 512.0), followed by breast (CR, 468.0; ASR, 316.3), stomach (CR, 253.6; ASR, 154.9), colon and rectum (CR, 250.0; ASR, 150.7), and cervix uteri (CR, 164.1; ASR, 108.4), which together accounted for 77.0% of all prevalent cancer cases.
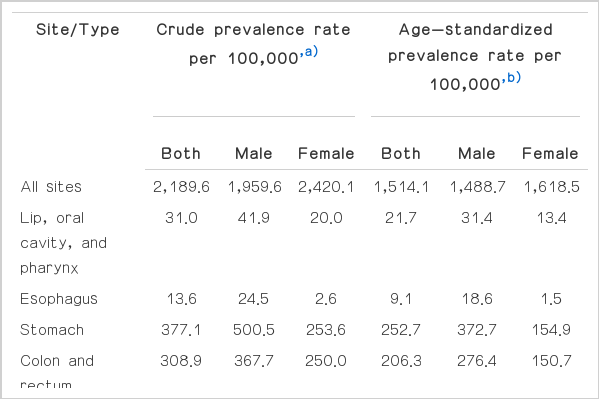
Crude and age-standardized rates of cancer prevalence by sex on January 1, 2012 in Korea
The prevalence by time since diagnosis is shown in Fig. 6. For all cancers combined, the 2-year prevalence constituted 31.4% of all prevalent cases. The 2-year prevalence, as a percentage of the total prevalence, was highest for thyroid (22.2%), followed by stomach (15.0%) and colon and rectum (13.8%), which had high incidence rates and good prognoses. For all cancers combined in both sexes, the 2-5-year and >5-year prevalences accounted for 31.1% and 37.6% of the total prevalence, respectively. The long-term prevalences for lung and liver cancers were relatively low due to low survival rates of lung cancer patients.
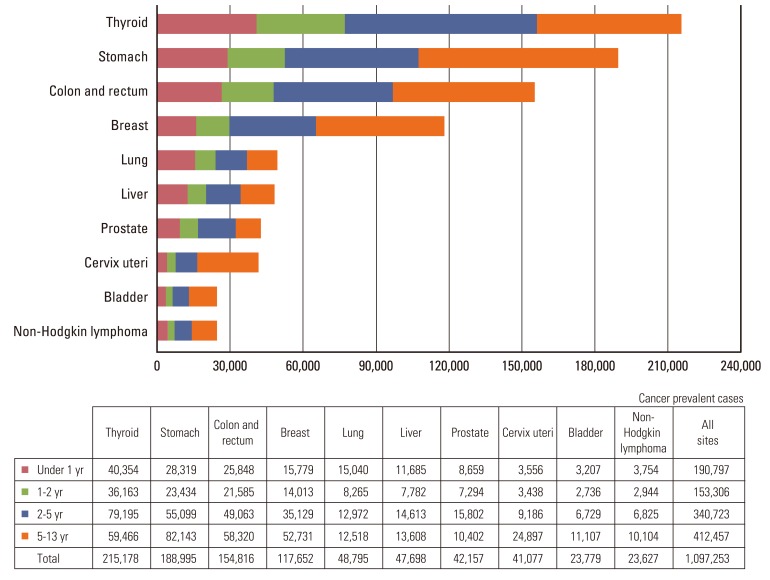
Prevalence of major cancer sites by time since diagnosis on January 1, 2012 in Korea.
Acknowledgments
This work was supported by a research grant from the National Cancer Center (No. 1310220), Republic of Korea. The authors are indebted to Korea Central Cancer Registry (KCCR)-affiliated hospitals, non-KCCR-affiliated hospitals, 11 regional cancer registries (the Busan, Daegu & Gyeongbuk, Gwangju & Jeonnam, Incheon, Daejeon & Chungnam, Ulsan, Gangwon, Chungbuk, Jeonbuk, Gyeongnam and Jejudo cancer registries), the National Health Insurance Service and Statistics Korea for data collection.
Notes
Conflict of interest relevant to this article was not reported.