Assessment of Chemotherapy Response Using FDG-PET in Pediatric Bone Tumors: A Single Institution Experience
Article information
Abstract
Purpose
Response to neo-adjuvant chemotherapy is an important prognostic factor for osteosarcoma (OS) and the Ewing sarcoma family of tumors (ESFT). [F-18]-fluorodeoxy-D-glucose (FDG)-positron emission tomography (PET) is a non-invasive imaging modality that predicts histologic response to chemotherapy of various malignancies; however, limited data exist about the usefulness of FDG-PET in predicting the histologic response of pediatric bone tumors to chemotherapy. We analyzed the FDG-PET imaging characteristics of pediatric bone tumors and determined the association with response to chemotherapy.
Materials and Methods
Pediatric patients with OS (n=19) or ESFT (n=17) were evaluated for FDG-PET standard uptake values before (SUV1) and after (SUV2) chemotherapy. The relationship to the chemotherapy response was assessed by histopathology in surgically-excised tumors. A complete data set (SUV1, SUV2, and histologic response) was available in 23 patients.
Results
While the mean SUV1s were not different between patients with OSs and ESFTs (9.44 vs. 6.07, p=0.24), the SUV2s were greater in the patients with OSs than ESFTs (4.55 vs. 1.66, p=0.01). The ratios of SUV2-to-SUV1 (SUV2 : SUV1) were 0.65 and 0.35 for OS and ESFT, respectively (p=0.08). All of the patients with ESFTs and 47% of the patients with OS had a favorable histologic response to chemotherapy. The SUV2 : 1 [(SUV1-SUV2)/SUV1]≥0.5 and SUV2≤2.5 were related to favorable histologic responses to chemotherapy; the sensitivity and specificity of SUV2 : 1 at 0.5 and SUV2 at 2.5 were 93% and 88%, and 88% and 78%, respectively.
Conclusion
FDG-PET can be used as a non-invasive surrogate to predict response to chemotherapy in children with bone tumors.
Introduction
Osteosarcomas (OSs) and the Ewing sarcoma family of tumors (ESFT) are the most common malignant bone tumors among children and adolescents [1]. With a multidisciplinary treatment approach, the survival of patients with localized OSs and the ESFT has improved [2]. Usually, the treatment scheme for patients with OSs or the ESFT is comprised of pre-operative chemotherapy, local treatment, and post-operative chemotherapy. Originally, pre-operative chemotherapy was introduced to compensate for the time needed for custom-made prostheses and increase the feasibility of limb salvage surgery [3].
The response to pre-operative chemotherapy is closely related to thelong-term survival of patients with bone tumors and can be estimated in variety of ways. Clinically, patients with responding tumors might show a decrease in pain or swelling of the affected limb. A decrease in tumor vascularity and edema on computed tomography (CT) or magnetic resonance imaging (MRI) is considered to be a sign suggesting a favorable response to chemotherapy. However, radiologic imaging has some limitations. The actual size of OSs does not change after chemotherapy and it is difficult to evaluate osseous reactions objectively [1,4]. Therefore, it is difficult to distinguish responding tumors from non-responding tumors by CT or MRI [4,5]. Histologic responses are determined on surgically-resected tumor specimens and usually graded according to the portion of viable tumor cells. The histologic response is considered to be the most reliable prognostic indicator for survival of patients with OSs and the ESFT [1,5]. However, the histologic response can only be obtained after surgery, and might not always be available due to inoperable tumors. Thus, a surrogate is needed that can evaluate the response to chemotherapy.
[F-18]-fluorodeoxy-D-glucose (FDG)-positron emission tomography (PET) is a new imaging tool in the field of oncology. FDG is an analogue of glucose; FDG is taken up by cells to the same extent as glucose, but FDG is not metabolized [6]. FDG-PET represents glucose metabolism of the tissue. Some organs, such as the brain, myocardium, and kidneys show a high physiologic accumulation in the normal state. FDG uptake can be enhanced by inflammation or cancer. FDG is trapped into the cancer cells due to the high glycolytic activity, and malignant tumors, especially in active state, often show increased glycolytic activity [7]. Therefore, FDG-PET is regarded as an effective modality for evaluating the response to chemotherapy. It has been reported that changes in FDG-PET imaging following neo-adjuvant chemotherapy are predictive of the histologic response in patients with breast cancers [8,9], head and neck cancers [10], lymphomas [11,12], and gastrointestinal stromal tumors [13] of adults. Recent studies have shown that integrated PET-CT is more accurate for lesion localization and characterization than PET and CT alone or the results obtained from PET and CT separately [14]. In contrast to adult cancers, few studies have been performed in children with cancer regarding the FDG-PET image characteristics and the association with the response to chemotherapy. Moreover, controversy exists about the appropriate use of FDG-PET in children due to the concern of excessive radiation exposure.
In this retrospective study we evaluated the FDG-PET image findings in children with OSs and the ESFT. We focused on the FDG-PET image changes after chemotherapy and the relationship to the histologic response.
Materials and Methods
1. Patients and treatments
Thirty-six pediatric patients were enrolled in this retrospective study; the clinical characteristics of the patients are summarized in Table 1. One patient was excluded because of age (>18 years). Due to inoperable tumors or loss of records, data regarding histologic responses were not available in 8 patients. Standardized uptake value before chemotherapy (SUV1) were not available for four patients who were referred to our institution. Twenty-three patients (13 with OSs and 10 with the ESFT) had complete data sets (SUV1, standardized uptake value after chemotherapy [SUV2], and histologic responses), therefore they comprised the final study population.
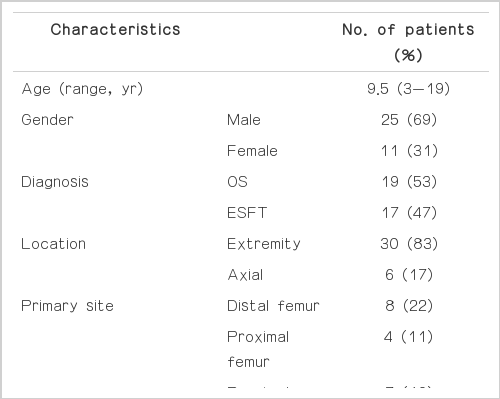
Clinicopathologic characteristics of patients
OSs or the ESFT were diagnosed based on histologic examination of representative specimens obtained by open or needle biopsy and by resection. The extent of the tumors was evaluated by plain radiography and MRI. To determine the presence of metastases, 99mTc-methylene diphosphonate whole-body bone scintigraphy and CT of the chest were performed. Generally, patients were treated with pre-operative chemotherapy, surgery, and post-operative chemotherapy. Histologic response to pre-operative chemotherapy was evaluated using a resected tumor specimen, and were classified as follows:<10% viable tumor cells indicated a good response; and ≥10% residual viable tumor indicated a poor response. Informed consent was required from all patients and/or their legal guardians.
2. PET imaging
FDG-PET imaging was performed twice in every patient (at the time of diagnosis and before surgery). After fasting for at least 4-6 hours, patients received FDG intravenously; the dose of FDG was based on body weight (5 mCi for children weighing<30 kg, and 10 mCi for children weighing 30 kg). Whole body scans were obtained after 45-60 minutes of equilibration time. SUVs were calculated throughout the tumor. We chose the maximum SUV for our study rather than the average SUV. SUV1 and SUV2 represented the maximum tumor SUVs at the time of diagnosis and before surgery, respectively. SUV2 : 1 represented the decreased SUV ratio, i.e., (SUV1-SUV2)/SUV1.
3. Statistical analysis
A two sample t-test was used to compare the mean values of SUV1, SUV2, and SUV2 : 1 between the two groups (OS vs. ESFT and good responder vs. poor responder). Fisher's exact test was used to compare categorized variables (according to SUV values) in the good and poor responder groups. All calculations were performed using SPSS ver. 17.0 (SPSS Inc., Chicago, IL), and p-value<0.05 were considered significant.
Results
1. FDG-PET findings before and after chemotherapy
Data regarding SUV1 from four patients were not available because the patients were transferred from other hospitals. Therefore, a complete data set (SUV1, SUV2, and histologic response) were available in 23 patients. The FDG-PET imaging and histologic response data for OS and ESFT patients are presented in Table 2. The mean SUV1 from patients with OSs and the ESFT did not have a meaningful difference (9.44 vs. 6.07, respectively, p=0.24). However, the mean SUV2 of OSs was significantly higher than the ESFT (4.55 vs. 1.66, respectively, p=0.01). The mean SUV2 : 1 of the ESFT was significantly higher than the OSs (0.69 vs. 0.35, respectively, p=0.05). Fig. 1 shows the representative FDG-PET and MRI prior to and after neo-adjuvant chemotherapy for two patients. A 10-year-old boy with an OS of the right proximal tibia showed markedly decreased SUV2 after chemotherapy (SUV1, 27.4; SUV2, 1.9) and the tumor showed a favorable histologic response (95% necrosis). The SUV1 and SUV2 values of a 10-year-old girl with the ESFT of the left proximal femur were 5.9 and 1.6, respectively.

FDG-PET findings and histologic response
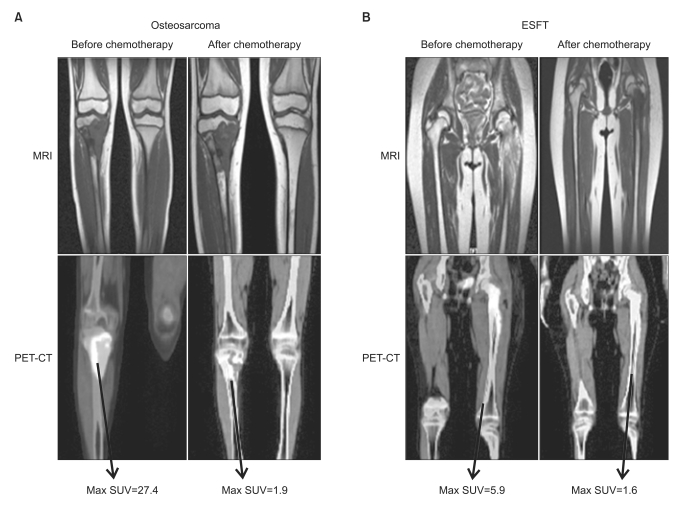
Magnetic resonance imaging (MRI) and [F-18]-fluorodeoxy-D-glucose-positron emission tomography (FDG-PET) findings before and after chemotherapy in children with bone tumors. (A) A 10-year-old boy with an osteosarcoma of the right proximal tibia. Standard uptake value (SUV) markedly decreased after chemotherapy (27.4 to 1.9) and the tumor showed a favorable histologic response (95% necrosis). (B) A 10-year-old girl with Ewing sarcoma family of tumors (ESFT) of the left proximal femur showed a complete histologic response (100% necrosis) to chemotherapy. SUV1 and SUV2 values were 5.9 and 1.6, respectively. CT, computed tomography.
2. FDG-PET findings and histologic response to chemotherapy
SUV2 and SUV2 : 1 was closely related to the histologic response. The mean SUV2 of poor responders was significantly higher than good responders (2.04 vs. 6.36, respectively, p=0.04). The mean SUV2 : 1 of good responders was significantly higher than the mean SUV2 : 1 of poor responders (0.69 vs. 0.13, respectively, p<0.01). There were more good responders in patients with a SUV2≤2.5 (p<0.01) (Fig. 2). The sensitivity and specificity at SUV2≤2.5 were 88% and 78%, respectively. The positive and negative predictive values to be good responders at SUV2≤2.5 were 88% and 70%, respectively. The SUV2 : 1≥0.5 appeared to be related to a favorable histologic response (p<0.01) (Fig. 2). The sensitivity and specificity at a SUV2 : 1≥0.5 were 93% and 88%, respectively. The positive and negative predictive values to be good responders at SUV2 : 1≥0.5 were 93% and 78%, respectively.

Histologic response and SUV2, SUV2 : 1, SUV2≤2.5, and SUV2:1≥0.5 were related to a favorable histologic response to chemotherapy. SUV, standard uptake value; SUV2 : 1, decreased SUV ratio, i.e., (SUV1-SUV2)/SUV1.
While 47% of the patients with OSs were good responders, all of the patients with the ESFT were good responders (p<0.01), therefore further statistical analysis was not performed for the patients with the ESFT.
For patients with OSs, the mean SUV2 of good responders tended to be lower than poor responders (2.53 vs. 6.36, respectively, p=0.06). The mean SUV2 : 1 of good responders was significantly higher than poor responders (0.69 vs. 0.13, respectively, p=0.03). There were more good responders in patients with a SUV2≤2.5 (p=0.04). The sensitivity and specificity at SUV2≤2.5 were 75% and 78%, respectively. The positive and negative predictive values for good responders at SUV2≤2.5 were 75% and 78%, respectively. The SUV2 : 1≥0.5 appeared to be related to a favorable histologic response (p<0.01). The sensitivity and specificity at SUV2 : 1≥0.5 were 83% and 88%, respectively. The positive and negative predictive values to be good responders at SUV2 : 1≥0.5 were 83% and 100%, respectively. The correlation between the SUV cut-off value and response to neo-adjuvant chemotherapy is summarized in Fig. 2, and shows the correlation between SUV2, SUV2 : 1, and histologic responses.
Discussion
In this study, we have shown that imaging characteristics obtained by FDG-PET are correlated with tumor activity. SUV2 and SUV2 : 1 have a significant correlation with histologic responses to neo-adjuvant chemotherapy and are a powerful candidate that can predict the response to neo-adjuvant chemotherapy before surgery in a non-invasive manner.
FDG-PET findings, especially the maximum SUVs, are the most reliable units by which to evaluate tumor activity. It has been reported that an initial high FDG uptake is predictive of poor overall and event-free survival of patients with OSs [15]. We did not find any differences in the SUV1, i.e., the initial FDG uptake values between good and poor responders; however, there were changes in the FDG-PET characteristics, i.e., SUV2 was related to the response to chemotherapy. After administration of chemotherapy, changes in FDG metabolism can occur as rapidly as 8 hours [16]. We showed that low SUV2 values were related to favorable responses and a SUV2<2.5 was suggested to be a meaningful cut-off value [1,4,17]. A SUV2 : 1 of 0.5 was shown to have statistical significance, which is in agreement with other studies [1,4,17].
Differences exist between OSs and the ESFT in the response to chemotherapy and the corresponding FDG-PET changes. In patients with OSs, a SUV2 of 2.5 and a SUV2 : 1 of 0.5 had the most reliable statistical significance, as in other studies [1,4,17]. SUV2 : 1 had a more evident correlation with the histologic response than SUV2. SUV2 may remain elevated because of inflammation or reactive changes without viable residual tumor [18]. Moreover, tumors with an initial high SUV1 might still have a high SUV2, despite a significant decrease in the SUV value. Therefore, the SUV2 : 1, which reflects a decreased ratio of the SUV value, might be a more reliable indicator for evaluating the response to chemotherapy than SUV2. An alternative possibility is that the evaluation of tumor response averages the percentage of tumor necrosis across the entire resected tumor specimen, whereas we reported the maximal SUV within the tumor as the SUV2 [1]. For patients with the ESFT, the mean SUV2 and SUV2 : 1 was 1.66 and 0.69, respectively. Because all of the patients had a favorable response to chemotherapy, we could not analyze the association between SUV changes and histologic response of the ESFT. For patients with the ESFT, we presume that role of FDG-PET in predicting chemotherapy response might be more prominent in refractory or relapsed cases.
Our study had several limitations. First, selection bias might have existed in our study because we excluded 8 cases that were initially enrolled. Second, a small sample size limited the statistical confidence for positive and negative predictive values. We found that FDG-PET findings were related to the histologic response to chemotherapy, which is considered to be the most important prognostic factor. However, the impact on survival is still elusive. The histologic response might not represent the response of the entire tumor, rather a representative section. Lewis et al. [19] has demonstrated that a good histologic response to pre-operative chemotherapy did not translate into a demonstrable patient benefit in overall or progression-free survival. Further investigation with a larger sample size and longer follow-up duration is necessary.
Conclusion
FDG-PET findings (SUV2 and SUV2 : 1) were shown to be related to the histologic responses to chemotherapy of pediatric patients with bone tumors. We believe that FDG-PET is a powerful tool that can predict the response to chemotherapy before surgery. Because our findings are retrospective in nature and based on data from a small sample, further studies are necessary to elucidate the relationship between FDG-PET findings and treatment outcomes of children with malignant bone tumors.
Notes
Conflict of interest relevant to this article was not reported.