Introduction
The Src family kinases (SFKs) are a unique group of enzymes that have diverse functions in cell proliferation, survival, differentiation, adhesion, and migration. They not only play important regulatory roles in hematopoiesis, but also contribute to development of hematopoietic cancers. One historically prominent paradigm of SFK action is cell proliferation and contribution to cell transformation [1]. SFKs are known to have functional importance in chronic myelogenous leukemia (CML) because of the interaction between SFKs and the oncogenic fusion protein BCR-ABL. SFK members Hck and Lyn readily interact with BCR-ABL via kinase-dependent and -independent mechanisms, and this interaction cannot be inhibited by the BCR-ABL inhibitor, imatinib [2-4]. In addition, this interaction between SFKs and BCR-ABL appears to be crucial for the transforming activity of BCR-ABL, which is particularly essential for BCR-ABL-driven B cell leukemia [5]. Lyn is the predominant active SFK expressed in acute myeloid leukemia (AML) cells [6,7]. Blocking SFK activity has been effective in slowing leukemic cell growth [8]. According to recent studies using gene knock-out mice, SFKs, most notably Lyn, Fgr, and Hck, play a role in regulation of myelopoiesis in vivo. Mice lacking Lyn manifest an increase in myeloid progenitors, enhancement of granulocyte colony-stimulating factor-stimulated granulopoiesis, and development of a myeloproliferative disorder leading to development of monocyte/macrophage tumors [9,10]. Similar findings were reported in triple knock-out mice lacking Lyn, Fgr, and Hck [9]. Together, these studies implicate myeloid SFKs as negative regulators of myelopoiesis. SFK activity and expression could also modulate all-trans-retinoic acid (ATRA) differentiation induction therapy. In a recent study reported by Miranda et al. [11], the SFK inhibitor PP2 was found to potentiate ATRA-induced gene expression and enhanced the differentiation marker CD11b in myeloid NB4, HL-60, and primary acute promyelocytic leukemia (APL) cells and the synergic effects of PP2 were dose dependent. Arsenic trioxide (As2O3, ATO) has considerable efficacy in treatment of previously untreated and relapsed APL. Although initial studies focused on the APL fusion protein, promyelocytic leukemia (PML)-retinoic acid receptor α (RARα), in mediating response to ATO, subsequent investigations have revealed that ATO acts on numerous intracellular targets.
In this study, we investigated the question of whether SFK inhibitor PP2 has an equal synergistic effect on differentiation of NB4 cells when combined with ATRA or ATO. In addition, we examined the changes in retinoic acid (RA)-induced gene expression in order to determine the possible mechanism for the different effect of PP2 on ATRA- or ATO-induced differentiation of NB4 cells.
Materials and Methods
1. Cells and reagents
NB4 cells were grown in RPMI1640 medium (Gibco, Rockville, NY) supplemented with 10% heat-inactivated fetal bovine serum (Gibco) and 1% penicillin/streptomycin (Gibco) in a humidified 5% carbon dioxide and 95% air incubator at 37℃. ATRA was obtained from Sigma, and 5 mM stock solution was prepared in ethanol and stored at -20℃. ATO (As2O3), nitroblue tetrazolium (NBT), and phorbol 12-myristate 13-acetate (PMA) were obtained from Sigma (St. Louis, MO). The Src family kinase inhibitor PP2 was obtained from Sigma and 20 mM stock solution was prepared in dimethyl sulfoxide and stored at -20℃. Antibodies against cathepsin D and intercellular adhesion molecule-1 (ICAM-1) were purchased from Santa Cruz Biotechnology (Santa Cruz, CA). Antibody against β-actin was purchased from Sigma. Secondary anti-rabbit and anti-mouse horseradish peroxidase conjugated antibodies were purchased from DAKO (Glostrup, Denmark).
2. Assay for differentiation
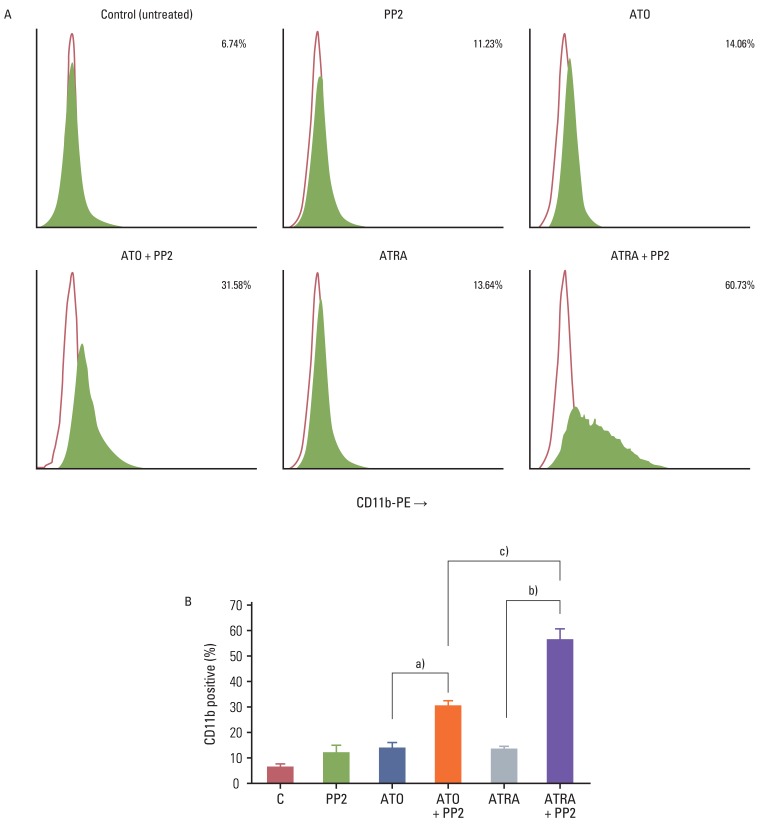
In order to induce differentiation, NB4 cells were treated with ATRA or ATO in the absence or presence of PP2 for 72 hours. For analysis of cell surface antigens, cells were harvested and washed twice with washing buffer (phosphate buffered saline [PBS] containing 0.2% bovine serum albumin and 0.1% NaN3); they were then incubated with anti-CD11b-PE antibody (BD Biosciences, San Jose, CA) for 30 minutes at 4℃ in the dark. The labeled cells were washed twice with washing buffer. The cells were analyzed for CD11b expression using flow cytometry (FC500, Beckman Coulter, Fullerton, CA).
Granulocytic differentiation was assessed by NBT reduction assay. Briefly, each cell suspension was mixed with an equal volume of a solution containing 1 mg/mL of NBT and 2.5 µg/mL of PMA and incubated at 37℃ for 30 minutes. Cytospin preparations of a 100 µL cell suspension were allowed to air-dry. The differentiated cells were identified by their intracellular blue formazan deposits. Using a light microscope, a minimum of 200 cells was counted, in order to determine the percentage of differentiated cells.
3. Annexin-V-fluorescein staining assay
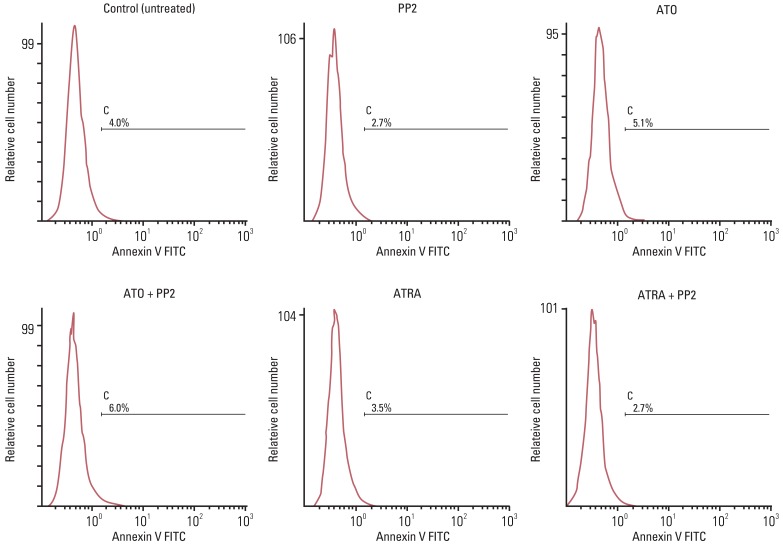
The Annexin-V FITC kit (Biosource, Camarillo, CA) was used for detection of apoptotic cells. Briefly, NB4 cells were treated with ATRA or ATO in the absence or presence of PP2 for 72 hours. Cells were washed twice with PBS and stained in binding buffer containing Annexin-V FITC and propidium iodide (PI) at room temperature for 15 minutes in the dark. The reaction was stopped by addition of 400 µL of binding buffer and analyzed by flow cytometry (FC500) with a total of 10,000 events acquired for each sample.
4. Western blotting
Cells were treated with ATRA or ATO, in the absence or presence of PP2 for 72 hours, and were harvested and washed with PBS. Total cellular proteins were isolated by sonication using ice-cold PBS containing 1% Nonidet P-40, 0.5% sodium deoxycholate, 0.1% sodium dodecyl sulfate (SDS), 2.0 µg/mL aprotinin, and protease inhibitor cocktail (Roche, Mannheim, Germany), and centrifuged at 12,000 ×g for removal of cellular debris. The protein concentrations in extracts were determined using the bicinchoninic acid colorimetric method (Pierce, Rockford, IL).
Equal amounts of proteins were separated by 10% SDS-polyacrylamide gel electrophoresis and electrophoretically transferred to polyvinylidene difluoride membranes (Bio-Rad, Hercules, CA). The membranes were then blocked with 5% nonfat dried milk (Bio-Rad) in TTBS (50 mM Tris-HCl [pH 7.5], 150 mM NaCl, and 0.1% [v/v] Tween 20) for 1 hour at room temperature and then incubated with primary antibodies diluted to 1:1,000-1:3,000 in 5% nonfat dried milk/TTBS overnight at 4℃ with gentle shaking. The membranes were then washed with TTBS (3×15 minutes) and subsequently incubated with secondary anti-rabbit or anti-mouse horseradish peroxidase conjugated antibodies diluted to 1:5,000 in 5% nonfat dried milk/TTBS for 2 hours at room temperature. The membranes were then washed as described above and developed using the enhanced chemiluminescence detection system (Amersham, Buckinghamshire, UK).
Results
1. PP2 enhances ATRA- or ATO-induced differentiation of NB4 cells
To determine the effect of PP2 on ATRA- or ATO-induced differentiation of NB4 cells, we examined CD11b expression by flow cytometry. Treatment of NB4 cells with 10 µM of PP2 alone, 0.001 µM of ATRA alone, or 0.5 µM of ATO alone for 72 hours resulted in only 11.23%, 13.64%, or 14.06% of CD11b-positive cells, respectively (Fig. 1). However, co-treatment with ATRA plus PP2 or ATO plus PP2 resulted in significant enhancement of CD11b-positive cells (60.73% and 31.58%, respectively; p<0.05) (Fig. 1). The synergistic effect of PP2 combined with ATRA was more significant than that of PP2 combined with ATO (p<0.05). Similar results were obtained in five independent experiments, and were confirmed with NBT staining of NB4 cells (Fig. 2). This means that treatment with PP2 resulted in significantly enhanced ATRA- or ATO-induced differentiation of NB4 cells in vitro and that the synergistic effect of PP2 was higher in combination with ATRA than in combination with ATO in NB4 cells in vitro.
2. PP2 has no effect on ATRA- or ATO-induced apoptosis of NB4 cells
To determine the effect of PP2 on ATRA- or ATO-induced apoptosis of NB4 cells, we evaluated apoptotic cell death after Annexin V-FITC and PI staining using flow cytometric analysis. Fig. 3 shows that treatment of NB4 cells with ATRA or ATO alone or in combination with PP2 for 72 hours did not induce apoptosis in NB4 cells. Similar results were obtained in three independent experiments. This means that the ability of PP2 to enhance ATRA- or ATO-induced differentiation of NB4 cells was not due to its effect on apoptosis in NB4 cells in vitro.
3. PP2 has different effects on ATRA- or ATO-induced NB4 cell differentiation
To determine the possible mechanism for the effect of PP2 on ATRA- or ATO-induced differentiation of NB4 cells, we examined the changes in expression of proteins (ICAM-1 and cathepsin D) derived from RAR target genes. As shown in Fig. 4, control NB4 cells that were not treated with any reagents expressed low levels of these proteins. Treatment with PP2 alone resulted in a modest induction of ICAM-1 and cathepsin D expression. Treatment with ATRA alone resulted in increased expression of ICAM-1, as well as a modest induction of cathepsin D expression. Treatment with ATO alone resulted in increased expression of cathepsin D, whereas it had no effect on expression of ICAM-1. This induction of expression by ATRA or ATO was further enhanced when cells were treated with PP2 in combination with ATRA or with PP2 in combination with ATO. In particular, ICAM-1 expression showed a significant increase in cells treated with PP2 in combination with ATRA, whereas cathepsin D expression was significantly increased in cells treated with PP2 in combination with ATO. These findings suggest that PP2 has different effects on ATRA and ATO-induced differentiation of NB4 cells. PP2 promotes ATRA-induced differentiation of NB4 cells through ICAM-1 and ATO-induced differentiation of NB4 cells through cathepsin D.
Discussion
APL, a subtype of AML, with distinctive biologic and clinical features, is now highly curable. Translocation of the PML gene on chromosome 15 adjacent to the RARα gene on chromosome 17 produces a fusion protein that can be quantitatively monitored using polymerase chain reaction in order to document disease burden and to ultimately confirm molecular remission. The unique ability of ATRA to produce differentiation in APL blasts can reverse coagulopathy, which is the major cause of death during induction [12,13]. Emerging evidence has implicated SFKs as regulators of proliferation and survival of myeloid lineage cells and regulators of cytokine-induced myelopoiesis [14]. Overexpression and/or hyperactivation of SFKs is common in AML cell lines. AML is a diverse malignancy characterized by defective myeloid differentiation and accumulation of proliferative blasts [7,15].
Recent studies have demonstrated that SFKs act to negatively regulate RA-induced gene expression and myeloid differentiation and suggest that the combination of SFK inhibition and RA treatment may be therapeutically beneficial in AML [7,11,16]. In this study, we investigated the question of whether SFK inhibitor PP2 enhanced the differentiation of NB4 cells when combined with ATO or ATRA. ATO, an effective drug for treatment of APL, was shown to exert dose-dependent dual effects on APL cells, i.e., triggering apoptosis and inducing partial differentiation [17]. It has also been suggested that these effects were related to ATO-induced modulation/degradation of PML-RARα protein [18,19]. We found that treatment with SFK inhibitor PP2 resulted in significantly enhanced ATRA- or ATO-induced differentiation of NB4 cells and that the synergistic effect was significantly stronger when PP2 was combined with ATRA than when PP2 was combined with ATO. To the best of our knowledge, this is the first evidence that SFK inhibitors can enhance ATO-induced myeloid differentiation of APL cells, even though the synergistic effect between ATRA and PP2 was significantly stronger than that between ATO and PP2. Of particular importance, these synergistic differentiation-enhancing effects were not related to apoptosis when PP2 was combined with ATO as well as when PP2 was combined with ATRA. These results suggested that, even in ATO-induced apoptosis and differentiation of APL cells, the synergistic effect between ATO and PP2 was also related to the presence of RAR. A recent study by Miranda et al. [11], reported that SFKs regulated RAR-mediated gene transcription and that SFK inhibition potentiated RA-induced gene expression. In our study, RA-induced gene expression was different in both groups. Expression of ICAM-1 showed a significant increase in cells treated with PP2 in combination with ATRA, whereas cathepsin D expression was significantly increased in cells treated with PP2 in combination with ATO. These results suggest that the mechanism of SFK inhibitor-induced synergistic effect of APL cell differentiation on ATRA or ATO is associated with RA-induced gene expression and that the difference in APL differentiation between ATRA and ATO is related to disparate activation of RA-induced genes.
Dasatinib, a US Food and Drug Administration (FDA)- approved compound, was developed as an inhibitor of ABL and SFKs [20]. Recent studies have demonstrated the effects of dasatinib in hematopoietic malignancies other than CML and have suggested additional therapeutic opportunities. Because some investigators have demonstrated that dasatinib promotes ATRA-induced differentiation of AML cells, FDA-approved dasatinib in combination with ATRA may be beneficial in treatment of APL and non-APL AML [7,16]. In 2004, Shen et al.[21] first published the outcomes of single agent ATRA, single agent ATO, or the combination of both drugs. While complete remission rates exceeded 90% in all three arms, the decline in the level of PML-RARα fusion protein was significantly higher with the use of the combination. Hematologic recovery was more rapid and relapse-free survival was improved at 18 months [21]. For subsequent similar data [22], National Comprehensive Cancer Network (NCCN) guidelines indicate that ATRA plus ATO is an alternative for patients who cannot tolerate anthracycline therapy. A recent trend in cancer treatment is moving toward the use of targeted therapy and we eagerly look forward to obtaining therapeutic benefit due to low toxicity of targeted therapy.
Conclusion
Our data showed that SFK inhibitor enhanced APL cell differentiation when combined with either ATRA or ATO with difference in activation of RA-induced genes. This suggests that a new combination of SFK inhibitor, PP2 plus ATRA and ATO may be therapeutically beneficial in APL. This will need to be confirmed in further studies.