INTRODUCTION
Ovarian cancer is a leading cause of death from cancer in women. Without clearly definable symptoms, ovarian cancer often remains undetected until at an advanced stage, when the prognosis is poor. The main causes are considered to be sporadic in nature, and arise as a result of acquired alterations in oncogenes and tumor suppressor genes, such as TP53 and PTEN (1,2). The alterations that lead to ovarian cancer vary between patients, and the striking clinical heterogeneity of ovarian cancer is likely to reflect an underlying molecular heterogeneity. To understand the possible causes of the heterogeneity of cancer cells, it is recommended the obvious thing to do is avoid drugs that may increase the heterogeneity by triggering further mutations or anueploidy (3).
Green tea has potential preventive effects against cancer (4). The anti-proliferative effects of green tea preparations have been demonstrated in many cancer cell lines and different animal models (5,6). The anti-carcinogenic and anti-proliferative effects of tea have been attributed to the biological properties of green tea polyphenolic compounds, especially, (-)-epigallocatechin-3-gallate (EGCG) (7,8). EGCG has demonstrated anti-carcinogenic activities in human and animal models, including cancer of the breast, prostate, stomach, esophagus, colon, pancreas, skin and lung (9~11). In vitro studies have also shown that EGCG can inhibit growth of human mammary and lung cancer cells, prostate cancer cells, lymphoma cells, leukemic cells, and lung and colon cancer cell lines (12,13). EGCG can ameliorate free radical damage to DNA under certain conditions (14,15). However, even though, several molecules have been proposed as the target for EGCG, such as urokinase, matrix metalloproteinases, vascular endothelial growth factor (VEGF), tyrosine kinase receptors and cell cycle regulators (16~19), the precise mechanisms by which EGCG exerts its anti-carcinogenic activity are still not fully understood. Furthermore, no studies on ovarian cancer cells have been reported.
In this study, whether a major green tea constituent, EGCG, possesses growth inhibitory properties in various human ovarian cancer cell lines was investigated. EGCG has also been observed to possess a potent dose dependent growth inhibitory ability in ovarian cancer cell lines. This growth inhibition appears to be mediated by apoptosis, cell cycle arrests in the G1 phase and regulation of gene expression, as determined by FACS and macroarray containing genes involved in cell death. This report allows the simultaneous, quantitative measurement of the expression of many gene induced by EGCG, resulting in an important understanding of how a cell decides to undergo apoptosis or growth arrest.
MATERIALS AND METHODS
1) Cells
SKOV-3 (p53 negative), OVCAR-3 (mutant type p53) and PA-1 (wild type p53) cells were obtained from the Korean Cell Line Bank, Seoul National University, Seoul, Korea. All cells were cultured in DMEM (Gibco, Rockville, MD), supplemented with 5% heat-inactivated FBS (Fetal Bovine Serum) (Gibco), 0.37% sodium bicarbonate (Sigma, St. Louis, MO), and streptomycin/penicillin (Gibco), at 37℃ in a 5% CO2 incubator.
2) Cell growth inhibition assay
For the cell proliferation inhibition assay, EGCG (a kind gift from Dr. Yukihiko Hara of Mutsui Norin Co., Fujied, Japan) was diluted 50% in DMSO and stored at -20℃ before use. For viable cell counting, 5×10³ cells per well were treated with EGCG ranging from 6.25 to 100 µM for various times. Cells were counted using a hemacytometer under a microscope after trypsinization. The cell viability was determined by the trypan blue exclusion assay. From the analysis of three replicates, the typical measurement deviations were observed to be less than±3.0 percent for each assay.
3) DNA fragmentation assay
Each cell line was divided into 5×10⁵ cells/100 mm dish plate. After 24 hr incubation, the cells were added with different amounts of EGCG. After 24 or 48 hr, the cells were centrifuged lysis buffer [0.5% SDS, 0.1 M NaCl, 0.01 M EDTA, 10 mM Tris-HCl (pH8.0)], was added to the subsequent cell pellets followed by the addition of 20 µg/ml proteinase K and 10mg/ml RNase A (Sigma). This mixture was incubated for 4 hrs at 56℃. DNA was extracted by phenol/chloroform treatment. Five µg of the extracted DNA was analyzed on a 2% agarose gel, containing EtBr (ethidium bromide) (0.1 µg/ml), and the DNA ladder formation visualized under UV light.
4) Cell cycle analysis
Cell suspensions were treated with several concentrations of EGCG for 1 and 2 days. The cells were then trypsinized, washed twice with phosphate-buffered saline (PBS) and stained with propidium iodide (100 µg/ml in PBS). Samples were then analyzed using FACS (Becton Dickinson, San Jose, CA). For DNA contents, the cell debris and fixation artifacts were gated out and the G0/G1, S and G2/M populations quantified using the CellQuest program.
5) FACS analysis
Cell suspensions were centrifuged and resuspended in phosphate-buffered saline (PBS) to a concentration of 5×10⁵ cells/100 mm dish. After treatments with several concentrations of ECGC, the cells were incubated with 5 µl Annexin V-FITC and 10 µl propidium iodide (PI) in the dark at room temperature for 10min, followed by fixation with 2% formaldehyde. The stained cells were analyzed for DNA content by fluorescence-activated cell sorting (FACS) using a FACScan (Becton Dickinson, San Jose, CA). The forward and side scatter gates were set to exclude any dead cells from the analysis; at least 10000 events were collected for each sample.
6) Membrane chip analysis
The total cellular RNA of SKOV-3 was isolated by the acid-guanidinium-thiocyanate-phenol chloroform method, using the Tri-Reagent (Molecular Research, Inc., Cincinnati, OH). The apoptosis pathway GEArray Q Series Human Cell Cycle Gene Array (http://www.superarray.com) was obtained from SuperArray Inc. (Bethesda, MD). This kit determines the differential expression levels of multiple genes involved in a biological pathway. Briefly, the total RNA from the respective samples was used as a template to generate cDNA probes, using the GEAprimer mix as a reverse transcriptase primer. The cDNA probes, which represent an abundance of the mRNA population, were then denatured, and hybridization conducted in GEHybridization solution to two nylon membranes spotted with gene-specific cDNA fragments. The membranes were then washed in 2×SSC and 1% SDS twice for 15 min each, followed by 0.1×SSC and 0.5% SDS twice for 15 min each. The membranes were then exposed to ChemiDoc (BioRad Laboratories, Hercules, CA). The relative expression level of each gene was then determined through the GEArray Analyzer program (Superarray) from duplicate measurements on two separated arrays.
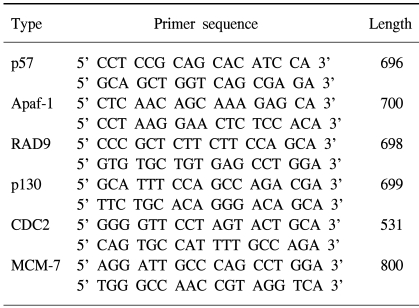
7) RT-PCR
Total RNA was isolated from cells using Tri-reagent (Gibco) and used as templates. Reverse transcription was carried out using RNase (Invitrogen, Carlsbad, California), and performed at 22℃ for 10 min and then at 42℃ for 20 min, using 1.0 µg of RNA per reaction. The primers used in the PCR reactions for the genes analyzed are summarized in Table 1. PCR was performed on the EGCG-treated cell lines under 35 cycles at 94℃ for 1 min, 57℃ for 1 min and 72℃ for 1 min. The amplified products were subjected to electrophoresis on a 2% agarose gel. The gel was then stained with EtBr and photographed. The specific primers (forward: 5'-TGACGGGGTCAC CCACACTGTGCCCATCTA-3' and reverse: 5'-CTAGA AGCATTT-GCGGTGGACGGATGGAGGG-3') were used as control gene β-actin. The amplification reaction involved denaturation at 94℃ for 30 sec and annealing at 72℃ for 30 sec and 72℃ for 45 sec for 20 cycles.
8) Western blot
The cells were grown in 6-well culture dishes (5×10⁵) and treated with several concentrations of EGCG. After 24 or 48 hr, the cells were lysed. The protein concentration of the clear supernatant collected by means of centrifugation was evaluated using the BioRad Protein- Assay kit (Bio-Rad, Hercules, CA), which was adjusted to give a final concentration of 2 mg/mL. After the addition of 2-mercaptoethanol (2%), the samples were boiled for 5 minutes and used in the experiments. 40 µg of each protein sample was subjected to electrophoresis for 2h with SDS-PAGE at 10-mA, and the blotting was performed with a Hybond-ECL membrane (Amersham, Uppsala, Sweden) at 100 volts. The blotted membrane was blocked with 5% skimmed milk and reacted with a primary polyclonal antibody (rabbit CDK2, E2F-1, E2F-4, CDK4; Santa Cruz Biotechnology Inc., Santa Cruz, Ca) and a primary monoclonal antibody (mouse P21, Bax, Rb, Cyclin D1, BclXl, PCNA, Actin; Pharmingen, Franklin Lakes, NJ) at 1mg/ml for 4h at room temperature. After washing with Tris-buffered saline, containing 0.1% Tween 20, the membrane was then incubated with horseradish peroxidase-conjugated secondary antibody (Jackson Immunoresearch, Bar Harbor, MA) at a dilution of 1:1000. The protein bands were visualized using an ECL Kit (Amersham, Arlington Heights, IL).
9) Statistical analysis
Statistical analysis was performed using ANOVA. The values between the different groups were compared and P values of less than 0.05 considered significant. All the data shown in the study for cell cycle analysis and cell growth inhibition are representative of three independent studies.
RESULTS
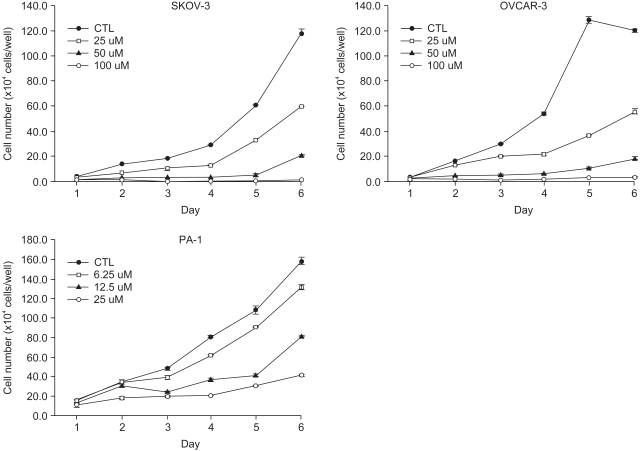
1) EGCG inhibits ovarian cancer cell growth in a dose-dependent manner
To determine the anti-tumor effects of EGCG in the three different ovarian cancer cell lines, SKOV-3, OVCAR-3 cells and PA-1, the cells were treated with EGCG at concentrations ranging from 10 to 100 µM. As shown in Fig. 1, the EGCG showed significant growth inhibitory effects in the ovarian cancer cell lines over the specified treatment times, which were also dose dependent.
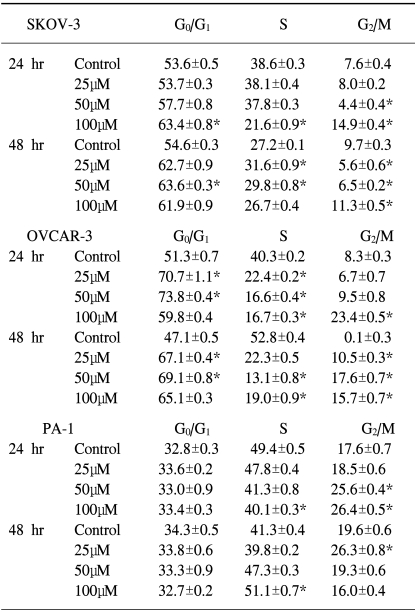
2) EGCG induced cell cycle arrests in ovarian cancer cells
The cell cycle arrests in the ovarian cancer cells were also tested. To determine if the EGCG treatment had any effects on cell cycle perturbations, a cell cycle analysis was performed by propidium iodide staining and flow cytometric analysis. As shown in Table 2, the percentage distribution of cells in the different cell cycle phases after treatment with EGCG, showed significant alterations in the cell cycle progression in each cell line, which suggests EGCG induces cell growth arrest in ovarian cancer cells. In the control cells, the percentage distributions of the PA-1 in the different cell cycle phases were different compared to the other cell lines after 24 to 48 hrs of culturing. At each EGCG concentration, the percentage of SKOV-3 cells in the G1 phase was significantly increased for up to 48 hrs, which suggests the cell cycle was arrested during the G1 phase. The G1 phase arrest profiles of EGCG were consistent over time in the OVCAR-3 cells, where the G1 phase are significantly increased for up to 48 hrs, with the exception of a marked increase in the cell population in the G2/M phase that was observed for up to 48 hrs. The EGCG treatment resulted in a dramatic increase in the G1 cell population, even for up to 24 hrs. In contrast, there was a significant increase in the cell population of the G2/M phase for up to 24 hrs, and the S phase for up to 48 hrs in the PA-1 cells, with a compensatory decrease in the population in phases S and G2/M. After the EGCG treatment, the cell population in the S phase was especially significantly increased for up to 48 hrs compared to the other cell lines. These data suggest that the EGCG treatment induced cell cycle arrest in the G1 phase in the SKOV-3 and OVCAR-3 cells, and the time-dependent shift of cell population form the G2/M to the S phase in PA-1 cells.
3) Cell death induced by EGCG
The EGCG treatment has been shown to mediate cell death in ovarian cell lines. The uptake of EGCG prevents cells from undergoing proliferation, and increases the efficacy of the antitumor effect in vitro. To check whether the cell death was accompanied by the development of an apoptotic or necrotic process, the phenotypic changes characteristic of apoptotic cells were analyzed and quantified by double staining the ovarian cancer cells with annexin V and propidium iodide (PI). Exponentially growing control cells were also exposed to EGCG treatment, and then harvested at the predetermined times. Figure 2 shows that the cell death increased significantly after EGCG treatment in the SKOV-3 cells. That is, a greater induction of cell death (late apoptosis or necrosis) resulted from EGCG uptake in the SKOV-3 cells for up to 24 hrs at all EGCG concentrations, suggesting later stages of apoptosis and cells undergoing rapid secondary necrosis under culturing. The cell death rates increased sharply during the first day, but showed a slower decrease thereafter, changing the cell death patterns into early apoptosis for up to 48 hr after EGCG treatment. Conversely, a lower sensitivity to EGCG was shown in the OVCAR-3 compared to the SKOV-3 cells, but a distinct population of early apoptotic cells was not shown. Early apoptotic populations of cells were observed in the SKOV-3 and PA-1 cell lines. In contrast, the PA-1 cells underwent early apoptosis for up to 48 hrs. The cells exhibited a much higher susceptibility to early apoptosis in response to EGCG treatment in comparison to later apoptosis or necrosis. As expected, there was no detectable cell death effect with the control cells. These results showed that EGCG induced apoptotic cell death in each ovarian cancer cell line.
4) EGCG controlled the expression levels of several transcripts for 24 hr and 48 hr
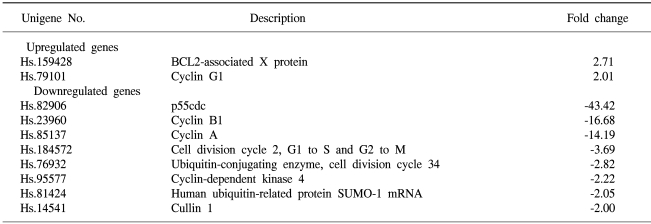
To determine the roles of the molecules responsible for EGCG function, the changes in the levels of transcripts regulated by EGCG were studied by macroarray analyses following EGCG treatment of the ovarian cancer cell lines. In the SKOV-3 cells, several transcripts were upregulated or down-regulated after EGCG uptake. The expression profiles were especially more prominent for up to 48hr than those for up to 24hr. The transcripts commonly up- or down-regulated at least two fold by EGCG treatment over time (24, 48 hr) are listed in Table 3. As shown in Tables 3 and 4, the expressions of several transcripts were down-regulated more than 2 fold after 48 h of treatment with EGCG. The p55cdc, cyclin B1 and cyclin A transcripts levels were found to significantly decrease at 48 hr post-EGCG uptake. In particular, during this period, a 43.4-fold decrease in p55cdc was detected, suggesting this was the most sensitivity to EGCG treatment. However, only BCL2-associated X protein was found to be highly upregulated at 48hr, showing a 2.7-fold decrease. In contrast, the expressions of 12 transcripts were down-regulated more than 2 fold by 24 hr of treatment with EGCG. Of these, the transcripts encoding for E2F transcription factor 1 and DP-1 were found to be significantly downregulated by EGCG for 24hr. The cullin 3, E2F transcription factor 2, cyclin B1 and CDC28 protein kinase 2 were also shown to be downregulated after 24h of treatment. In contrast, the cell division cycle 2 and G1/S-specific cyclin C were only shown to be upregulated for 24 hr. These data suggest that EGCG can influence the gene expression pattern in the SKOV-3 cells. Furthermore, it is likely that these regulated genes might possibly be associated with resistance/sensitivity to EGCG in this cell line.
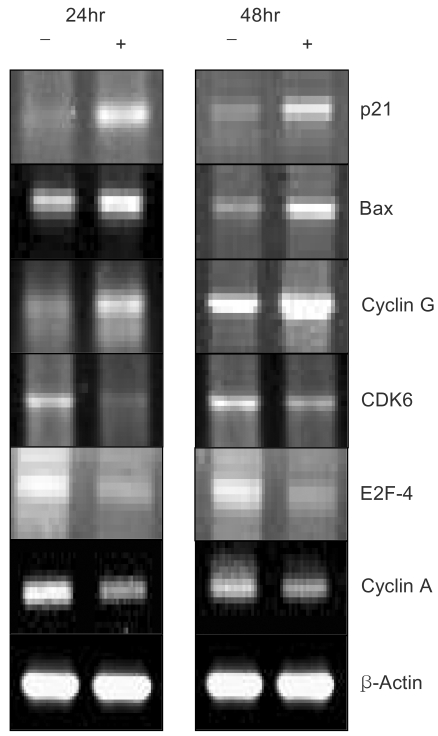
5) EGCG controlled the expression levels of several proteins for 24 hr and 48 hr
Northern and Western blot analyses of several proteins associated with growth arrest and/or apoptosis have been performed with SKOV-3 cells uptaken by EGCG at 25 µM for 24 and 48hr. As shown in Figure 3, several up- and down-regulated transcripts confirmed the patterns obtained from the macroarray, showing the consistency of our experiment. Several differentially expressed transcripts, such as p21, Bax and E2F-4, were reported to be similarly expressed with protein expressions, respectively. As shown in Figure 4, the human β-actin analysis showed that the amount of protein applied to each lane was essentially the same. Moreover, only one protein band was detected in each lane, suggesting there was no degradation of the β-actin. The P21 protein was highly expressed after treatment the Bax was upregulated And the BCL-XL and Proliferating cell nuclear antigen (PCNA) reached the same levels at 24h, and started to significantly decrease at 48 h. A CDK2 band was observed, but this was slightly weaker compared to the other proteins bands. Although both CDK4 and cyclin D1 were detected, the levels of these proteins were found to remain unchanged upon EGCG treatment.
DISCUSSION
The growth inhibitory effects of green tea have been reported in many tumor cell lines (8,20~24). Despite chromosomal alterations findings, there are currently few examples of specific cytogenetic studies that have contributed to the clinical management of solid tumors, such as ovarian cancer (25). The main causes of the cancer are considered sporadic in nature and to arise as a result of acquired alterations in oncogenes and tumor suppressor genes, such as p53 and PTEN (1,2). The alterations that lead to ovarian cancer vary between patients, and the striking clinical heterogeneity of ovarian cancer likely reflects an underlying molecular heterogeneity. It could be speculated that the possible application of green tea compounds for inhibiting ovarian cancer growth might be dependent upon the effective EGCG concentrations delivered into cancer cells in vivo.
The anti-tumor effects of EGCG have been reported to be mediated by apoptosis (8,13,21), inactivation of transcription factors (23), inhibition of urokinase enzyme activities, suppression of lipooxygenase and cyclooxygenase activities and G1 arrest of the cell cycle. Kennedy et al. recently reported that green tea extract causes cytochrome c release and caspase activation for the induction of apoptosis. More recently, it has been reported that EGCG inhibits the activity of topoisomerase I, which play critical roles in DNA replication, transcription and chromosome condensation. EGCG also inhibits tumor cell growth by suppressing the induction of vascular endothelial growth factor (VEGF) in human colon cancer cells. Our observation also confirmed that EGCG induced apoptosis and cell cycle arrests during the G1 phase in the SKOV-3 and OVCAR-3 cell lines, and G1/S phase arrest in the PA-1 cells, supporting the previous finding that EGCG arrests cell cycle progression in the G1 phase (8). In our study, however, cell cycle arrests and apoptosis were dependent upon the ovarian cancer cell line, supporting the notion that there could be something specific to the molecular-level environment of the cell-specific growth suppression effects due to EGCG. In the SKOV-3 cells, EGCG induces cell cycle arrest during the G1 phase and apoptosis through the induction of the expression of p21WAF1, which accords well with our results at the mRNA and protein levels. This result suggests that EGCG acts in the same way as adenoviral p53 proteins in HPV-infected cervical cancer cell lines.
When Bax predominates, programmed cell death is accelerated, and the death repressor activity of Bcl-2 is countered. Bax-deficient mice indicated that the pro-apoptotic Bax molecule can function as a tumor suppressor. Although Bax is known as a primary-response gene for p53 and is involved in a p53-regulated pathway for the induction of apoptosis, it has previously been shown not to be absolutely necessary for p53-dependent apoptosis. Bax mRNA and/or protein levels are not increased after p53 induction. That is, EGCG inhibited the growth of all three ovarian cancer cell lines with different p53 stati (p53 negative, SKOV-3 cells; mutant type p53, OVCAR-3 cells; and wild type p53, PA-1 cells); suggesting a p53-related pathway is involved. It seems that as the ratio of Bcl-XL to Bax determines survival or death following an apoptotic stimulus, and Bax and Bcl-XL are important in EGCG-dependent apoptosis in SKOV-3 cells.
Proliferating cell nuclear antigen (PCNA) is a 36-kDa, acidic, non-histone nuclear protein, whose expression is associated with the late G1 and S phases of the cell cycle. PCNA can be used as an immunohistochemical marker of proliferating cells. In summary, EGCG treatment was observed to exert an important role in suppressing ovarian cancer cell growth through apoptosis and cell cycle arrest.
CONCLUSIONS
EGCG can inhibit ovarian cancer cell growth through the induction of apoptosis and cell cycle arrest, as well as regulation of cell cycle related proteins. Therefore, EGCG-mediated apoptosis can be applied to an advanced strategy in the development of a potential drug against ovarian cancer.