INTRODUCTION
Colorectal cancer is the second most frequently diagnosed malignancy and the second most common cause of cancer death in the world (1). Colon cancer is also the 4th greatest cause of cancer death in Korea (2). In the treatment of advanced metastatic colorectal cancer, several new agents, such as irinotecan and oxaliplatin, have been developed during the past decades, which have improved both the disease free and overall survivals. Of these agents, 5-fluorouracil (5-FU) still remains as one of the most active agents used in the treatment of this disease (3~5). It would; therefore, be important to select patients who can benefit from 5-FU-based chemotherapy in the treatment of advanced colorectal cancer, as those unlikely to benefit could be spared the harmful side effects of 5-FU-based chemotherapy. However, a predictive marker for its response remains to be fully defined.
Thymidylate synthase (TS), which catalyzes the conversion of 2-deoxyuridine 5-monophosphate and N5,10-methylene tetrahydrofolate to deoxythymidine monophosphate, has been an important target for fluoropyrimidine drugs (6). It has been reported that insufficient inhibition of TS may induce resistance to fluoropyrimidines, as well as newer folate-based TS inhibitors, and overexpression of TS is associated with a poor response to cytotoxic therapy (7,8). In an adjuvant setting, TS is one of the most promising predictors of disease-free and overall survivals in colorectal cancer (9,10). Also, in an advanced metastatic disease, both high levels of TS mRNA and protein in tissues obtained from the metastatic lesion predict poor response to fluoropyrimidine-based therapy (11,12).
Thymidine phosphorylase (TP) is known as an enzyme that converts both 1-(tetrahydro-20-furanyl)-5-fluorouracil and 5'-deoxy-5-fluorouridine (5-DFUR) to 5-FU, and was found to be identical to platelet-derived endothelial cell growth factor, which is thought to be an angiogenic factor. The expression of TP might be correlated with the efficacy of 5-FU-based chemotherapy (13). Vascular endothelial growth factor (VEGF) is an angiogenic factor that stimulates the growth of endothelial cells (14), and consists of four isoforms, with 121, 165, 189 and 206 amino acid residues, which are abundantly secreted by many kinds of carcinoma cells (15). Recent studies have indicated a positive correlation between the expression of VEGF, tumor microvessel density (MVD) and tumor aggressiveness (16).
Mutations in p53 have been found to occur in 40 to 60% of patients with colon cancer, and mutant p53 renders malignant cells less sensitive to most chemotherapeutic agents (17).
Most of the studies; however, examined the expression of TS or TP in the tissues obtained from metastatic lesions in order to define the correlation with chemotherapy responsiveness, but obtaining a sufficient amount of tissue from metastatic lesion for these studies has not always been possible. Therefore, in this study, whether the TS, TP, p53 and VEGF protein expressions in the tissues from primary colorectal cancer can be used as a predictive marker for the response or outcome of 5-FU-based chemotherapy were investigated.
MATERIALS AND METHODS
1) Eligibility and patient evaluation
A total of 45 histologically or cytologically proven metastatic or relapsed colorectal cancer patients were included in the present study. Other eligibility criteria included; the presence of measurable tumor lesions, an age >18 years, ECOG performance 0~2, adequate organ function and at least a 3 month life expectancy. The study patients had not previously received chemotherapy for their advanced disease, and had completed adjuvant chemotherapy more than 6 months before entry to our study. Radiotherapy was permitted for palliation, but not if it was associated with a present measurable lesion. All patients gave their written informed consent before enrollment in our study.
2) Treatment schedule
The FOLFIRI regimen was as follows: 180 mg/m2 irinotecan was administered in 500 ml of 5% dextrose as a 1 hour infusion on day 1, with 400 mg/m2 5-fluorouracil (5-FU) iv injected, 20 mg/m2 leucovorin (LV) infused for 2 hours and then 600 mg/m2 5-FU infused for 22 hours on days 1 and 2. The FOLFOX regimen was as follows: 85 mg/m2 oxaliplatin was administered in 500 ml of 5% dextrose as 2 hour infusion on day 1, with 400 mg/m2 5-FU iv injected, 20 mg/m2 LV infused for 2 hours and then 600 mg/m2 5-FU infused for 22 hours on days 1 and 2. Each regimen was repeated every 2 weeks. Treatment was continued until disease progression, unacceptable adverse effects, or withdrawal of consent by the patient was noted.
3) Response criteria and toxicity
Pretreatment evaluations included; complete medical history and physical examination, complete blood count and chemistry profile, chest X-ray and radiological tumor parameter assessment. Patients were assessed for their clinical response after 4 cycles of chemotherapy. Tumor response classification was carried out according to the standard World Health Organization criteria. Time to disease progression was defined as the interval from the date of enrollment to the first observation of progressive disease or occurrence of death from any cause. The response duration was defined as the interval from the date of the first documented treatment response to the date of disease progression. Toxicities were assessed according to the National Cancer Institute of Canada Clinical Trials Group expanded common toxicity grading.
4) Immunohistochemical staining
Immunohistochemical staining of sections was performed using a peroxidase technique. Formalin-fixed paraffin-embedded tissue blocks were sectioned into 4-µm thicknesses. Sections were deparaffinized three times in xylene for 10 min each times, and rehydrated in serial graded alcohol in the following order: 100% for 5 min, 90% for 5 min, 70% for 5 min and 50% for 5 min. Antigen retrieval was performed for VEGF and p53. For antigen retrieval, 10 mM citrate buffer (pH 6.0) was cooked in a microwave for 3 min, the slides placed in preheated citrate buffer and then microwaved three times for 2 min each time. The container was put in a margin, and cooled for 20 min at room temperature. The slides were washed once in phosphate-buffered saline (PBS) for 5 min. Endogenous peroxidase activity was blocked by 3% hydrogen peroxide in 45 ml of methanol for 15 min. The slides were washed three times in 1×PBS for 5 min. Subsequently, all the slides were preincubated with two drops of normal blocking solution (goat serum) at 37℃ for 20 min (100 µl/slide). Caution was exercised to avoid the slides drying. The antibodies used were: a mouse monoclonal IgG antibody, at a 1:100 dilution, for thymidylate synthase (NeoMaker, Fremont, CA), a mouse monoclonal IgG antibody, at a 1:100 dilution, for thymidine phosphorylase (NeoMaker, Fremont, CA), a mouse monoclonal IgG antibody, at a 1:100 dilution, for p53 (Novocatra Laboratories Ltd, Newcastle, UK) and a mouse monoclonal IgG antibody, at a 1:100 dilution, for VEGF (Oncogene, Boston, MA). Each antibody was incubated overnight at 4℃ and then washed twice in 1×PBS for 5 min. Each of the secondary biotinylated goat anti-mouse IgG antibodies was added for 30 min at 37℃, followed by the addition of avidin-biotinylated peroxidase complex (Vector Laboratories, Burlingame, CA) for a further 30 min at room temperature. After washing with PBS, the samples were stained with 3,3'-diaminobenzidine (Sigma Chemical Co, St Louis, MO), and counterstained with hematoxylin for 30 sec.
5) Evaluation of TS, TP, p53, and VEGF immunostaining
All slides were coded and evaluated by two experienced pathologists, without prior knowledge of the patients' identity or clinical status. Each experiment was performed twice, independently. For thymidylate synthase, each slide was assigned a score for intensity and staining pattern. The intensity scores ranged from 0 to 3, and the staining pattern was either F (focal) or D (diffuse). For the intensity, 0=no staining, 1=trace staining, 2=definite staining of light to moderate intensity and 3=bright intensity. Tissue samples with 25% or fewer malignant cells stained at the assigned intensity levels were considered F, whereas those with greater than 25% stained were scored as D. TS intensity levels 0 to 1 were grouped together and considered low intensity, whereas 2 to 3 were considered high-intensity staining, as described previously (18). More than 5% cytoplasmic staining for thymidine phosphorylase was defined as positive (19), with more than 10% of nuclear staining defined as positive for p53. VEGF positive was considered when more than 30% of the cytoplasm in the tumor cells was stained with intensity stronger than that of nonspecific background staining.
6) Statistical analysis
The patient characteristics were compared using X2 test or Fisher's exact test, when appropriate. Survival curves were calculated using the Kaplan-Meier method, and compared with other prognostic variables using the log-rank test. Correlation between variables was assessed by the Pearson's coefficient (γ). Univariate analysis and multivariate stepwise Cox's regression analyses were performed to identify prognostic factors for survival. All statistical analyses were two-sided, at a significance level of p=0.05, and performed using SPSS 11.2R statistical software.
RESULTS
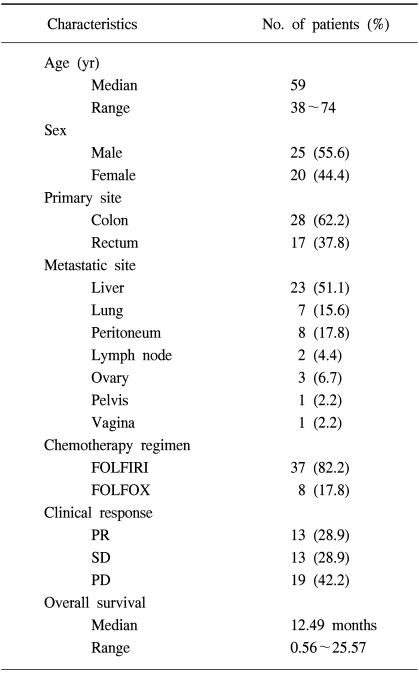
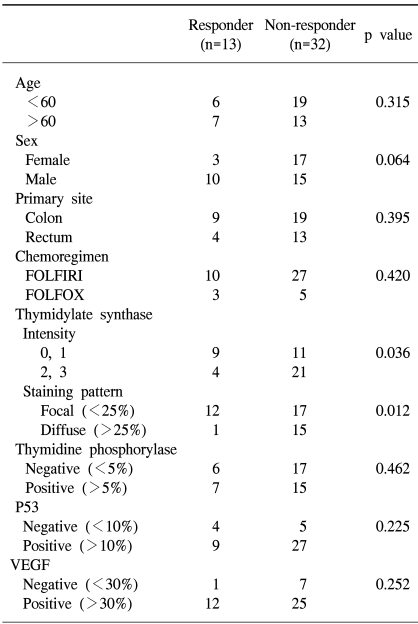
A total of 45 metastatic colorectal cancer patients were enrolled in this study, including 25 males and 20 females, with median age of 59 yrs. The colon was the most common primary site, and the liver the most common metastatic site, followed by the lungs and peritoneum. Thirty-seven patients were treated with 5-FU/LV/irinotecan (FOLFIRI) and 8 with 5-FU/LV/oxaliplatin (FOLFOX). The clinical response was evaluated after every 2 cycles of chemotherapy, according to the WHO criteria. The overall response rate was 28.9% (13/45), but without a complete response (Table 1). There was no significant difference between the responder and non-responder groups in age, sex, and primary site, the number of metastasis lesions or chemotherapeutic regimen (Table 2).
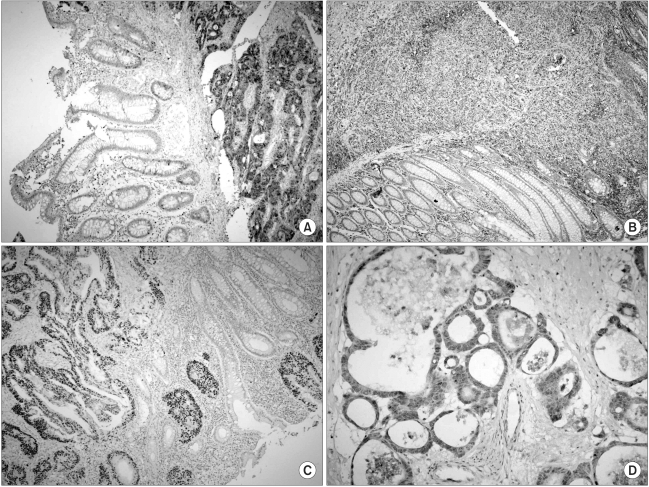
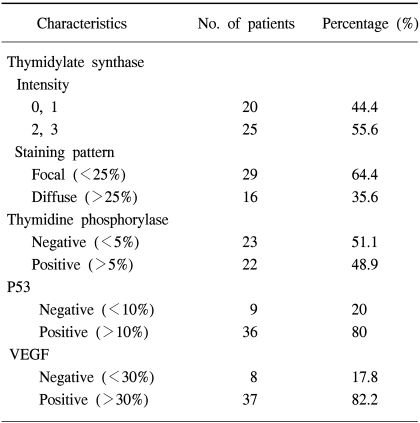
The protein expression was immunohistochemically analyzed in paraffin embedded tissues, using monoclonal antibodies against TS, TP, VEGF and p53. The TS staining in the primary tumor specimens indicated a predominantly granular cytoplasmic staining pattern in the tubular glands of the colorectal cancer (Fig. 1A). TS staining was also present in the lymphocytes adjacent to the tumors. For TS, each slide was assigned a score for intensity and staining pattern; TS intensity levels 0 to 1 were grouped together and considered low intensity, whereas 2 to 3 were considered high-intensity staining. Twenty-five patients (55.6%) showed high- and 44.4% (20/45) low-intensity staining (Table 3). For the TS expression, Pearson's chi-square tests were used to assess the possible association between these markers and the response to chemotherapy. Nine of the 20 patients (45%) with low intensity staining for TS expression achieved a partial response, whereas only 4 of the 25 patients (16%) with high intensity staining for TS showed a clinical response. There was a significant difference in the intensity of TS expression in the primary tumors between the clinical responders and non-responders (p=0.036) (Table 3), but not in the overall survival (p=0.13) (Fig. 2A). In terms of the staining pattern for the expression of TS in the primary tumor samples, 12 of the 29 patients (41.3%) with a focal pattern of staining achieved partial responses, whereas only one of the 16 (6.3%) with a diffuse pattern showed a clinical response. A diffuse pattern of staining was correlated with poor response (p=0.012) and survival (p=0.045) (Table 3, Fig. 2B). When the overall survival of the 4 subgroups was analyzed according to the TS expression intensity and pattern (high/diffuse (15 cases); high/focal (10); low/diffuse (1); low/focal (19), there was marginal significant difference between low/focal and high/diffuse group (p=0.058).
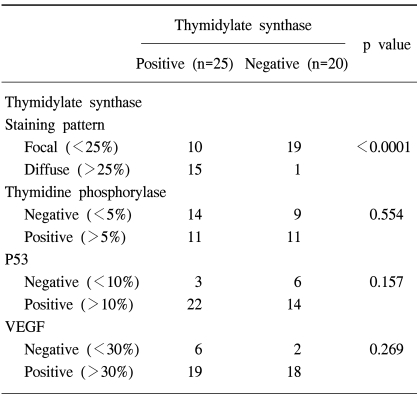
Thymidine phosphorylase (TP) was distributed in both the cytoplasmic and nuclear compartments of the cancer and infiltrating cells (Fig. 1B). The expression of TP was negative in 23 and positive in 22 patients. There was no correlation between the expression of TP and clinical response. The expression of p53 was noted in 48.9% of the patients (36/45) (Fig. 1C), but there was no difference in p53 expressions between the responders and non-responders to chemotherapy. Most of the tumors (82.2%, 37/45) were positive for VEGF expression (Fig. 1D); however, there was no association between VEGF expression and clinical response. Furthermore, the overall survival was not associated with the expression of TP, P53 or VEGF (data not shown). High intensity staining for TS was strongly associated with diffuse staining pattern of TS, but there was no correlation between the TS expression and those of TP, P53 or VEGF (Table 4).
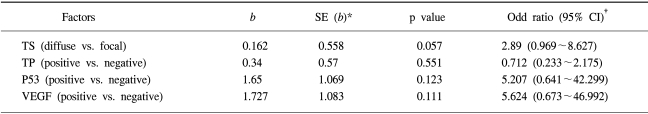
A multivariate analysis, using a Cox proportional hazards model and a step-wise procedure, was performed to determine the significance of the 5-FU- based chemotherapy treatment on the status of each protein expression; TS, TP, P53 or VEGF. The TS staining pattern was found to be an independent prognostic factor affecting the overall survival (Table 5).
DISCUSSION
In this study, a significant correlation has been shown between TS expression in tumor specimens obtained from primary tumor and the clinical response to 5-FU based chemotherapy: Nine of the 20 patients (45%) with low intensity staining for TS expression achieved partial responses, whereas only 4 of the 25 patients (16%) with high intensity staining for TS showed clinical responses. There was a significant difference in the intensity of TS expression in the primary tumors between the clinical responders and non-responders. The pattern of TS expression was noted to be very important: a high intensity of TS expression showed a poor response to chemotherapy. Furthermore, a diffuse type of staining pattern was more important in determining the responsiveness to 5-FU based chemotherapy: Twelve of the 29 patients (41.3%) with a focal pattern of staining achieved partial responses, whereas only one of the 16 (6.3%) with a diffuse pattern showed a clinical response. Moreover, a diffuse type of staining pattern of TS was associated with poor survival.
It has been reported that the level of TS expression in colorectal cancer is one of the most promising predictors of the response to 5-FU-based chemotherapy (10,20), and that a higher level of TS expression was associated with a poor response to chemotherapy. In most studies, the expression of TS was measured in tumor specimens from metastatic lesions; however, it is not always possible, in practice, to obtain sufficient amounts of tissue samples from metastatic lesions. Therefore, in this study, the TS expression was measured in the primary tumor samples, and attempts were made to evaluate whether the TS expression from primary tumor can be used as a predictive marker for the clinical response to 5-FU based chemotherapy. The expression of TS in the primary site was observed to be correlated with a clinical tumor response to chemotherapy, as well as with the overall survival. This study suggests that measurement of the TS expression in the primary tumor can not only predict the response to 5-FU, but also identify patients with a better survival prognosis. Recently, Johnston et al. (18) reported that measurement of the TS protein levels in primary tumor tissue does not help in predicting the outcome or response to 5-FU in metastatic disease sites. However, they noted a trend of high TS levels in the primary tumor toward an improved response rate at metastatic sites. Nevertheless, earlier studies have demonstrated a clear inverse relationship between a high level of TS expression and the responsiveness to 5-FU based chemotherapy; although no plausible explanation for such disparate observations has been offered.
There have been several reports, with small numbers of patients, comparing the TS expression in primary tumors to metastatic sites. Aschele et al. (21) measured the TS expression immunohistochemically in patients with both primary tumors and corresponding liver metastases, and found that the level of TS expression was lower in the metastatic liver than the primary tumor. Gorlick et al. (22) and Cascinu et al. (23) examined the TS expression in various metastatic lesions, and noted significant variability in the levels depending on the metastatic sites. It appears to be possible that the expression of TS at the metastatic site can be modulated by other mutations that have accumulated during metastasis. Most studies have demonstrated varying levels of TS expression in both the primary and metastatic sites, and even between metastatic sites. Those discrepant results could be due to different technologies used for assessment of the intratumoral TS levels, or the small numbers of samples examined. In this study, the expressions of TS were able to be compared in 8 samples from 45 patients between both the primary tumors and metastasis sites. Although only small numbers of samples were examined, seven out of 8 patients were in accordance with each pair of tumors in their expressions of TS protein. This contradictory result should be verified by simultaneously analyzing the expressions of TS in both the primary tumor and the metastatic lesion using large numbers of samples. Nevertheless, similar studies and meta-analysis performed in an adjuvant disease setting, where the TS was measured in the primary tumor demonstrated that a high level of TS expression was correlated with the poor survival of patients with Dukes' B and C colon cancer, and that those with low TS levels derived greater benefit from adjuvant chemotherapy than those whose tumors had high TS levels (8~10). These results indicate that the TS levels in the primary tumor might be used as a predictive marker for the response to 5-FU based adjuvant chemotherapy.
Angiogenesis plays an important role in the progression of colorectal cancer. The growth and maturation of new vessels in a malignant disease are highly regulated and complex processes, involving numerous proangiogenic and antiangiogenic factors that are produced by the tumor and stroma cells, including the VEGF family, fibroblast growth factors (FGF), transforming growth factors (TGF-α and TGF-β), tumor necrosis factor, thymidine phosphorylase (TP, formerly termed platelet-derived endothelial cell growth factor, PD-ECGF), interleukin-8 and the angiopoietins (24). Also, it has also been reported that mutations of the ras and p53 genes up-regulate the expression of VEGF, suggesting that p53 is closely related to VEGF (25). Although angiogenic factors, such as VEGF, have been known to be associated with poor survival, the association with chemoresponse to 5-FU remain to be fully defined. In the present study, our immunohistochemical analysis revealed the expressions of TP, VEGF and P53 in 48.9, 82.2 and 80% of primary colorectal tumors, respectively, indicating that angiogenesis plays an important role in colorectal cancer. However, the expressions of these angiogenic factors were not correlated with each other, and no association could be found between the chemoresponse to 5-FU and the expressions of these factors. Although angiogenesis has been associated with poor survival in colorectal cancer, this lack of association of the chemoresponsiveness to 5-FU might suggest that angiogenesis may not be directly correlated with the genes related to 5-FU metabolism.