Introduction
Multiple myeloma (MM) is a neoplastic disease characterized by monoclonal proliferation of plasma cells and accounts for ~1%–2% of malignancies [1]. Induction chemotherapy followed by autologous stem cell transplantation (ASCT) has been incorporated as a standard approach for eligible patients. Although this strategy has improved clinical outcomes relative to chemotherapy alone, there remains an unmet need to enhance clinical outcomes [2]. These attempts include several strategies, including the introduction of an intensified induction regimen, tandem ASCT, and maintenance therapies [3–5]. Additional therapy is warranted to improve disease status, especially in patients with residual disease after ASCT. Although the role of consolidation therapy after ASCT has been debated, many previous studies have evaluated its clinical benefits using diverse regimens. In particular, bortezomib-based consolidation strategies offer delayed disease progression with an improved response status and a short course of chemotherapy [6].
Although ASCT is generally tolerable and associated with acceptable mortality, even in elderly patients, patients receiving ASCT frequently experience incomplete immunity, prolonged cytopenia, peripheral neuropathy, and organ dysfunctions [7,8]. Therefore, it is important to design a regimen considering the appropriate efficacy with acceptable toxicity. Consolidation therapy with bortezomib, thalidomide, and dexamethasone (VTD) reportedly improves disease status, with grade ≥ 3 neuropathy occurring in 7% of patients [9]. The concurrent use of bortezomib and thalidomide reportedly worsens neuropathy in a dose-dependent manner [10].
Bortezomib is a potent first-in-class proteasome inhibitor showing remarkable efficacy in newly diagnosed and relapsed/refractory MM [4,11,12]. Additionally, cyclophosphamide is an oral alkylating agent that has shown efficacy and relative tolerability as a component of an induction regimen [13]. A previous study showed that a three-drug regimen comprising cyclophosphamide, bortezomib, and dexamethasone (CVD) elicited a rapid and profound response with manageable toxicity as induction therapy [14]. Therefore, the Korean Multiple Myeloma Working Party (KMMWP) decided to evaluate the efficacy and toxicity of CVD as consolidation therapy in patients with residual disease after ASCT.
Materials and Methods
1. Patient eligibility
Patients aged ≥ 20 years diagnosed with symptomatic MM and treated with at least one induction chemotherapy, including a thalidomide- or bortezomib-based regimen, or VAD and ASCT, were included in this trial. All eligible patients were required to present a very good partial response (VGPR) or partial response (PR) on evaluation within 10–14 weeks after the infusion of autologous stem cells and no clinical evidence of disease progression until study enrollment. Other eligibility criteria included the following: appropriate bone marrow function, which was defined as absolute neutrophil count > 1,000/μL, hemoglobin > 9.0 g/dL, and platelet count > 70,000/μL; appropriate liver function, which was defined as serum transaminases and serum total bilirubin < 3-fold higher than the upper normal limit; no evidence of congestive heart failure with left ventricular ejection fraction (LVEF) of > 50%; Eastern Cooperative Oncology Group performance status between 0 and 2; negative pregnancy test result or menopausal period of > 1 year if of child-bearing age; life expectancy of > 6 months; willingness to provide written informed consent. Exclusion criteria were as follows: diagnosis of primary amyloidosis, smoldering MM, or monoclonal gammopathy of undetermined significance; plasma cell leukemia with peripheral plasma cells at > 20%; grade ≥ 2 peripheral neuropathy; grade ≥ 2 toxicity due to previous treatment, including ASCT; progressive disease (PD) after ASCT; having received other post-ASCT therapies, such as chemotherapy and/or radiation; positive for human immunodeficiency virus; active hepatitis B and/or hepatitis C infection; previous hypersensitivity to bortezomib, boron, or mannitol; presenting a severe acute infection requiring urgent treatment; currently pregnant or breast-feeding; symptomatic heart failure or LVEF < 50%; history of any other malignant disease, except basal cell carcinoma or in situ carcinoma of cervix uteri, within 5 years; administration of other test drugs, chemotherapy, or immunotherapy.
2. Study design and treatment schedule
This multicenter, single-arm, open-label phase II study was conducted at 12 centers in Korea, with enrollment between July 2014 and January 2018. The trial comprised three periods: screening, treatment, and follow-up. During the screening period, patients who received ASCT and showed VGPR or PR within 10–14 weeks after the infusion of autologous stem cells were recruited, and baseline evaluations were performed for enrollment. All patients satisfying the inclusion criteria started treatment within 2 weeks. During the treatment period, three 4-week cycles of oral cyclophosphamide 300 mg/m2 on days 1, 8, and 15; subcutaneous bortezomib 1.3 mg/m2 on days 1, 8, 15, and 22; and oral or intravenous dexamethasone 20 mg/day on days 1 and 2, 8 and 9, 15 and 16, and 22 and 23 were performed. Bone marrow examination was performed at the study enrollment and the end of treatment, and minimal residual disease (MRD) was assessed using clonoSEQ (v2.0, Adaptive Biotechnologies, Seattle, WA). To prevent infectious diseases, such as those associated with Pneumocystis jirovecii and Aspergillus, the use of prophylactic agents, such as trimethoprim/sulfamethoxazole, itraconazole, and acyclovir, was allowed. Intravenous immunoglobulin was administered according to the protocol after ASCT according to the policy of each center. Bisphosphonate–pamidronate (60–90 mg) over a 6-hour period was administered on the first day of every cycle during consolidation and then every 8 weeks for 2 years for all patients, except those with contraindications. Other supportive therapies, such as blood transfusion, granulocyte-colony stimulating factor, and erythropoietin-stimulating agents, were allowed at physician discretion. After the completion of consolidation therapy, the end of the treatment visit was completed within 30 days of response evaluation being performed. During the follow-up period, response evaluation was performed every 8 weeks until progression or at 144 weeks. Response assessment was performed based on the International Myeloma Working Group uniform response criteria [15]. Along with the response status, survival information, skeletal-related events, and data on the next treatment were also collected during that period.
3. Dose modification
Dose escalation was not allowed during the study period. Bortezomib dose reductions were stipulated for grade 4 thrombocytopenia (< 25,000/μL) or neutropenia (< 500/μL) that recurred or did not recover within two days and/or grade 2 peripheral neuropathy or grade 1 peripheral neuropathy with pain (level-2, 1.0 mg/m2; or level-3, 0.7 mg/m2). Cyclophosphamide dose reductions were performed for grade 3 non-hematologic adverse events or grade 4 hematologic adverse events. In cases of grade 4 hematologic adverse events, dose modification of cyclophosphamide was performed preferentially before the dose of bortezomib was modified. Dexamethasone was administered if bortezomib was administered or if dexamethasone-related grade 3 adverse events were observed.
4. Statistical analyses
Categorical and continuous variables were assessed using Fisher exact test and the Mann-Whitney U test, respectively. Survival data and skeletal-related events were analyzed using Kaplan-Meier curve estimates. Overall survival (OS) was defined from the start of consolidation therapy to the date of death from any cause or the last follow-up date. Progression-free survival (PFS) was calculated from the start of consolidation therapy until the date of disease progression or death. Differences were considered statistically significant at a two-sided p < 0.05. All statistical analyses were performed using SPSS ver. 21.0 (IBM Corp., Armonk, NY).
Results
1. Patient demographics
Sixty patients with symptomatic MM who achieved PR or VGPR after ASCT were initially screened. Of these, 13 patients did not meet the eligibility criteria, and two refused to participate in the study. Subsequently, 45 patients were enrolled in this study (Fig. 1). Baseline demographics and characteristics are presented in Table 1. The median age at enrollment was 54 years, and 11 patients (31.1%) had International Staging System stage III at diagnosis. Approximately half (n=23; 51.1%) of the patients were treated with thalidomide and dexamethasone (TD) as induction therapy, whereas 19 (42.2%) received VTD. In two patients, the treatments were changed during induction therapy due to unresponsiveness. The other patients presented at least PR after induction therapy. Thirty-six patients (80%) were treated with high-dose melphalan as a conditioning regimen for ASCT. The median time from diagnosis to ASCT was 185 days (range, 73 to 553 days), and the median time from ASCT to the start of CVD consolidation was 106 days (range, 62 to 130 days). At enrollment, 39 patients (86.7%) had VGPR, and the others had PR.
2. Response evaluation
All patients were available for response evaluation before and after consolidation therapy. Table 2 shows the response rates after induction, after ASCT, at study enrollment, at the end of treatment, and the best response during follow-up.
After completing consolidation therapy, 13 patients (30.9%) achieved complete response (CR) or better, of whom 12 presented with VGPR and one showed PR initially at the time of study enrollment. Among 22 patients (52.4%) who presented with VGPR at the end of consolidation therapy, four showed PR at enrollment. Overall, 18 of 42 patients (42.9%) experienced an improved response status immediately after completion of the consolidation therapy. Two patients had PD after completing consolidation therapy, and both presented high-risk cytogenetics at diagnosis and t(4;14) according to fluorescent in situ hybridization (FISH) analysis.
Additionally, we identified further improvement in response status during the follow-up visit after the end of the treatment in seven patients. Four patients who showed VGPR at the completion of consolidation therapy achieved CR or stringent CR during follow-up. One patient who showed PR revealed VGPR later, and two patients who presented with stable disease showed improved responses to VGPR and PR, respectively. The median time to best response from the start of CVD consolidation was 3.3 months (range, 1.9 to 27.5 months). Furthermore, 22 of the 42 patients (52.4%) experienced an upgraded response status with CVD consolidation therapy.
3. Survival outcomes
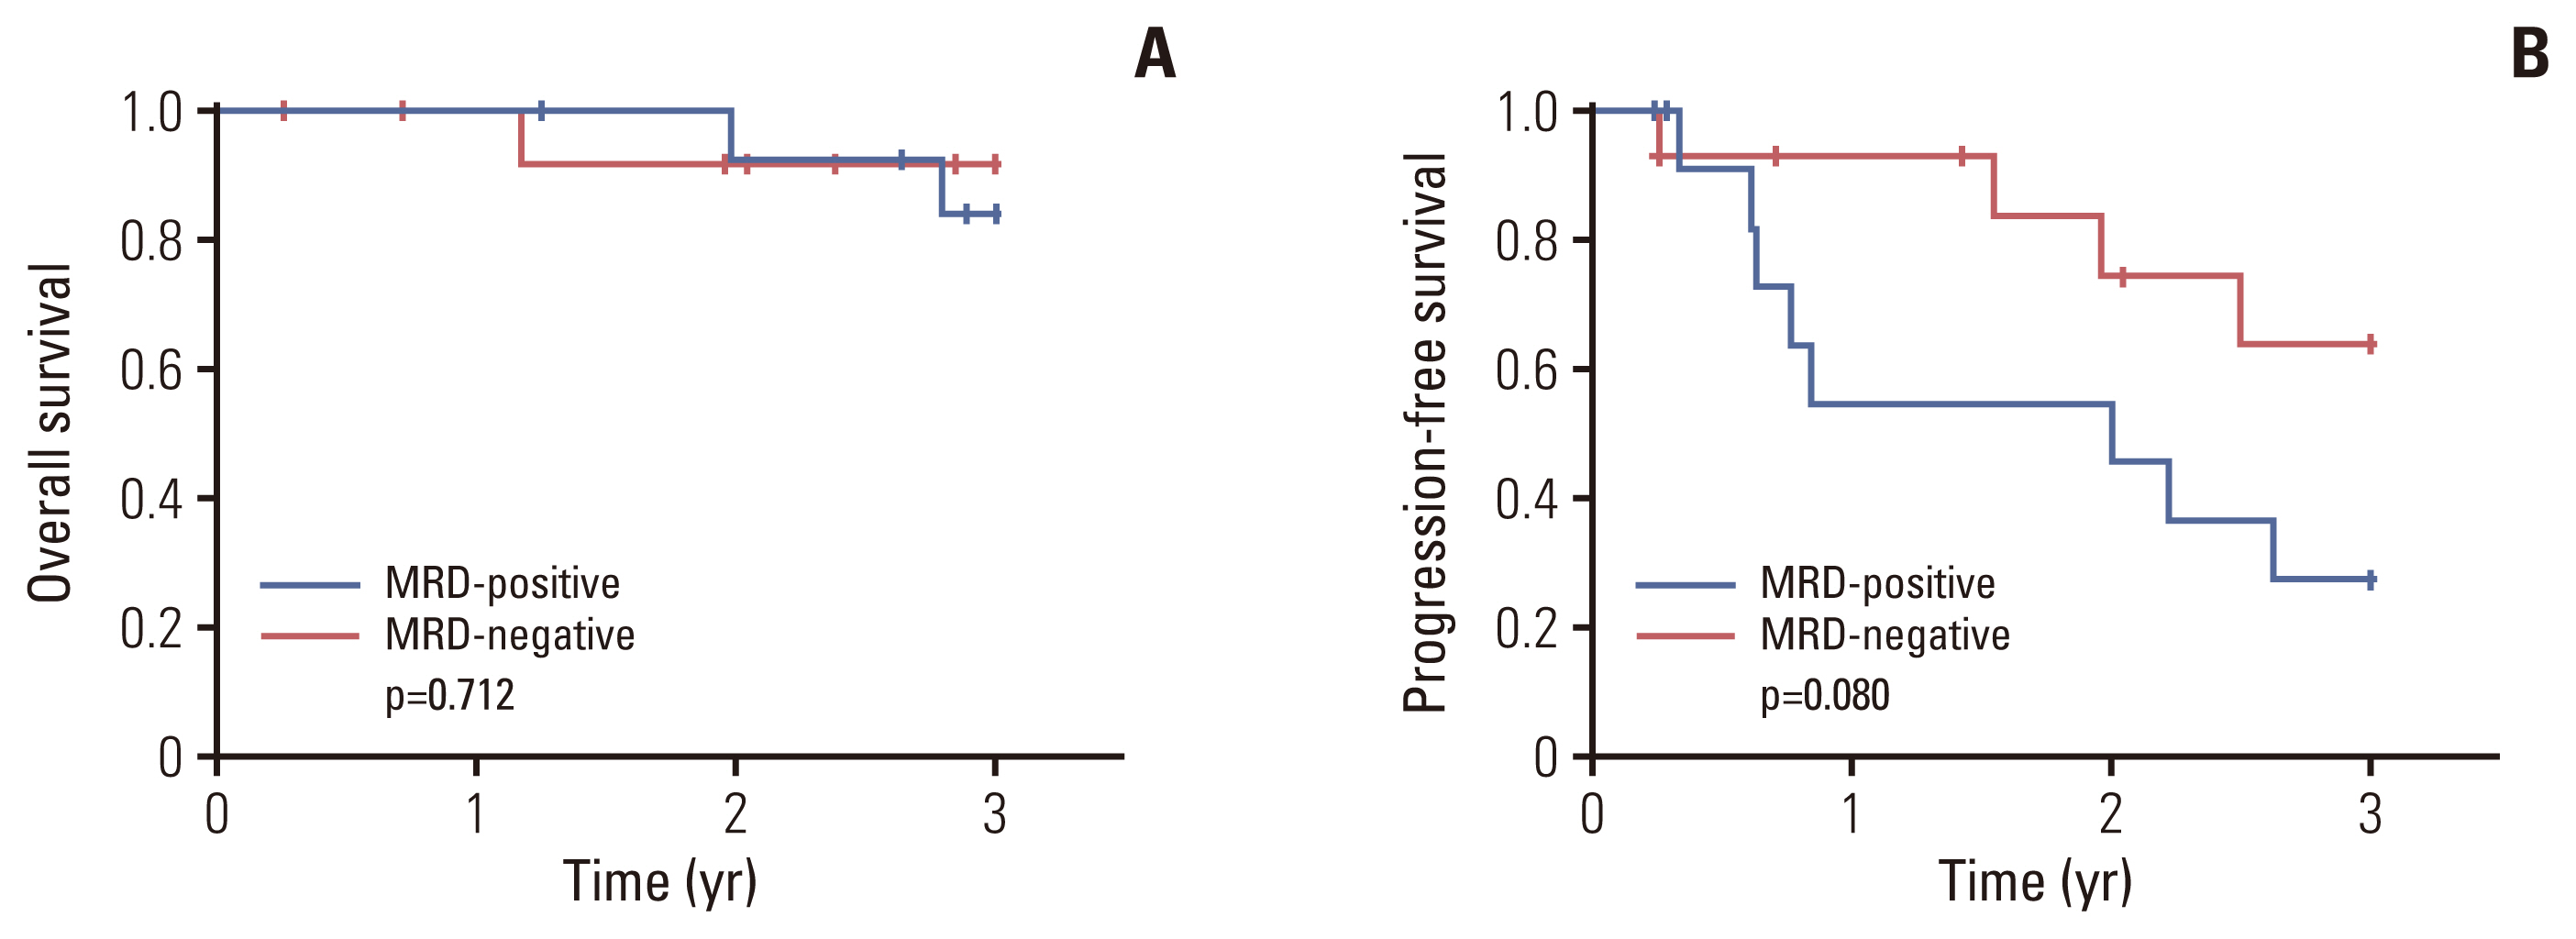
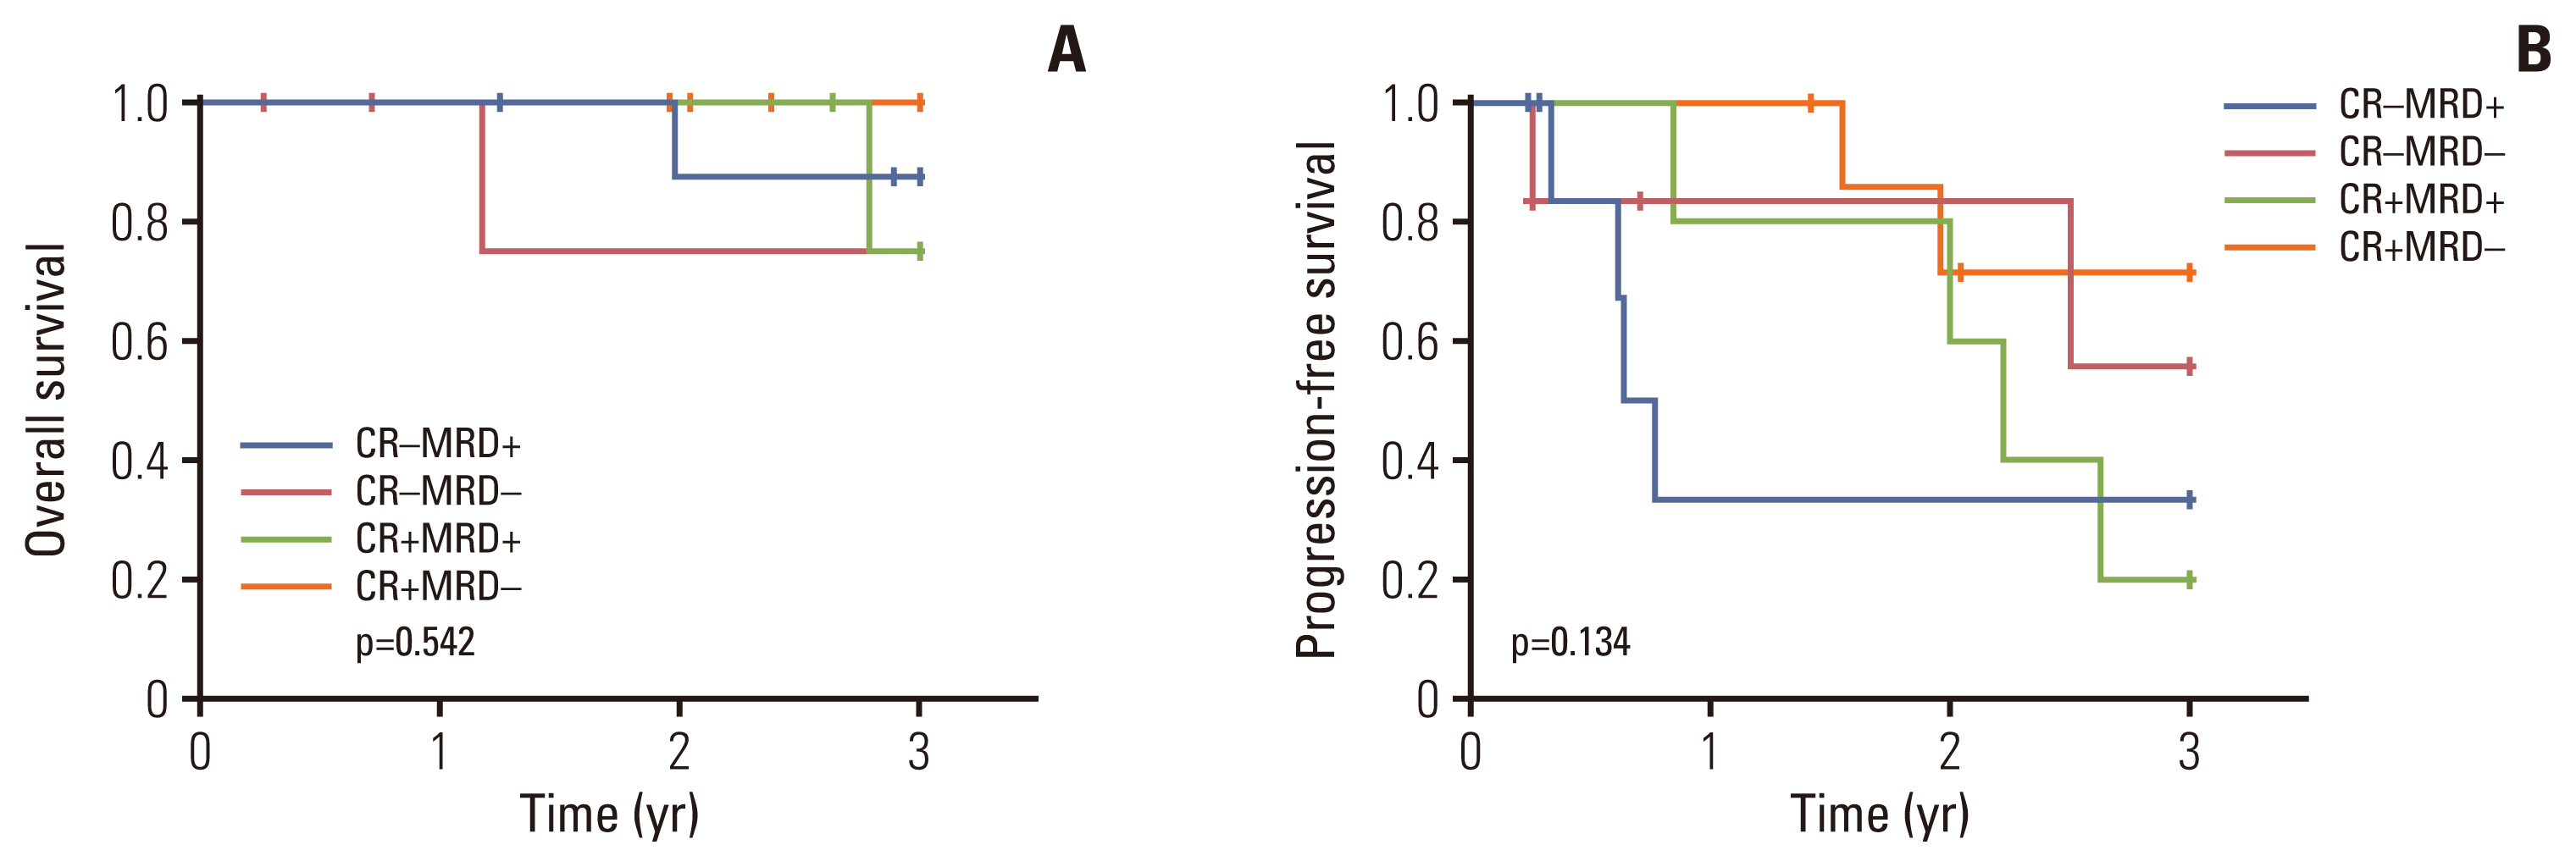
During the follow-up period (designated as 36 months after completion of consolidation therapy), clinical outcomes, including survival data, disease progression, and next treatment, were analyzed. Three-year OS and PFS were 89.0% and 42.7%, respectively (Fig. 2). Patients who had high-risk FISH at diagnosis showed significantly inferior 3-year PFS (20.0% vs. 60.5%, p=0.025) and significantly worse 3-year OS (40.0% vs. 100%, p < 0.001) relative to patients with standard-risk FISH (S1 Fig.). Patients who achieved CR or better as their best response after consolidation therapy showed a tendency toward better 3-year OS (84.4% vs. 93.3%, p=0.310) and PFS (36.7% vs. 48.5%, p=0.177), although these were not statistically significant (S2 Fig.). We defined the patients who presented the best response during a follow-up visit after the end of treatment as late responders (n=7); the others were labeled as early responders (n=35). Late responders showed significantly superior 3-year PFS (100% vs. 28.1%, p=0.040) and a tendency toward better 3-year OS (100% vs. 86.4%, p=0.316) (S3 Fig.). Previous exposure to bortezomib (n=22) did not significantly affect clinical outcomes, in terms of both OS and PFS (S4 Fig.). Additionally, MRD was assessed at the time of enrollment and the end of treatment. Because bone marrow samples at diagnosis were unavailable, we assumed productive rearrangements with maximal frequency in samples collected at enrollment as the dominant clones for MRD evaluation. At a sensitivity threshold of 10−5, MRD-negativity was achieved in 14 of 28 patients after consolidation therapy. Patients who achieved MRD-negativity showed a tendency toward superior 3-year PFS (63.7% vs. 27.3%, p=0.080) and 3-year OS (91.7% vs. 83.9%, p=0.712), although neither was statistically significant (Fig. 3). Classification of patients according to the achievement of CR and MRD status revealed that patients who achieved CR and MRD-negativity presented relatively better 3-year PFS (71.4%) than those who (1) did not achieve CR but presented MRD-negativity (55.6%), (2) achieved CR with MRD-positivity (20.0%), and (3) did not achieve CR with MRD-positivity (33.3%) (p=0.134) (Fig. 4). Moreover, we compared the survival outcomes according to changes in the frequency of dominant clones with consolidation therapy. Nineteen patients had a reduced frequency of dominant clones, whereas nine presented expanded frequency after treatment. Although the 3-year OS did not show meaningful results (94.1% vs. 72.9%, p=0.226), patients who presented a reduced frequency of dominant clones after consolidation therapy showed a tendency toward improved 3-year PFS (56.0% vs. 16.7%, p=0.054) (S5 Fig.). To assess the clinical importance of MRD, we performed multivariate Cox analyses for OS and PFS. MRD-positivity was significantly associated with poor PFS (hazard ratio [HR], 5.999; 95% confidence interval, 1.420 to 25.349; p=0.015) after adjustment for pre- and post-consolidation response status (Table 3).
During follow-up, 22 patients started the next treatment, with a median time to the next treatment of 34.9 months. Of these, 11 patients received carfilzomib-based therapy, and seven were treated with a bortezomib-based regimen.
4. Skeletal events and bone-related markers
Skeletal-related events, including new pathologic fracture, spinal cord compression, skeletal-related surgery, and radiation therapy of skeletal lesions, were observed during the study period among 41 available patients. The cumulative incidence of skeletal-related events was 16.3% within 3 years after completion of consolidation therapy (S6 Fig.). During this period, five skeletal-related events occurred, including two skeleton-related surgeries, one new pathologic fracture, one spinal cord compression, and one radiation therapy.
Additionally, we compared bone density before and after consolidation therapy. According to World Health Organization criteria (osteoporosis: ≥ 2.5 standard deviations of bone density T-score below the mean of a young adult reference population; and osteopenia: 1–2.5 standard deviations below the mean of a young adult reference population), 11 of 29 available patients (37.9%) showed osteoporosis before consolidation therapy, whereas only four (20.0%) had osteoporosis after the completion of consolidation therapy (p=0.050) (Table 4) [16]. The median bone density before consolidation therapy was −1.8 (n=29), which significantly improved to −1.3 (n=20) after consolidation therapy (p=0.044). Furthermore, a comparison of bone-related markers, including bone-specific alkaline phosphatase (ALP), osteocalcin, and N-terminal cross-linking telopeptide of type I collagen (NTX), before and after consolidation therapy revealed significantly decreased levels of bone-specific ALP (p < 0.001) and NTX (p=0.001).
5. Evaluation of neuropathy and pain response
We assessed the degrees of neuropathy and pain response using the Functional Assessment of Cancer Therapy/Gynecologic Oncology Group-Neurotoxicity (FACT-GOG/NTX) and the numeric rating scale (NRS) during and after consolidation therapy to evaluate the quality of life. Table 5 presents the neuropathy and pain-response results, which revealed no significant increase in neuropathy levels during and after consolidation therapy. Additionally, the degree of pain showed a tendency toward slight improvement after consolidation therapy.
6. Treatment exposure and safety
Thirty patients received the planned therapy sequence without dose modification or changes to the treatment schedule. Ten patients were required to skip the planned drug administration, with the most common reason being hematologic adverse events, such as neutropenia (n=5) and thrombocytopenia (n=2), whereas three patients skipped due to elevated transaminase levels and occurrences of rectal fistula and herpes zoster infection, respectively. Patients with rectal fistula stopped all planned administrations after the 3rd week of the 2nd cycle, at which point bortezomib had been administered seven times, whereas the other patients received at least 11 doses of bortezomib. Dose reduction was required in five patients, three of whom received a reduced dose of bortezomib due to grade 2 peripheral neuropathy (n=2) and elevated transaminase levels (n=1). Delayed administration occurred in seven patients, with neutropenia being the most common reason (n=3), and others included peripheral neuropathy, herpes zoster infection, and increased transaminase levels.
All treated patients were graded for toxicity, which was evaluated according to the National Cancer Institute Common Terminology Criteria for Adverse Events (v4.03). Overall, the most common adverse events were peripheral neuropathy and infection, which occurred in nine patients (20.5%) separately; however, most cases were grade 1 or 2, and no patient had grade ≥ 3 neuropathy (Table 6). The most common grade ≥ 3 hematologic toxicity was neutropenia (11.4%), followed by thrombocytopenia (6.8%). Other toxicities, such as gastrointestinal and hepatobiliary adverse events, were reported in a relatively small number of patients and were mostly restricted to grade 1 or 2.
Discussion
In this study, 45 patients who achieved PR or VGPR after ASCT were treated with three cycles of consolidation therapy comprising CVD. The results showed that CVD consolidation immediately increased the quality of response status in almost 50% of enrolled patients at the end of treatment. Additionally, further improvement was observed during the follow-up period, with 45.2% of available patients achieving CR or better after completion of CVD consolidation therapy. Survival rates at 3 years were 89.0% (OS) and 42.7% (PFS), and the toxicity profile was acceptable, with most non-hematologic adverse events, including neuropathy, being grade 1 or 2.
MM is incurable, and disease relapse is usually inevitable in most patients, even with the development of diverse therapeutic strategies, such as the introduction of novel agents and ASCT. In this respect, emphasis should be placed on decreasing the disease burden in order to prolong survival outcomes and delay relapse in patients who have residual disease after ASCT following induction therapy, given the significant association between achieving optimal response status and survival outcomes [17]. Consolidation chemotherapy has been investigated to improve the depth of response with a relatively short duration of treatment. Bortezomib-based consolidation therapy has been used in several previous studies. Ladetto et al. [9] performed four cycles of consolidation therapy comprising VTD in 39 patients who achieved at least VGPR, with the results showing increases in the CR rate from 15% to 49%. The Nordic Myeloma Study Group conducted a randomized trial in which 20 doses of bortezomib were administered for 21 weeks after ASCT [18]. In that study, the rate of VGPR or better increased from 40% to 70% in bortezomib-treated patients, which was significantly higher than that in the control group (from 39% to 57%). Moreover, they reported a significantly higher median PFS in the bortezomib group (27 months) relative to the control group (20 months), although there was no difference in OS. In the phase 3 GIMEMA-MMY-3006 trial, a comparison of two cycles of VTD with TD after double ASCT revealed increases in the CR rate from 49% to 61% and from 40% to 47%, respectively, along with significantly improved survival outcomes [19]. Another group performed a phase II study involving the administration of two cycles of lenalidomide, bortezomib, and dexamethasone (VRD) to 31 patients, which resulted in slight improvements in the CR rate from 47% to 50% after consolidation therapy [6]. In the phase III PETHEMA/GEM2012 study, two cycles of VRD conducted after VRD induction and ASCT increased the CR rate from 44% to 50% due to the consolidation therapy [20]. Furthermore, the clinical benefit of VRD consolidation therapy was demonstrated in the EMN02/HO95 study, in which the second randomization was performed after single or double ASCT or bortezomib, melphalan, and prednisone therapy [21]. Two cycles of VRD consolidation were administered to 449 patients, with the consolidation group showing significantly improved PFS relative to the group not receiving consolidation therapy (n=428; 58.9 months vs. 45.5 months, p=0.014). However, in the Blood and Marrow Transplant Clinical Trials Network 0702 phase III trial, in which 18% of patients had CR and 29% had high-risk disease at enrollment, four cycles of VRD consolidation therapy after ASCT showed no clinical benefit relative to single or double ASCT alone [22]. All patients in that study received lenalidomide maintenance, and the 38-month PFS in the consolidation group was 57.8%.
As previously noted, the clinical benefits of bortezomib-based consolidation therapy remain unclear. Zhang et al. [23] performed a meta-analysis, which revealed that bortezomib-based maintenance therapy showed significantly improved outcomes for both OS and PFS, whereas bortezomib-based consolidation therapy revealed clinical benefits only for PFS (HR, 0.77; p < 0.001) but not OS (HR, 0.98; p=0.870). Additionally, bortezomib-based regimens showed a trend toward an increased risk of adverse events, such as neurological symptoms and fatigue. In the present study, we included patients with residual tumor burden after ASCT who were expected to show inferior survival outcomes relative to patients with CR or better. Notably, this represents the first study applying these inclusion criteria, further suggesting its importance, given that a considerable number of patients experienced improved response status without considerable adverse events [17]. Overall, the results showed that consolidation therapy offered clinical benefits to patients with a relatively high risk of disease progression after ASCT. There were seven patients whose response status improved after the end of consolidation therapy; they showed significantly better clinical outcomes compared to others. This could be attributed to the half-life of the monoclonal antibodies (average 21–25 days for IgG and 7–14 days for IgA); this could cause a time lag between tumor status and the detected response status [24]. In addition, the biological differences between the tumor clones could have influeced the outcomes. The early responders possibly had an early resistance and relapse. The late responders to initial therapy (> 120 days) have a longer survival compared to early responder, when more than half of patients are treated with proteasome inhibitor-based therapy [25]. Therefore, our results are not contradictory, but rather closely in correspondence with the intrinsic characteristics of MM.
Bone lesions are an important hallmark of MM and usually persist even after achieving CR. This study revealed that bone density significantly improved with consolidation therapy, and that the rate of patients with osteoporosis receiving this therapy decreased by almost 50%. These results agree with a previous study reporting correlations between improved bone density and decreased tumor burden [26]. Additionally, both bone-formation and bone-resorption markers decreased with consolidation therapy, which might reflect the stabilization of the elevated activity of the bone dynamics of MM [27]. However, these results should be interpreted carefully. Some previous studies reported increased levels of ALP and osteocalcin following bortezomib-based treatment [28,29]. In addition, the effect of consolidation therapy on bone markers is heterogeneous, which may be due to the concomitant use of steroids and bisphosphonates. Another study in which TD was administered as induction therapy identified decreased levels of bone-formation markers, including ALP and osteocalcin [30]. Furthermore, in the present study, we found that the cumulative incidence of skeletal-related events was low in the study population. Further studies are warranted to assess the role of consolidation therapy in improving bone-related mechanisms that negatively affect the quality of life of patients with MM.
To the best of our knowledge, this study is the first to investigate the efficacy and toxicity of CVD consolidation therapy. The CVD regimen showed compatible efficacy along with a relatively tolerable toxicity profile. In particular, there was no grade ≥ 3 neurotoxicity in the study population, which might be due to the composition of the regimen and the relatively short duration of the consolidation treatment. Additionally, the results demonstrated tolerability in terms of the scale of neurotoxicity (FACT-GOG/NTX) and pain response (NRS). The strength of this study might be that we included patients with residual disease, even after ASCT. Moreover, this study has practical significance, as we suggest a post-ASCT treatment option for patients who are expected to have a relatively high risk of early progression after ASCT.
We also assessed the value of MRD status with CVD consolidation therapy. MRD-negativity, defined according to changes in dominant clones during consolidation therapy, showed meaningful results in the patients. Additionally, the results for MRD status were significant relative to the post-consolidation response status. Although there were limitations in defining clonal assessment owing to the lack of initial samples at diagnosis, the results showed that MRD assessment would be valuable with CVD consolidation. This study enrolled a considerable number of patients initially treated with a doublet regimen, currently largely substituted by a triplet or quadruple regimen. Although we found no meaningful difference according to the induction regimens in our patients, the role of CVD consolidation therapy with newly adapted induction regimens warrants further investigation.
In conclusion, three cycles of CVD consolidation therapy in patients presenting with VGPR or PR after ASCT showed an improved response status and comparable survival results with acceptable toxicity profiles.