Introduction
Approximately half of all cancer survivors are of working age [1], but 26%–53% cancer survivors lose or quit their jobs [2,3]. Since return to work (RTW) is associated with higher self-esteem, a sense of normalcy, and improved quality of life and financial situation [4–6], interventions have been developed and implemented in the past two decades to facilitate this. However, small or no effects were shown in previous RTW trials [7,8].
While 40% of cancer patients who quit their job after cancer decided to quit before receiving initial treatment [9], most studies have included cancer survivors who have completed treatment [7,8]. There were two intervention studies that provided support to patients from diagnosis [10,11], but they were limited to provide either psycho-social support or symptom management. Furthermore, while fear of cancer reucrrence, meaning of work and stigma associated with cancer and cancer patients [12] was associated with RTW [12–14], previous interventions did not tackle these issues. According to an observation study, survivors with stigma on impossibility of recovery and stereotypes were 3.10 (95% confidence interval [CI], 1.76 to 5.44) and 2.10 (95% CI, 1.20 to 3.67) times more likely to lose a job than survivors without cancer stigma [12]. Thus, a more comprehensive approach should be considered from immediately after diagnosis to after treatment to keep their jobs after being diagnosed with cancer covering physical, psycho-social and practical issues related to RTW.
Base on qualitative and quantitative studies [14,15], we developed a RTW intervention for patients newly diagnosed with different cancers: the Self-assessment, TAilored information, and lifestyle management for Returning To work among cancer patients (START) and evaluated its efficacy in terms of RTW.
Materials and Methods
1. Trial design and participants
This study was a multi-center randomized controlled trial to evaluate the efficacy of an individually tailored RTW intervention conducted at two university-based cancer centers in Seoul and Suwon, Korea from October 2018 to February 2020 (Clinical Research Information Service, CRIS: KCT0003262).
Study participation was restricted to patients: (1) aged 20–69 years; (2) working at the time of diagnosis; (3) who had received or had plans to receive active curative treatment, such as surgery, adjuvant chemotherapy, or radiation therapy; and (4) who understood and accepted the study contents. We also included patients who had discontinued their work—for example, due to the closure of a privately-owned business or sick leave—within 1 month of diagnosis. We excluded patients who had specific plans to retire or discontinue owning a business within the next 1 year, and who could not speak and read Korean. We also excluded those whose primary treatment was expected to last more than eight months considering the overall study period. Patients were recruited via recruitment posters on hospital bulletin boards or referrals from treating oncologists. Trained researchers explained the purpose of study and confirmed eligibility of the study participants, all of whom provided written informed consent. An independent monitoring committee reviewed accumulating safety data throughout the trial.
2. Intervention
The START program was developed based on the results of a qualitative study [14], network analyses of online cancer communities [16], and a quantitative survey [17] by the study team, as well as literature review. As more than half of all cancer patients stop working before treatment begins [12], we decided to intervene for newly diagnosed patients. Additionally, as most patients focus on treatment and have limited time and physical energy during treatment, we included the active RTW intervention component after completion of treatment. In fact, the START program comprised three components provided at different times: (1) educational material (a leaflet and 5-minute video clip) at diagnosis (enrollment); (2) a face-to-face educational session at completion of active treatment; and (3) three individualized telephonic counseling sessions after the face-to-face one.
At enrollment, intervention group members received a three-fold leaflet and were shown a 5-minute video clip on a tablet device to provide information about misconceptions related to cancer patients’ RTW. Upon completion of planned treatment, patients were asked to attend a face-to-face educational session with a trained oncology nurse. Next, the nurse guided them regarding self-assessment of the pros and cons of RTW, workload, work environment, and one’s physical and mental capabilities. Thereafter, patients received three weekly individual telephone counseling sessions conducted by the same nurse. Detailed contents of each component are described in our protocol [18].
3. Control group
Participants in the control group were provided with a booklet titled “Cancer and Nutrition” at enrollment. They did not receive any further guidance at follow up. Once the randomized controlled trial ended, copies of the educational material used for the intervention group were provided to patients in the control group.
4. Measurements
Data on outcomes were collected at three time points during the study: baseline (T0), at the end of intervention (T1), and 1-month post-intervention (T2). Baseline data (pre-test) collection occurred immediately following enrollment. Thereafter, the first follow-up data (T1) were collected at the end of the intervention for the intervention group and after completion of active treatment for the control group. The primary endpoint (T2) was collected at 1-month post-intervention for the intervention group and 2 months after the 1st follow-up for the control group. As the intervention was provided for a month, the time from diagnosis to T2 is similar between the intervention and the control group.
The primary outcome measure of the study was whether the patient had returned to work at T2. Patients were asked about their current employment status, that is, whether they: (1) were currently working; (2) were on sick leave or leave of absence (workplace temporarily closed, for self-employed patients); (3) were using vacation days; or (4) had resigned (workplace permanently closed, for self-employed patients). For those who reported that they were currently working, we considered them as patients who successfully returned to work. For those who were not currently working, we asked them whether they had plans to RTW, by asking: “Do you have specific plans to return to work?” If they answered “yes,” we asked specific planned dates to RTW. For those who did not have plans to RTW, we asked them to state their reasons for not having plans. For T2 assessment, both control and intervention groups were contacted by a blinded researcher via telephone.
For a secondary outcome, we assessed knowledge related to RTW using a questionnaire developed by the research team. To develop the questionnaire, a group of experts—two oncology nurses, two social scientists, two general physicians, and one epidemiologist—reviewed previous qualitative and quantitative literature and semi-structured interviews were conducted with 50 cancer patients about their knowledge of RTW [14]. The expert group developed 10 questions to evaluate common misunderstanding related to working with cancer. The total score ranged from 0 to 10.
Clinical information, including cancer type, stage, and adjuvant therapy type (chemotherapy, radiation therapy, targeted therapy, etc.) was obtained from the electronic medical record system. Demographic variables including marital status, education level, household income, type of job at diagnosis, and current working status were assessed at T0.
5. Randomization and blinding
Patients were randomized in a 1:1 ratio into intervention and control groups. Using a software (Sealed Envelope Ltd. 2017), an epidemiologist not involved in the study generated random blocks that were sized 2 or 4, and stratified the sample by hospital (Seoul or Suwon), type of cancer (breast, liver, lung, colon, or others), and type of job (white or blue collar).
Allocation information was sent in a sealed envelope by independent researchers to coordinators who were responsible for enrolling participants in the study. The envelope was not to be opened until the recruitment was completed. As the purpose of intervention is education, patients and investigators were not blinded during the trial. However, data analysts and investigators who observed patient outcomes at follow up were blinded.
6. Statistical analysis
The sample size for the trial was calculated to address the hypothesis that those in the intervention group were more likely to be compared to the control group. Based on results from a nationwide survey on cancer patients in Korea, we expected that approximately 40% of the control group and 60% of the intervention group would RTW after cancer [19]. To verify our hypotheses, chi-square tests, which assume 80% power and a two-sided α-level of 0.05, indicated that we should include 102 patients per arm. Expecting approximately 15% losses during follow-up, we increased the sample size to 120 patients per arm, for a total of 240 randomized participants.
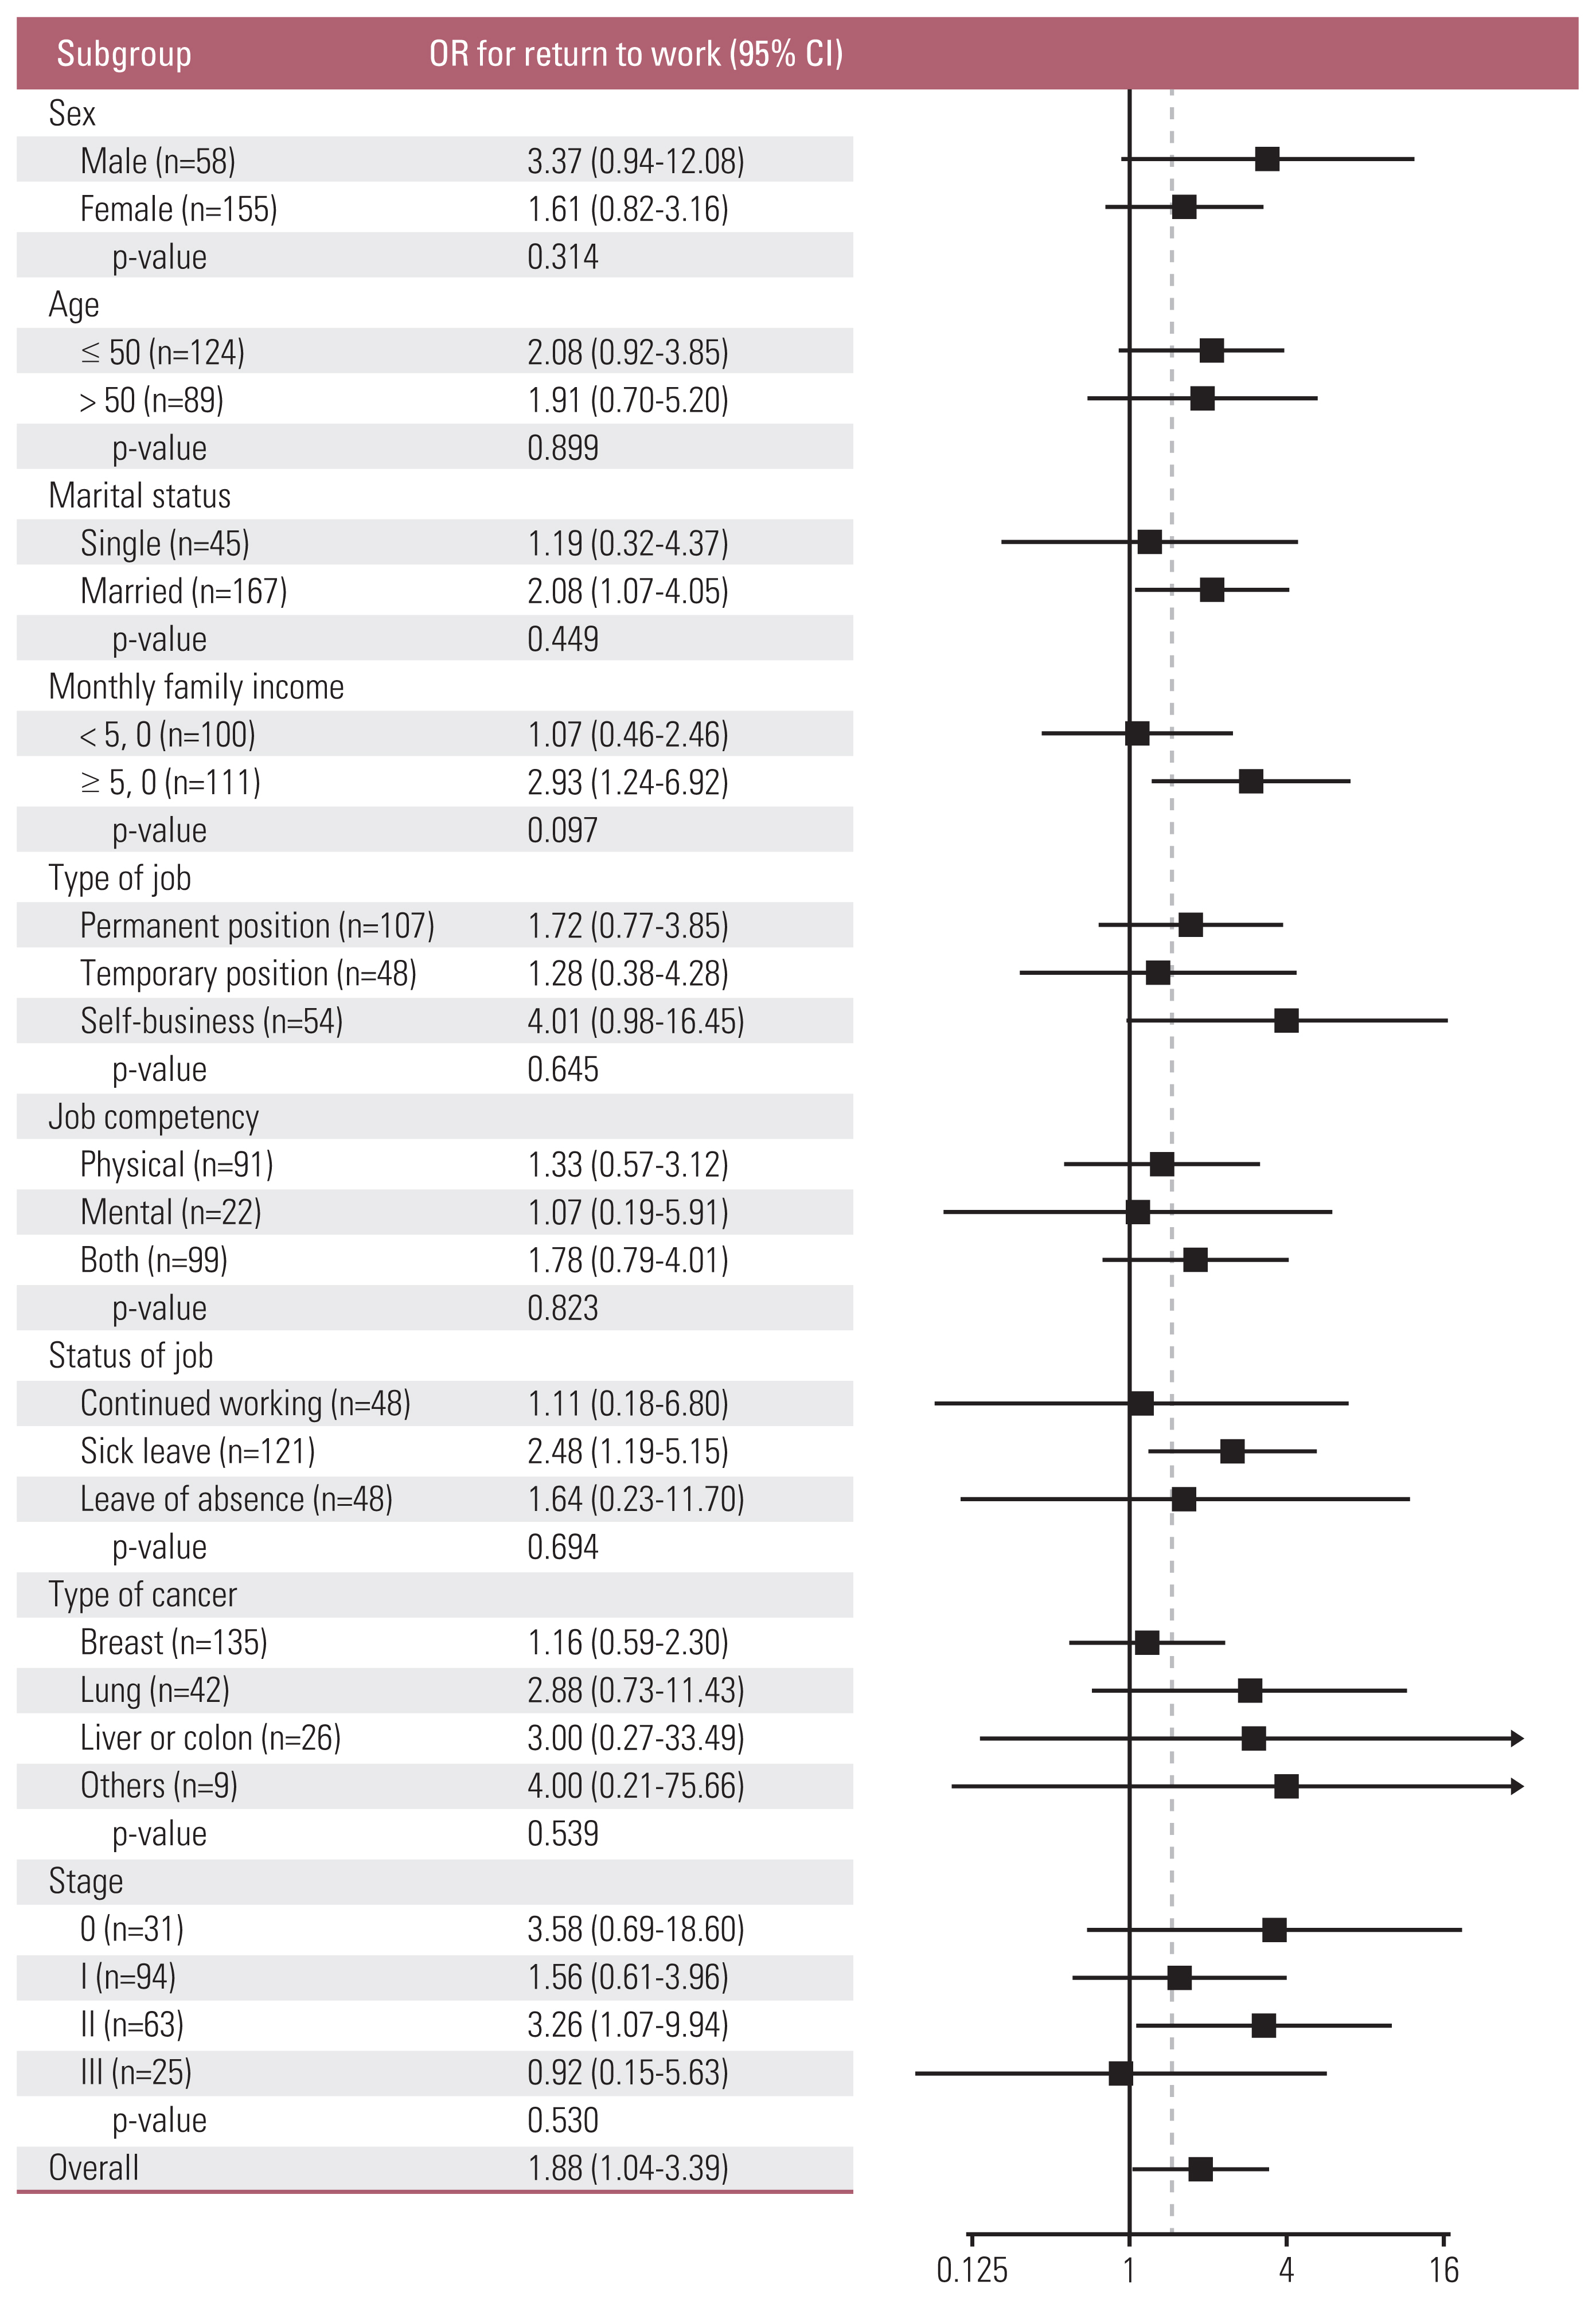
All analyses were performed using the intention-to-treat principle, as study patients were assigned to their randomized group irrespective of compliance with the study intervention. For the analysis of primary outcomes, we compared the proportion of participants who returned to work or had plans to RTW using chi-square tests. Additionally, we performed a subgroup analysis to confirm that the efficacy of intervention was consistent in terms of working status at diagnosis. We also explored the association of intervention with the proportion of RTW at T2 in relevant subgroups defined by age (≤ 50 and > 50), sex (male and female), marital status (single and married), monthly family income (< $5,000 and ≥ $5,000), type of job (permanent, temporary, and self-business), working status at baseline (working, sick leave, and leave of absence), job competency (physical, mental, and both), and stage (0, I, II, and III).
Missing data were replaced by last-observation-carried-forward—except primary and secondary outcomes. p-values of < 0.05 were considered statistically significant. All analyses were performed using STATA ver. 15.0 (StataCorp., College Station, TX).
Results
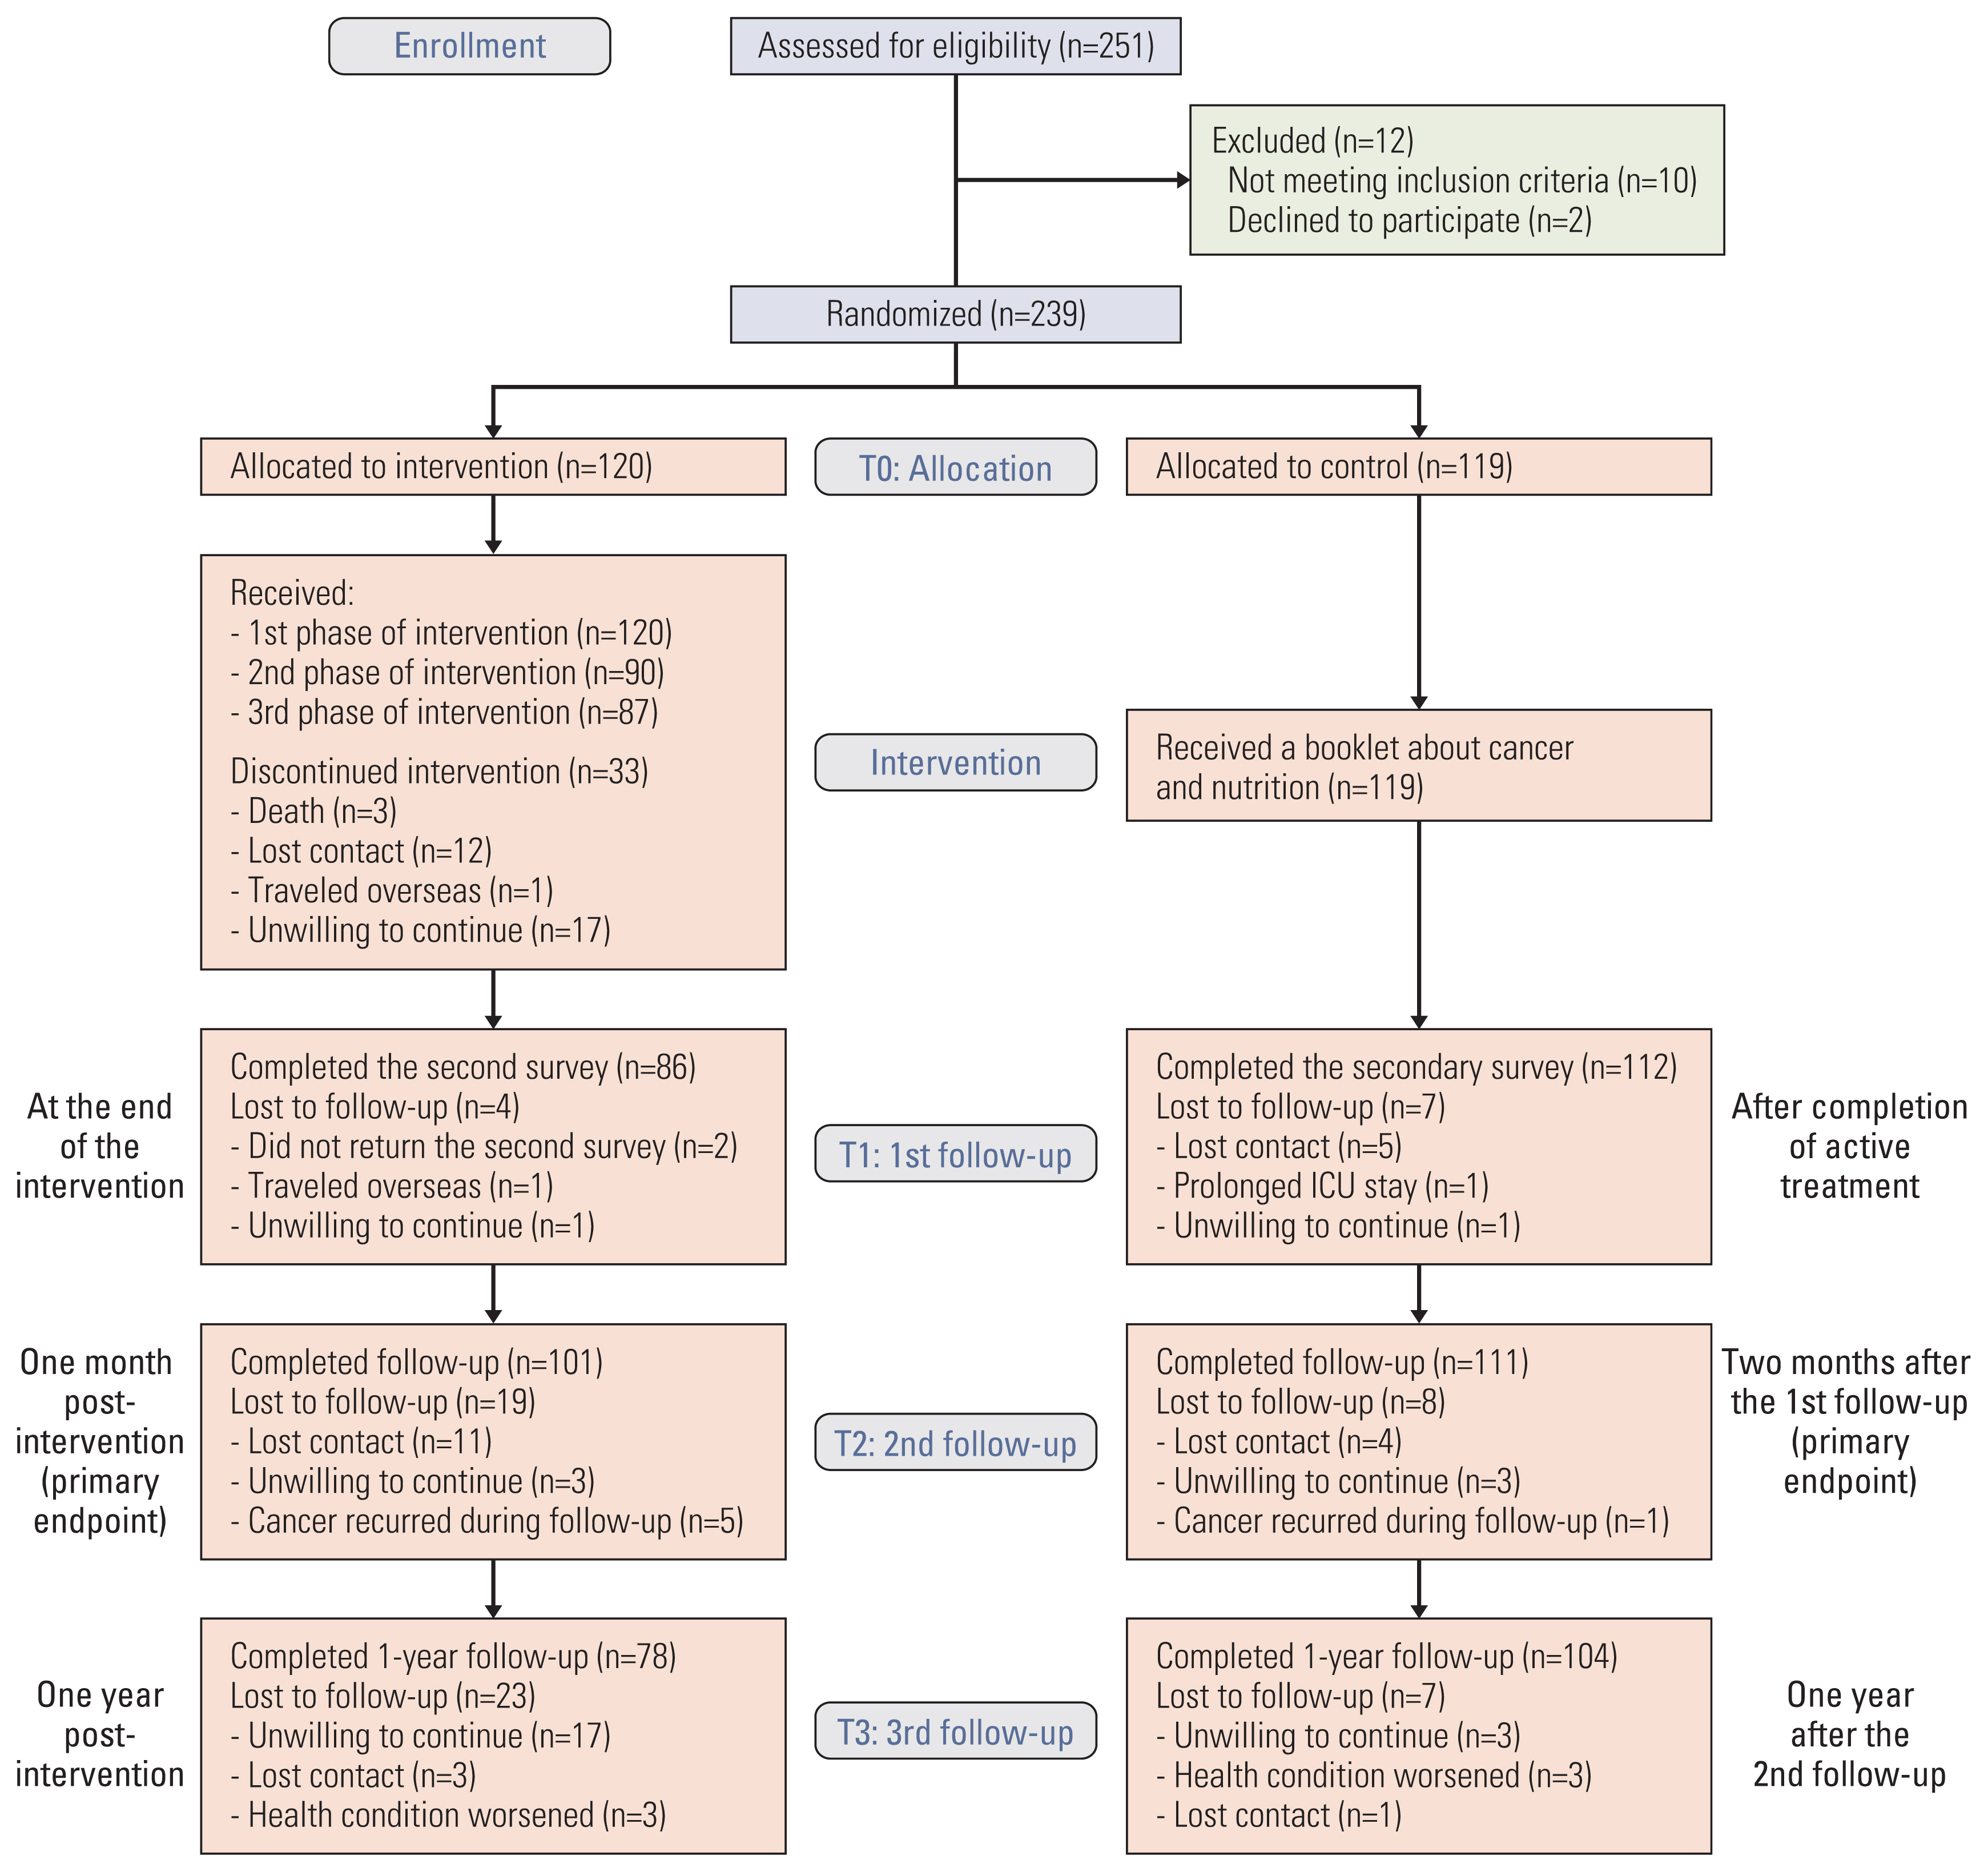
Out of a total of 251 patients, 239 patients (95%), who were initially eligible to participate, agreed to participate; they were randomly assigned to the START group (n=120) or control group (n=119). Among them, 11 and 27 patients lost to follow-up at T1 and T2, respectively. Therefore, 101 and 111 patients in the intervention and the control group, respectively, included in the analysis for the primary endpoint (Fig. 1). However, if we can contact the patients who participated in at least 1 survey, we obtained the response from them at T3.
The average age of the study participants was 49.5 years, and 29.7% were men. Patient characteristics were well-balanced in the two groups, except current working status (Table 1). The START group members were less likely to be currently working compared to their control group counterparts (START, 17.5% vs. control, 28.6%; p=0.042). The characteristics was similar with patient who included in the analysis at T2 (S1 Table).
At T1 (63.5% vs. 55.0%, p=0.060) and T2 (65.4% vs. 55.9%, p=0.037), the START group was more likely to be working than the control group after controlling working status at diagnosis (Fig. 2). Although the START group was more likely to have specific plans for returning to work compared to the control group, it was not statistically significant (Table 2).
The efficacy of intervention on RTW was statistically more significantly among patients who were not working at baseline compared to patients who were working at baseline (S2 Fig.). Regarding patients who did not work at baseline, the START group was 1.99-times more likely to be working at T1 (Table 2). In the subgroup analysis, there were no effect modifiers (Fig. 3).
The mean of knowledge score was higher in the START group compared to the control group (7.4 vs. 6.8, p=0.029) (Table 3). Especially, the START group had better understanding of the following statements compared to the control group: “It is impossible to work during cancer treatment” (79.8% vs. 62.4%, p=0.009); “Stress at workplace increases the risk of cancer recurrence” (44.7% vs. 26.6%, p=0.009); and “Cancer patients could return to a healthy state prior to diagnosis” (80.0% vs. 66.4%, p=0.035).
For the 1-year follow-up, six patients were excluded because of health deterioration; 186 patients were contacted, and 182 responded. Overall, the START group was 65% (95% CI, 0.78 to 3.48) more likely to have higher odds for having work compared to the control group at T3 (Table 4), but that was not statistically significant.
Discussion
An individually tailored RTW intervention that included self-assessment, personalized information, and lifestyle management education was effective in facilitating newly diagnosed cancer patients’ RTW after anti-cancer treatment completion. In addition, the intervention was effective to improve knowledge that reduce cancer stigma. The positive association between intervention and RTW was stronger in those who were not working, that is, had resigned from work after diagnosis, at baseline. Although statistically insignificant, the START program showed the positive signs for facilitating cancer patients’ RTW at 12 months post-intervention.
In our study, the RTW rates were higher in the START group compared to the control group and this might be possible because the intervention was provided at diagnosis before cancer patients decided not to work. Based on results from our preliminary qualitative interviews [14] and quantitative survey [17], many patients decided to stop working as soon as they suspected a diagnosis of cancer, even before it was confirmed. Furthermore, patients reported difficulties in re-employment at the end of treatment. Similarly, in previous studies, early intervention for RTW had shown to benefit patients’ RTW in various non-cancer populations by preventing premature resignation or prolonged sick leave [20,21]. Therefore, we provided a intervention at the time of diagnosis, hypothesizing that once we kept patients from giving up work as soon as they were diagnosed, the remaining parts of the intervention could be rolled out when the patient was ready to consider working again, such as at the end of the treatment; these strategies seemed to be effective.
The START intervention might be effective as it reduced the cancer stigma that would be associated with RTW. The START group had significantly better knowledge related to RTW compared to the control group. Especially, the intervention group had appropriate understanding about the impossibility of recovery, such as: “It is impossible to work during cancer treatment,” and “Cancer patients could return to a healthy state prior to diagnosis” which was highly associated lose a job [12]. Realizing misunderstandings about cancer would make patients consider RTW positively; they might participate in the intervention program more actively, resulting in higher RTW in the intervention group [12]. It is difficult to deliver work-related information to patients recently diagnosed with cancer as they are still coping with the shock and confusion. However, it is important to dispel misunderstandings about RTW before patients stop-working.
The START intervention might be also effective as it provides personalized intervention based on self-assessment. Vocational needs of cancer patients can vary depending on their job type, job environment, and health condition [22]. The diverse needs of each cancer patient cannot be addressed with a one-size-fits-all approach [23]. The self-assessment component of the START program would help patients to make specific RTW plans by evaluating their own work ability and work demands. An individually tailored intervention would encourage more patients to pursue RTW regardless of their occupation or health condition. Although this individualized approach would require more resources compared to general interventions, it could be more cost-effective in the long-term considering the economic burden from not returning to work after cancer including direct costs from the amount of paid occupational health care interventions by the social security agency and indirect costs from the additional costs of paid sickness benefit [24].
For the long-term effect, although it was statistically insignificant, patients in the START group were more likely to be working at 12 months after the intervention (START: 80.8% vs. control: 75.7%, p=0.188). Despite the lack of statistical power to detect difference between the two groups, both intervention and control of RTW percentage showed to be relatively high in comparison to the RTW percentage at 1 year after intervention. One possible explanation for this is improved awareness of the importance of work, even among the control group, because their mere inclusion in the study drew their attention to possible RTW problems because “work” attracted more overall social interest during the study period. In other words, our study itself might trigger thinking about RTW in patients at an early stage.
This study has several limitations that should be considered when interpreting the findings. First, approximately one-fourth of the patients in the intervention group received partial intervention. Fortunately, the study sample had enough power to prove the effects of the START intervention. However, development of an online education program that patients can access irrespective of time and place is desirable. Second, there was imbalance between the intervention and control groups regarding working status at baseline. However, results of a subgroup analysis in patients without work at baseline were stronger than for patients with work at baseline. Therefore, further studies with larger samples would be necessary to confirm the findings of our study among patients who belong to the high-risk group. Finally, this study was conducted in an institution in Korea; therefore, the results cannot be generalized.
In conclusion, an individualized, comprehensive intervention providing personalized information and practical support at each critical time point was effective in facilitating cancer patients’ RTW. Further study with a larger sample in a different setting is necessary. Additionally, developing digital intervention using advanced technology is desirable.