Introduction
Extranodal natural killer/T-cell lymphoma (ENKTL) is a rare subtype of mature T/natural killer (NK) cell lymphoma characterized by a strong association with Epstein-Barr virus (EBV) infection and a predominant involvement pattern of the nasal cavity and nasopharynx [1]. Another unique feature of ENKTL is its high incidence in East Asia and Latin America relative to Europe and North America, probably due to geographic differences in EBV type and genetic susceptibility [2].
The introduction of non-anthracycline–based chemotherapy including L-asparaginase has markedly improved the survival outcome of ENKTL patients, and it is currently used as standard frontline therapy [3,4]. However, substantial numbers of patients experience disease progression or relapse despite non-anthracycline–based chemotherapy, and the prognosis of these patients is dismal, with a median overall survival (OS) of approximately 6 months [5]. Thus, identifying patients with poor prognosis is essential, which may provide opportunities to optimize the treatment strategies for these patients. Recently, a Prognostic Index for Natural Killer Lymphoma (PINK) model was proposed, and it has been widely accepted as a useful prognostic model for ENKTL patients who were treated with non-anthracycline–based therapy [6].
β-2 microglobulin (β2M) is a low molecular weight protein that is a component of the major histocompatibility complex class I antigen, and it can be seen on most nucleated cells [7]. It is well-known as a poor prognostic factor in numerous lymphoproliferative disorders [8], including ENKTL [9,10]. However, despite this prognostic implication of serum β2M, serum β2M was not evaluated as a prognostic factor when developing the PINK model. Thus, the prognostic value of adding the serum β2M level to PINK remains a question of interest. In this study, we aimed to investigate the prognostic implications of serum β2M in patients with ENKTL treated with non-anthracycline–based chemotherapy. In addition, we evaluated whether the addition of serum β2M to PINK may better stratify patients into homogeneous survival subgroups.
Materials and Methods
1. Study patients
Between February 2003 and June 2018, 211 patients who were newly diagnosed with ENKTL were identified in the database of the Asan lymphoma Registry, Asan Medical Center, Seoul, South Korea. The diagnosis was confirmed by an experienced pathologist according to the World Health Organization classification [11]. To focus on the prognostic implications of serum β2M in patients who were treated with non-anthracycline–based chemotherapy, we excluded patients whose serum β2M level was not available at the time of diagnosis (n=40), who had been treated with anthracycline-based chemotherapy (n=40), or who did not receive any anti-cancer treatment (n=12). As a result, a total of 138 patients were included in the analysis as a training cohort. We retrospectively reviewed the medical records of the included patients and collected data including age, sex, Eastern Cooperative Oncology Group (ECOG) performance status (PS), the sites of disease involvement, treatment pattern, and survival outcomes. Ann Arbor staging was used for disease staging. The nasal and non-nasal types were categorized based on the involvement of the nasal area, including the nasal cavity, nasopharynx, paranasal sinuses, tonsils, hypopharynx, and larynx. Lymph node (LN) involvement was subdivided as regional or distant involvement. Regional LN involvement was defined as invasion of the LN region corresponding to the primary lesion and distant LN involvement was defined as involvement beyond regional LN. The independent validation cohort was recruited from the Samsung Medical Center, Seoul, South Korea. The inclusion and exclusion criteria were the same as the training cohort, and a total of 88 patients were included as a validation cohort.
2. Measurement of serum β2M
A radioimmunoassay kit (Immunotech, Inc., Prague, Czech Republic) was used to measure serum β2M in both the training and validation cohort (reference range, 1.0 to 2.4 mg/L). β2M was measured as follows. Serum samples were collected in tubes with EDTA and separated from cells by centrifugation within 3 hours after collection. Then, the serum sample, 50 μL of the calibrator and 500 μL of tracer (148 kBq 125I-labeled β2M in buffer with bovine serum albumin, sodium azide [< 0.1%], and a dye) were sequentially added to anti-β2M monoclonal antibody-coated tubes and mixed. Then, incubation was carried out for 90 minutes at 18–25°C with shaking (> 280 rpm). After incubation, the supernatants were discarded, and the bound radioactivity of the precipitates was determined using a gamma counter. A standard curve was constructed and the serum β2M levels were measured from the curve by interpolation [12].
3. Classification of risk groups based on PINK
PINK is based on four risk factors: age greater than 60, Ann Arbor stage III or IV, involvement of distant LN, and non-nasal type. Low-, intermediate-, and high-risk groups were classified according to the sum of the number of risk factors (0, low risk; 1, intermediate risk; 2/3/4, high risk) [6].
4. Statistical analysis
A chi-square test or Fisher exact test was used to analyze the correlation between categorical variables. OS was defined as the time from the date of diagnosis to death from any cause. Progression-free survival (PFS) was defined as the time from the diagnosis to the date of disease progression or death, whichever occurred first. OS and PFS were estimated by the Kaplan-Meier method, and the log-rank test was used to compare the OS or PFS between the risk groups. To determine the optimal cut-off value for serum β2M to most accurately predict the OS outcomes, the maximal chi-square method was used [13]. Univariate analysis and multivariate analysis of OS and PFS were performed using a Cox proportional hazards model. In univariate analysis, sex, ECOG PS, age, Ann Arbor stage, nodal involvement status, nasal involvement status, serum lactate dehydrogenase (LDH), and serum β2M levels were included. In the multivariate analysis, variables exhibiting a potential association with survival (p < 0.2) in the univariate analysis were included, and a backward elimination strategy was applied. To compare the performance of the prognostic models, we used Harrel’s concordance index (C-index) and Akaike’s Information Criterion (AIC). A p-value less than 0.05 was regarded as statistically significant in all analyses. All analyses were carried out with statistical software package R ver. 4.0.5 (R foundation for statistical Computing, Vienna, Austria).
Results
1. Baseline characteristics of the included patients
The baseline characteristics of the patients in the training cohort (n=138) are described in Table 1. The median age was 53.5 years (range, 19 to 80 years) and 86 patients (62.3%) were male. Most of the patients had a good PS (ECOG PS 0 or 1, n=93) and nasal type disease (n=114, 82.6%). According to PINK, 57 (41.3%), 37 (26.8%), and 44 (31.9%) patients were classified as low-, intermediate-, and high-risk groups, respectively. The most commonly used chemotherapy regimen was VIDL (etoposide, ifosfamide, dexamethasone, and L-asparaginase) (n=67, 48.5%), followed by SMILE (corticosteroid, methotrexate, ifosfamide, L-asparaginase, and etoposide) (n=35, 25.3%) and VIPD (etoposide, ifosfamide, cisplatin, dexamethasone) (n=15, 10.8%).
2. Characteristics based on serum β2M levels
The cut-off value of serum β2M was determined as 4.1 mg/L using the maximal chi-square method, and the baseline characteristics of the patients with high (≥ 4.1 mg/L, n=26) and low (< 4.1 mg/L, n=112) serum β2M were compared. The proportions of patients with ECOG PS 2–4 (23.1% of 26, p=0.001), stage III or IV (61.5% of 26, p=0.001), distant LN involvement (65.4% of 26, p < 0.001), bone marrow involvement (26.9% of 26, p=0.006), and elevated serum LDH (92.3%, p < 0.001) were significantly higher in the high-serum β2M group compared to the low-serum β2M group. In the low serum β2M group, more patients received concurrent chemo-radiotherapy (n=75) compared with the high-serum β2M group (n=7) (p < 0.001).
3. Survival outcomes and factors associated with OS and PFS
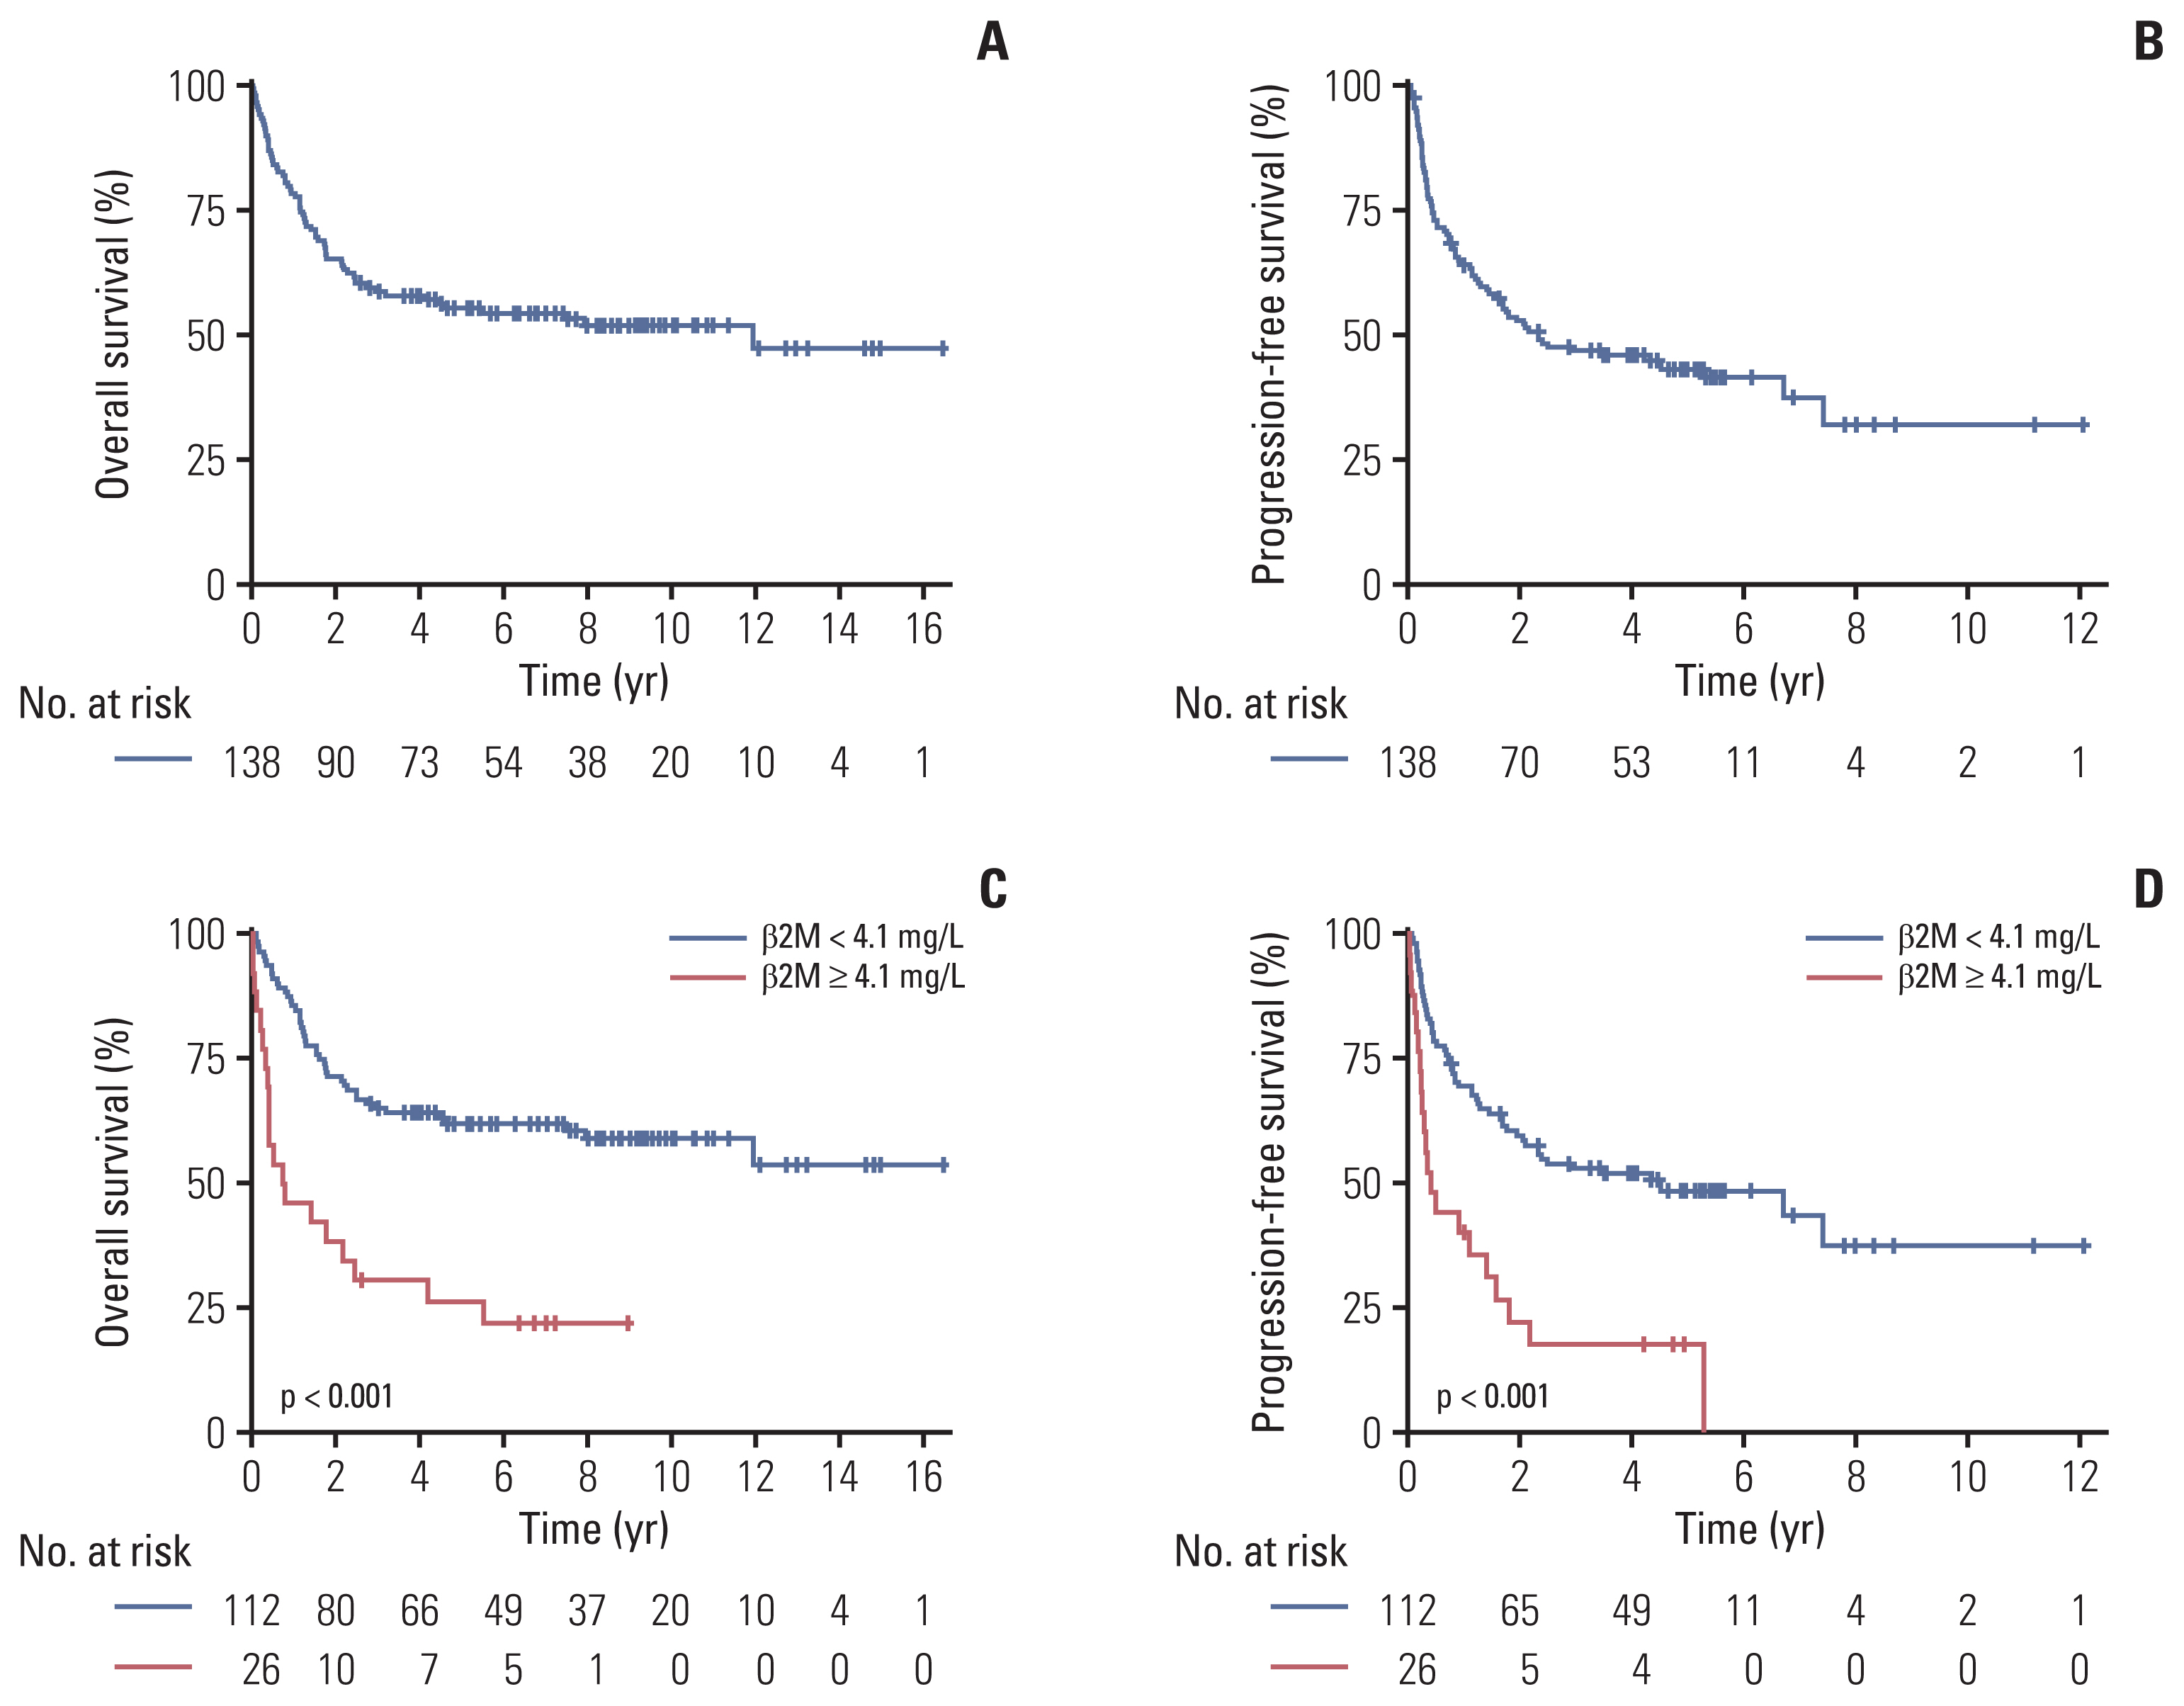
With a median follow-up duration of 8.0 years among the surviving patients (range, 2.5 to 16.4), the median OS and PFS in entire patients were 11.95 years (95% confidence interval [CI], 4.17 to not available [NA]) and 2.32 years (95% CI, 1.57 to 7.41), respectively (Fig. 1A and B). Patients in the high serum β2M group showed significantly poor OS and PFS than those in the lower serum β2M group (p < 0.001 for both) (Fig. 1C and D).
Table 2 summarizes the results of the univariate and multivariate analyses of the potential prognostic factors for OS and PFS. In the multivariate analysis, a high serum β2M level was independently associated with both poor OS and PFS (vs. low; hazard ratio for OS [HR], 2.87 [95% CI, 1.58 to 5.21], p < 0.001; HR for PFS, 2.16 [95% CI, 1.28 to 3.66], p=0.003) (Table 2). Other variables that showed an independent association with a worse OS were age ≥ 60 (vs. < 60; HR, 1.87 [95% CI, 1.10 to 3.18], p=0.019), Ann Arbor stage III or IV (vs. I or II; HR, 5.69 [95% CI, 2.88 to 11.22], p < 0.001), and non-nasal type (vs. nasal type; HR, 3.13 [95% CI, 1.56 to 6.28], p=0.001). Sex, ECOG PS, serum LDH, involvement of distant LN, and the status of B symptoms were not associated with OS. In the multivariate analysis for PFS, Ann Arbor stage III–IV (vs. I or II; HR, 2.93 [95% CI, 1.83 to 4.70], p < 0.001) and non-nasal type (HR, 2.14 [95% CI, 1.26 to 3.65], p=0.004) were independent adverse prognostic factors for inferior PFS in addition to high serum β2M.
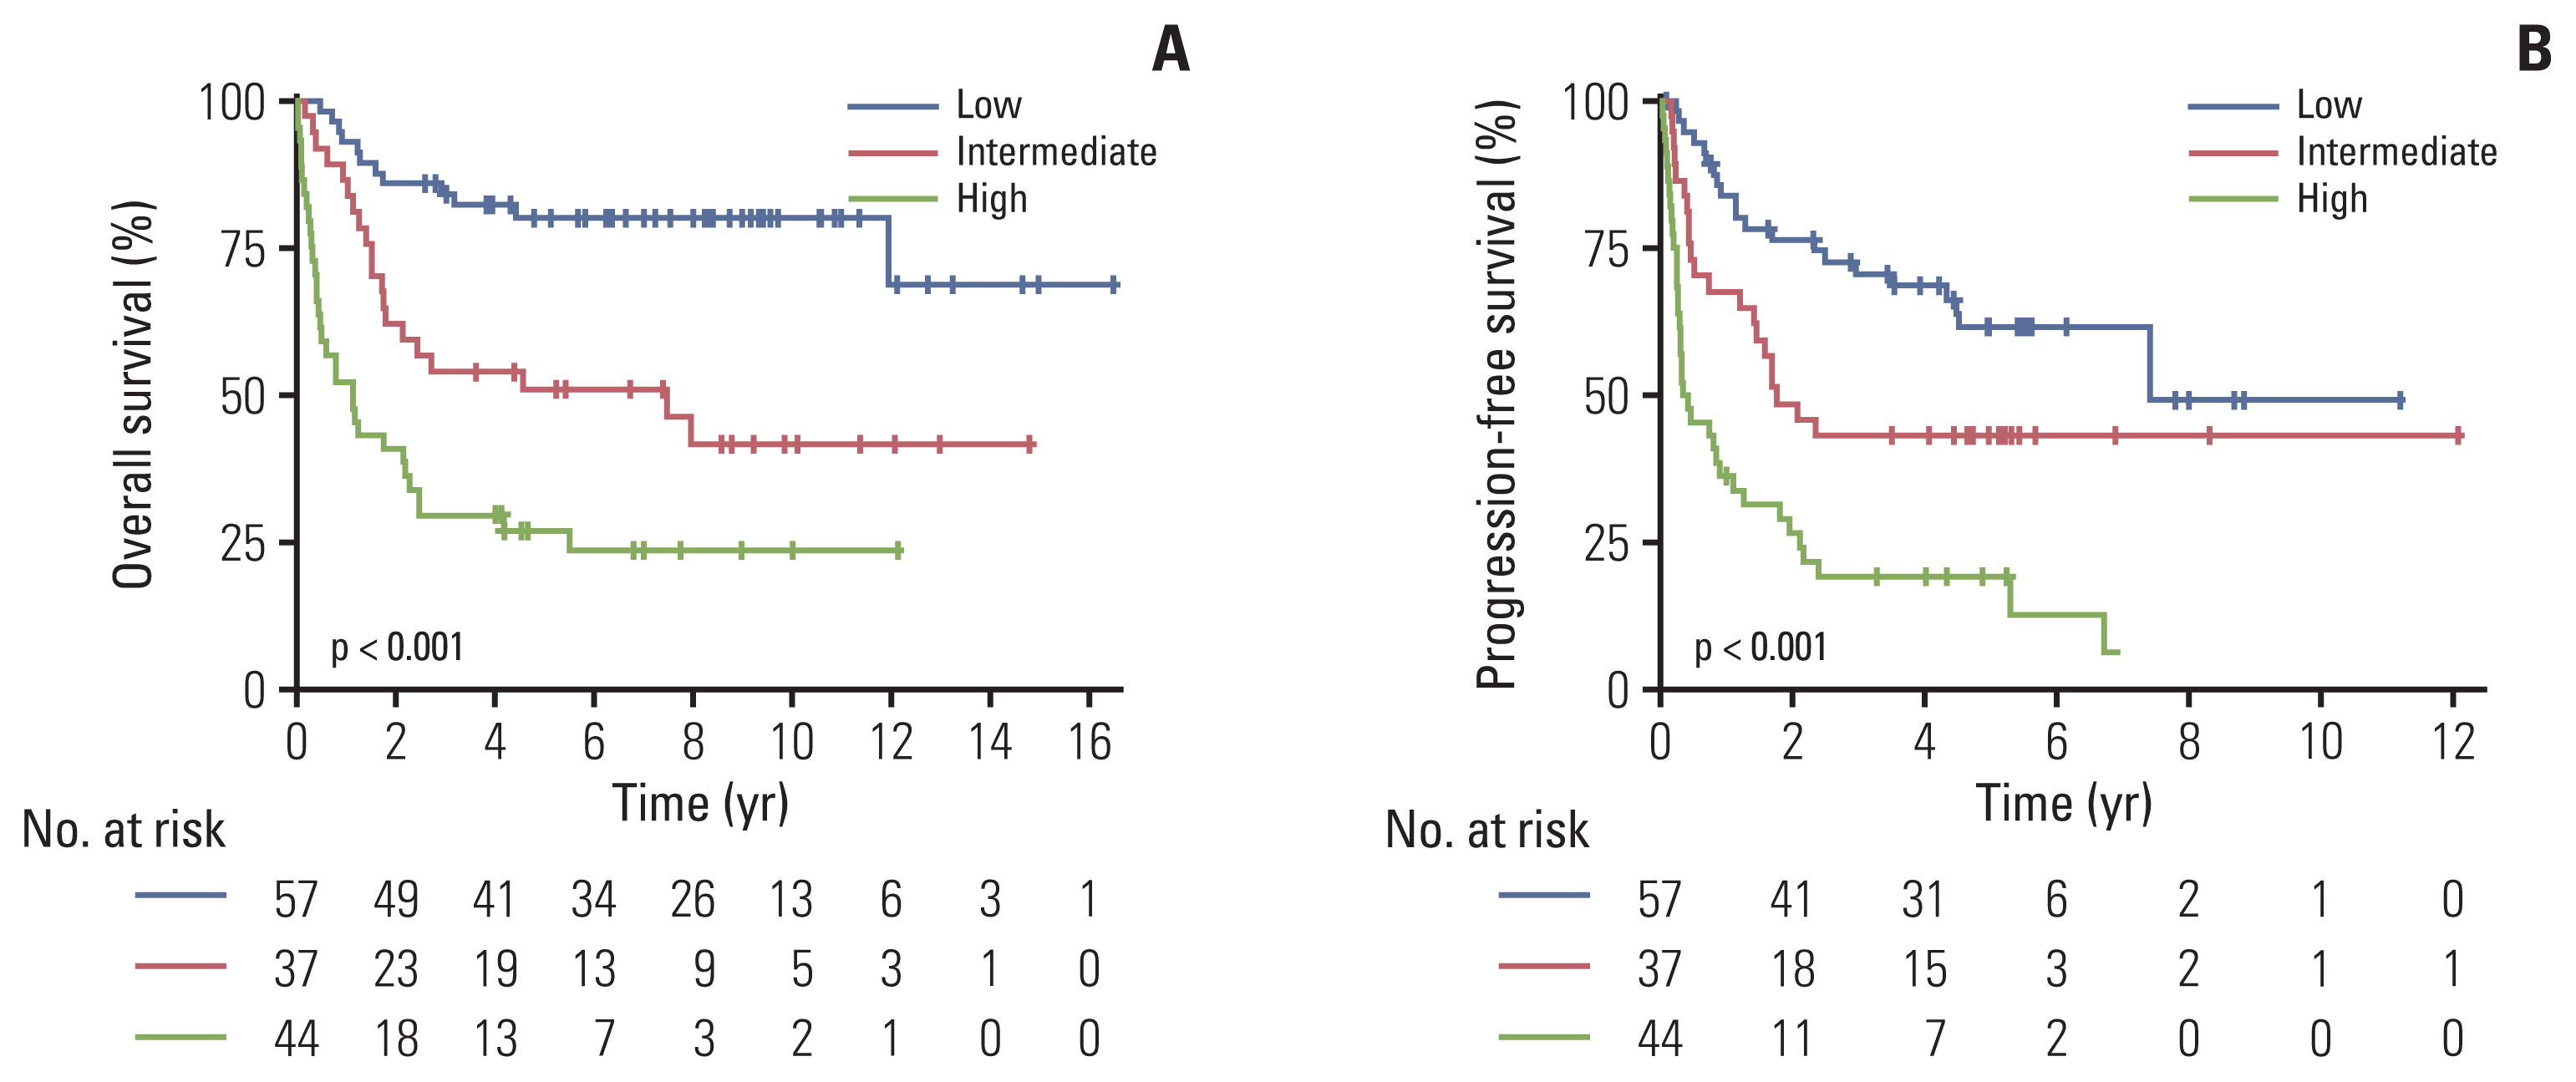
4. Prognostic value of serum β2M levels in the risk groups determined by the PINK model
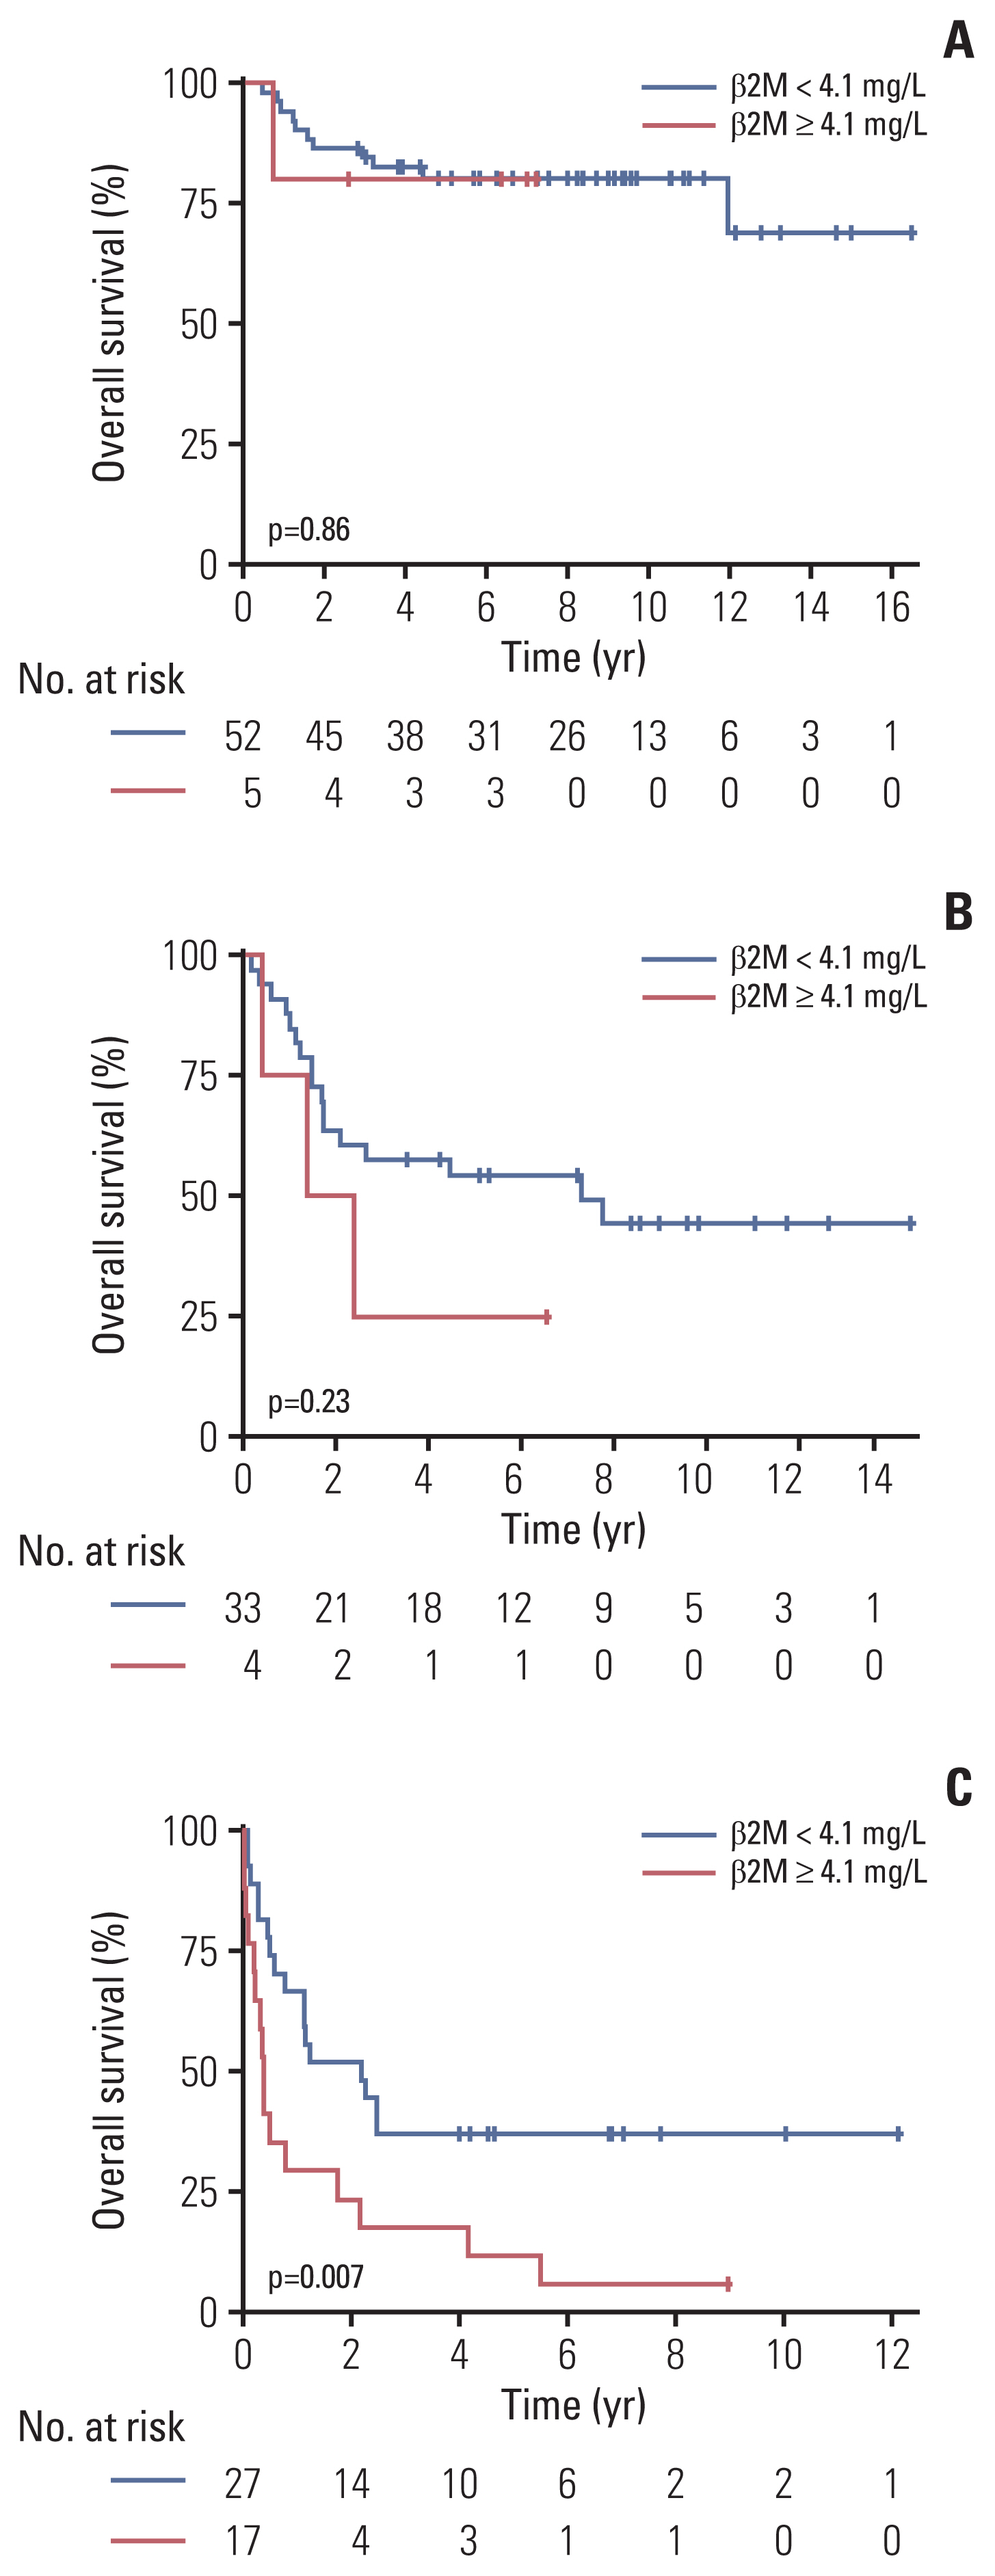
Fig. 2 shows the OS and PFS curves of the training cohort according to PINK. The PINK model could stratify patients into subgroups with different OS (Fig. 2A) and PFS (Fig. 2B) in the training cohort (p < 0.001 for both). We performed a subgroup analysis in risk groups determined by PINK according to the serum β2M level. In the training cohort, 19.2% (n=5), 15.4% (n=4) and 65.4% (n=17) patients showed high serum β2M in the PINK low, intermediate, and high-risk groups, respectively. There were no significant differences in OS according to the serum β2M level in the PINK low- and intermediate-risk groups (Fig. 3A and B); however, in the PINK high-risk group, the OS was significantly inferior in patients with high serum β2M compared to those with low serum β2M (p=0.007) (Fig. 3C). In terms of PFS, there were no significant differences according to serum β2M in all groups; however, there was a trend for worse PFS in patients with high serum β2M in the PINK high-risk group (p=0.051) (S1 Fig.).
5. Proposal of a new prognostic index based on PINK and serum β2M
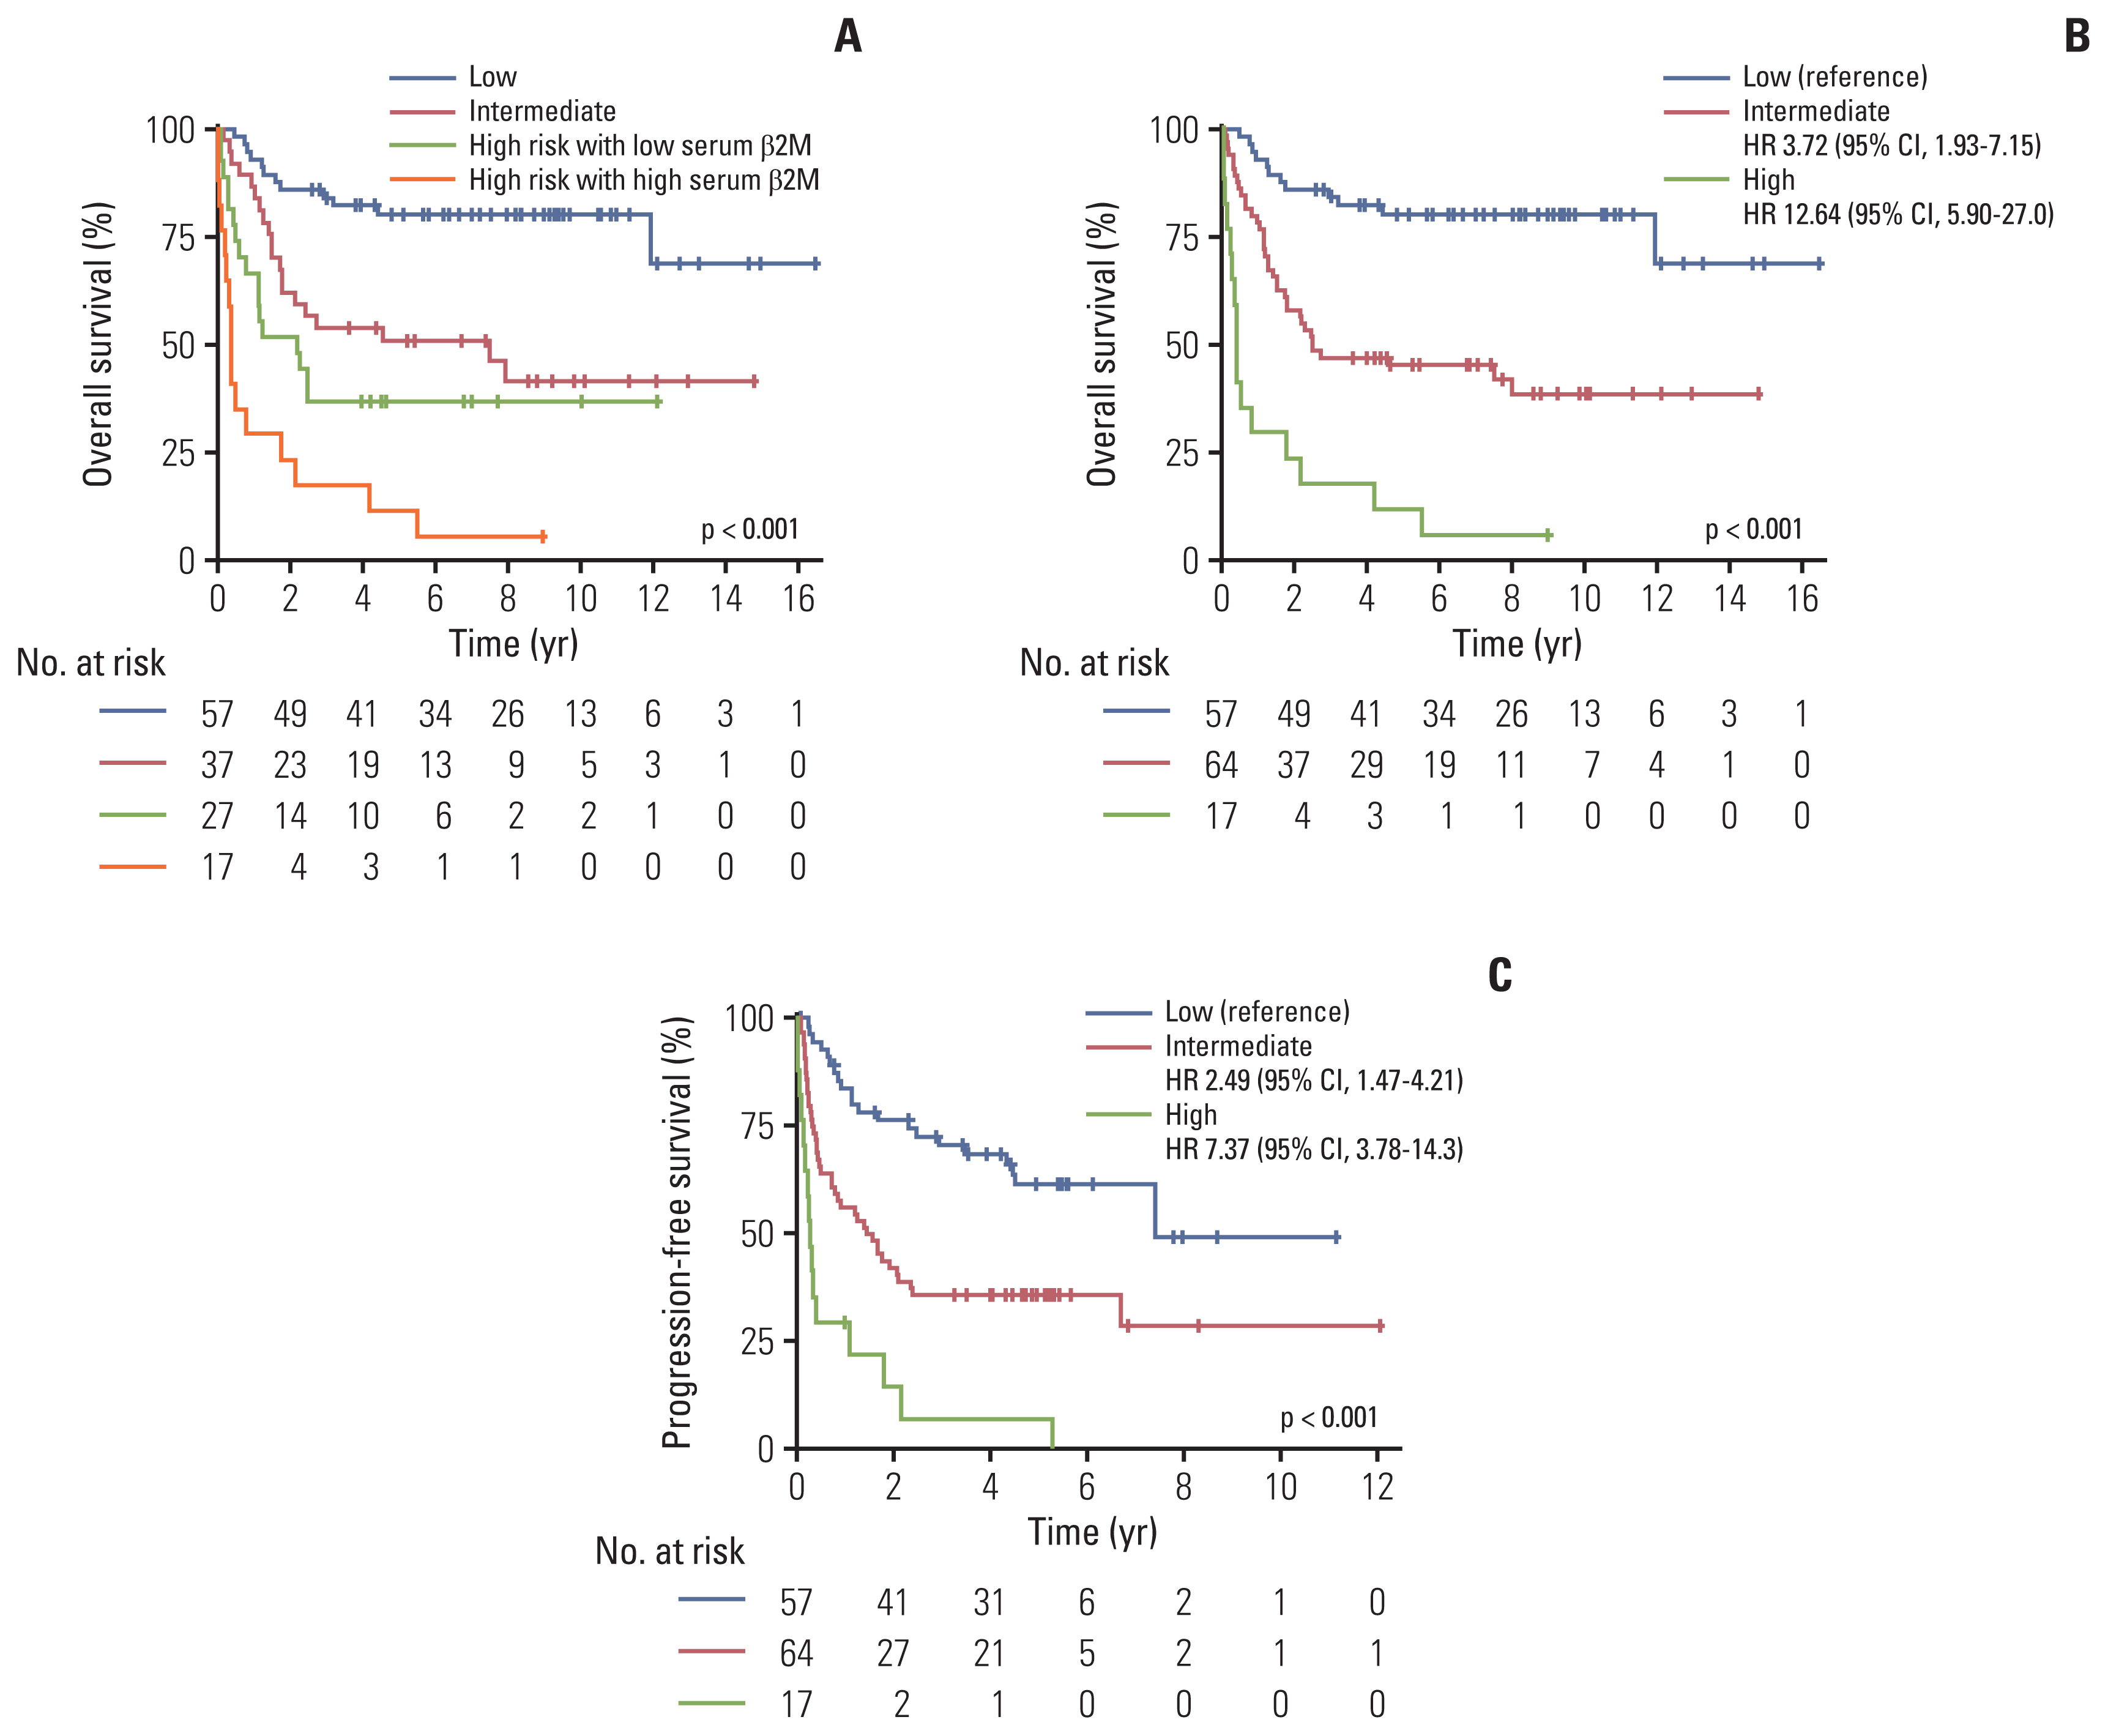
Considering the results that the high serum β2M level further stratified patients with a worse prognosis among the patients in the high-risk group of PINK, we re-classified patients in the PINK high-risk group based on their serum β2M levels. Among the PINK high-risk group (n=44), 27 (61.3% of 44) patients were redefined as the high risk with low serum β2M group, and 17 patients (38.6% of 44) were re-classified as the high risk with high serum β2M group. The median OS for the low-, intermediate-, and high-risk with low serum β2M-, and high-risk with high serum β2M groups were not reached (95% CI, 11.95 to NA), 7.48 years (95% CI, 1.77 to NA), 2.19 years (95% CI, 1.13 to NA), and 0.38 years (95% CI, 0.23 to 2.16), respectively (Fig. 4A). There were no significant differences between the OS of the intermediate risk- and high risk with serum β2M groups (HR, 1.56; 95% CI, 0.81 to 2.99; p=0.184); however, the OS of the high risk with high serum β2M group was significantly inferior compared to the high-risk with low serum β2M group (HR, 2.49; 95% CI, 1.25 to 4.97; p=0.009).
Based on these results, we proposed a new prognostic model incorporating serum β2M into PINK, PINK-B. Patients who were originally classified as PINK low- and intermediate-risk groups were classified as PINK-B low- and intermediate groups, respectively. Among the patients in the high-risk group of PINK, patients with low serum β2M were redefined as the PINK-B intermediate-risk group, and patients with high serum β2M were redefined as the PINK-B high-risk group. In the training cohort, PINK-B discriminated the patients into three risk groups, which had distinct OS and PFS (p < 0.001 for both). The 3-year OS according to PINK-B was 84.14% (95% CI, 75.14 to 94.21), 46.88% (95% CI, 36.11 to 60.84) and 17.65 (95% CI, 6.32 to 49.28) in the low, intermediate, and high-risk groups, respectively (Fig. 4B). The 3-year PFS according to PINK-B was 70.64% (95% CI, 59.49 to 83.33), 35.90% (95% CI, 25.90 to 49.80) and 7.35% (95% CI, 1.16 to 46.77) in the low, intermediate, and high-risk groups, respectively (Fig. 4C). In the training cohort, PINK-B had a lower AIC (556.9) and a higher C-index (0.82; 95% CI, 0.75 to 0.89) compared with PINK in terms of OS (AIC, 562.6; C-index, 0.80; 95% CI, 0.73 to 0.87) (Table 3).
6. Validation cohort
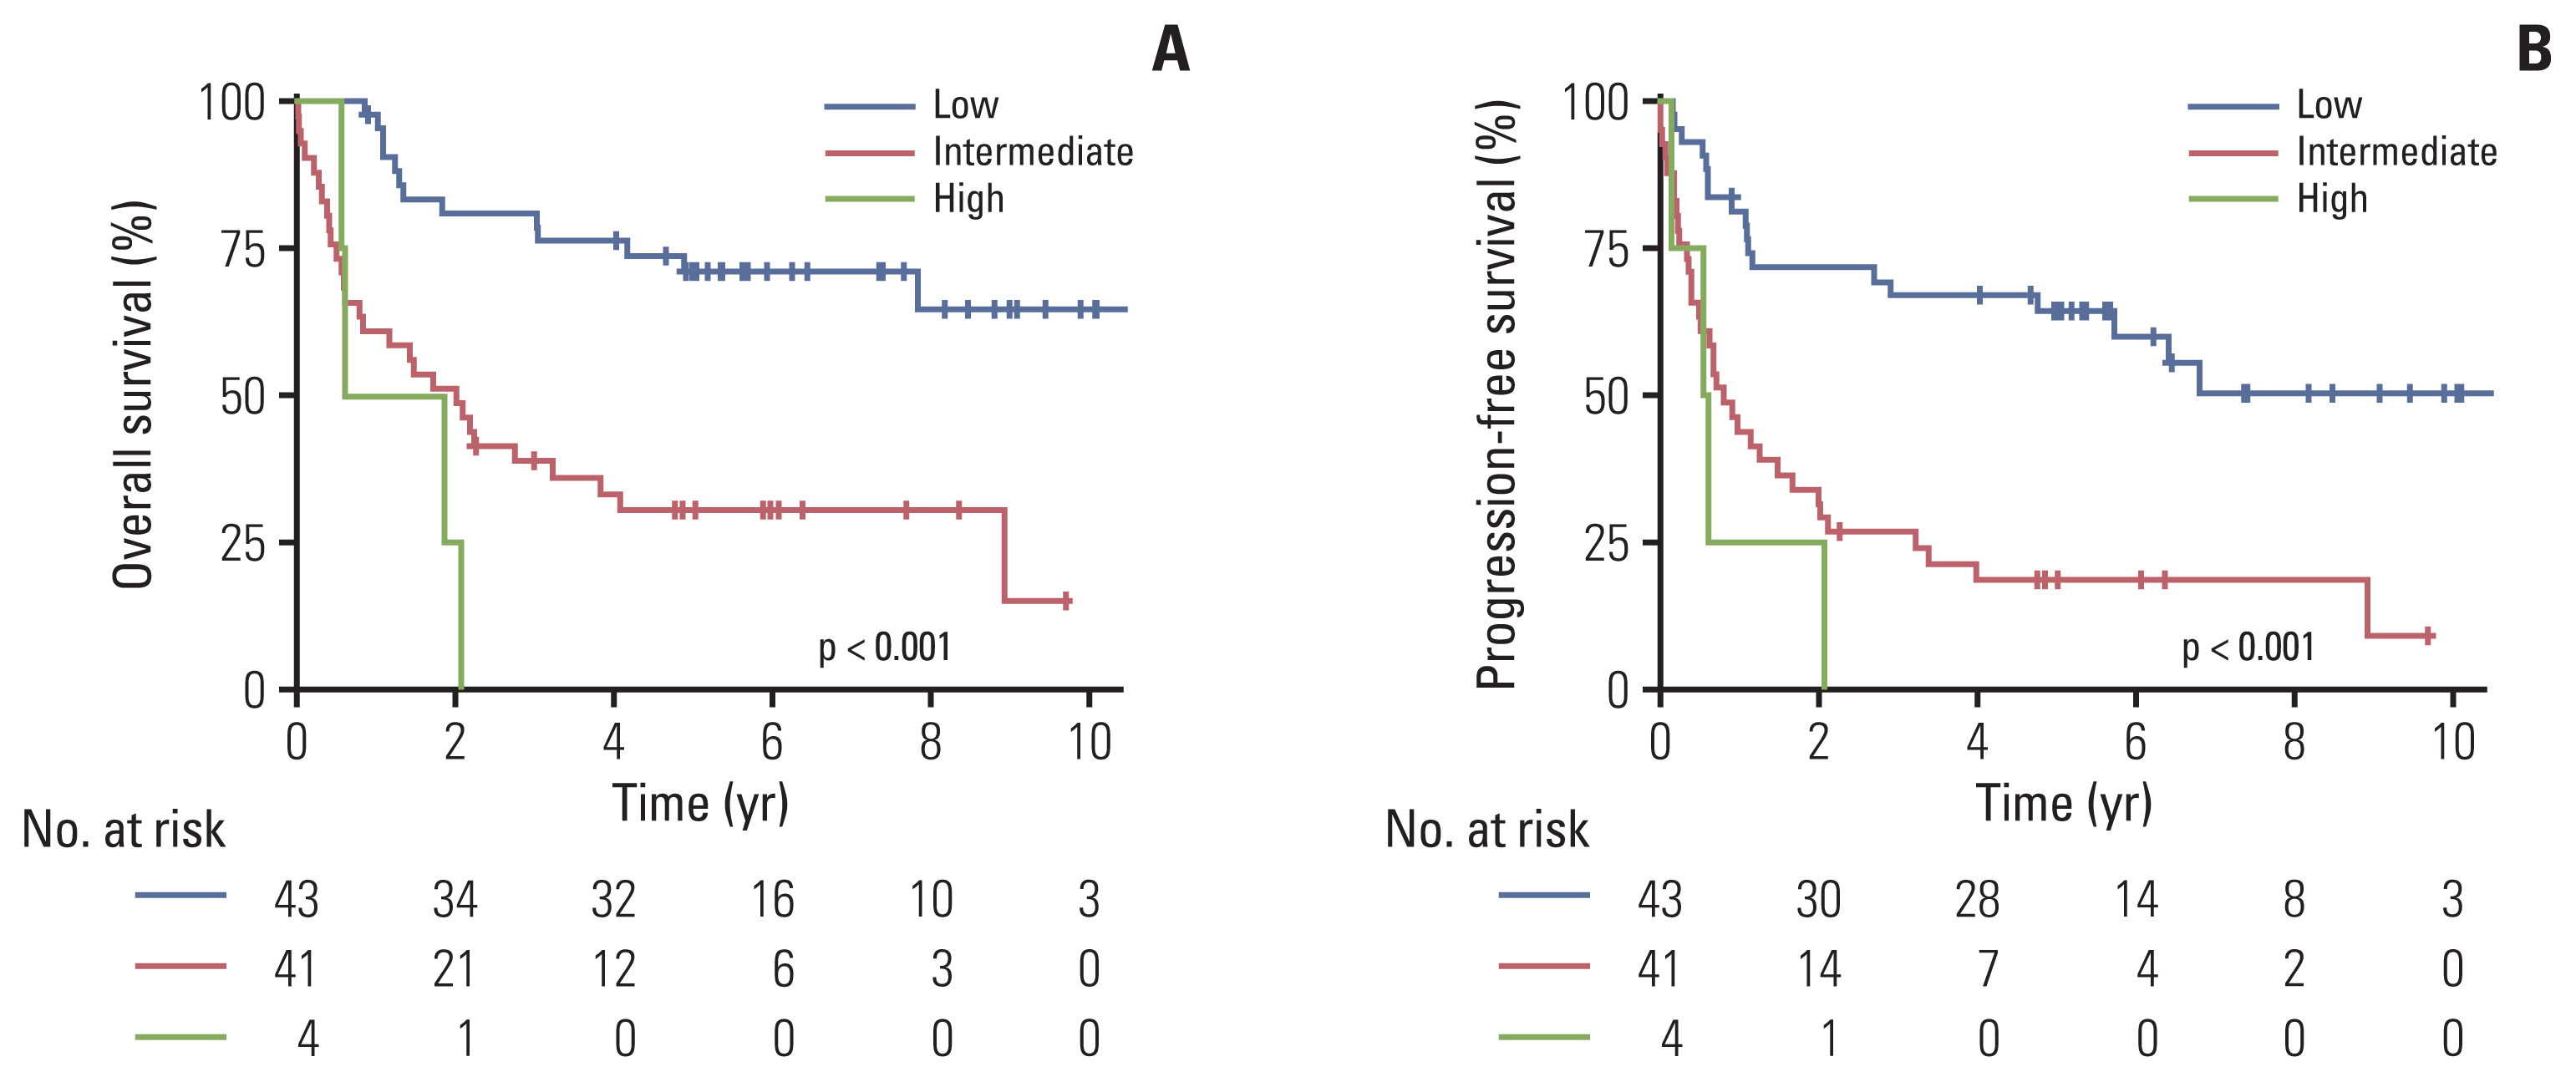
The prognostic value of PINK-B was further validated in the independent validation cohort (n=88). The patient characteristics of the validation cohort are described in S2 Table. In the validation cohort, 43 (49%), 41 (47%), and 4 (4.5%) patients were classified as PINK-B low-, intermediate-, and high-risk groups. The 3-year OS of the PINK-B low-, intermediate-, and high-risk groups was 81.00% (95% CI, 69.97 to 93.76), 38.87% (95% CI, 26.45 to 57.13), and 0%, respectively (Fig. 5A). The 3-year PFS of the PINK-B low-, intermediate-, and high-risk groups was 67.0% (95% CI, 54.2 to 82.8), 26.8% (95% CI, 16.2 to 44.5), and 0%, respectively (Fig. 5B).
Discussion
Several previous studies have reported the prognostic value of serum β2M in patients with ENKTL [9,10]. However, these studies included patients treated with anthracycline-based chemotherapy and may not reflect the current treatment patterns for ENKTL. To the best of our knowledge, this is the first study to evaluate the prognostic value of serum β2M exclusively in patients with ENKTL treated with non-anthracycline–based chemotherapy and it showed that high serum β2M was independently associated with a poor OS and PFS. In particular, a high serum β2M could further stratify ultra-high-risk patients with a significantly worse OS in the high-risk group of PINK. Also, the clinical outcomes of the PINK intermediate group and PINK high-risk group with low serum β2M were similar. These findings provide a substantial rationale for including serum β2M in PINK as an additional risk factor. We proposed a new prognostic model that has the specific strength of identifying ultra-high–risk patients with a poor prognosis. This new prognostic model, PINK-B, showed good discrimination power in the training cohort and in an independent validation cohort, which supports its generalizability.
Previously, elevated serum β2M has been widely evaluated as a prognostic factor in numerous types of lymphoproliferative disorders [8]. Based on these prognostic roles of serum β2M, serum β2M was included as a risk factor in the risk-stratification system in several disorders, such as multiple myeloma [14], chronic lymphocytic leukemia [15], follicular lymphoma [16], marginal-zone lymphoma [17], and angioimmunoblastic T-cell lymphoma [18]. Our study’s results were in line with these findings that serum β2M has a role as a prognosticator in ENKTL.
The exact mechanisms underlying the association of a poor prognosis of patients with ENKTL and high serum β2M is still unclear. Our results showed that the patients with high serum β2M were related to high tumor burdens, such as disseminated bone disease, advanced stage, and elevated LDH. These findings are in line with previous reports that a high serum β2M is a reflection of a high tumor burden [8]. However, serum β2M is an independent prognostic marker in multivariate analysis including other factors that reflect a high tumor burden, suggesting that there may be other unknown relationships between a high serum β2M and a poor prognosis, which warrants further investigation.
The PINK and PINK–Epstein-Barr virus (PINK-E) are the most widely accepted prognostic models for ENKTL patients treated with non-anthracycline–based chemotherapy. Several studies have suggested that the PINK-E model may be more useful than the PINK model to stratify high-risk patients, probably due to the strong association between EBV DNA positivity and the prognosis of ENKTL [19,20]. However, there are some limitations in measuring EBV DNA. Quantitative polymerase chain reaction for EBV DNA might not be available in all hospitals. In addition, the reference values, measuring procedure and sample type (whole blood or plasma) [21], and the definition of high titer is not yet standardized [22]. Because of these limitations, the PINK-E model incorporates a detectable EBV-DNA titer regardless of the sample type. Although the PINK-E model is currently one of the most valid prognostic models in ENKTL, these obstacles limit a wider application of the PINK-E model in routine clinical practice. In contrast, measurement of serum β2M is easy, reproducible, and standardized worldwide. Considering these advantages and the prognostic roles of serum β2M in our study, PINK-B has the specific advantage of simplicity and easy applicability in daily clinical practice as compared to PINK-E. Together with the results that PINK-B could identify ultra-high-risk patients than PINK, the clinical value of PINK-B deserves further evaluation in future studies, especially in terms of optimizing the treatment strategy based on risk-adapted approaches to ENKTL patients.
There are several limitations of the present study. As anticipated for any retrospective study, this study is susceptible to selection bias. In addition, the cutoff value of serum β2M in this study was relatively high compared with previous studies [9,10]. However, various cutoff values have been used in prognostic models of numerous lymphoproliferative diseases. Indeed, the International Staging System for multiple myeloma adopted serum β2M cutoff values of 3.5 mg/L and 5.5 mg/L [14]. Moreover, the sample size was small. However, considering the rarity of ENKTL, our sample size was relatively similar to or larger than that used in previous studies [10,23,24].
In conclusion, serum β2M is an independent prognostic factor for patients with ENKTL. Our new prognostic model incorporating serum β2M into PINK, PINK-B, may be useful for identifying ultra-high-risk patients, and it can be easily adopted into daily clinical practice. This model should be validated in additional large-scale independent cohorts.