Introduction
Lung cancer is the most common malignant tumor and is responsible for the largest number of cancer-related deaths worldwide [1]. Distant metastasis is a major cause of short survival times and poor prognoses among patients with advanced lung cancer [2,3]. Approximately 40% of newly diagnosed non–small cell lung cancer (NSCLC) patients have metastatic disease [4,5]. Liver metastases occur in 20%–30% of patients with NSCLC [6]. Once liver metastasis occurs, patient prognosis is very poor, and the median survival time is only 3 months [7,8]. A hypothetical survival analysis of a large population of patients with metastatic NSCLC across several clinical studies based on the Surveillance, Epidemiology, and End Results database showed that NSCLC patients with liver metastases had shorter overall survival (OS) times than NSCLC patients with isolated organ metastasis [3,8,9]. Therefore, there is an urgent need to develop more effective strategies for the treatment of NSCLC patients with liver metastases.
In recent years, many randomized controlled trials (RCTs) have shown that immune checkpoint inhibitors (ICIs) can significantly improve the OS rate of patients with advanced lung cancer. There are currently 6 U.S. Food and Drug Administration (FDA)–approved and three European Medicines Agency (EMA)–approved drugs or regimens containing anti–programmed death-1 (PD-1)/programmed death-ligand 1 (PD-L1) antibodies available for patients with advanced squamous NSCLC. For patients with advanced nonsquamous NSCLC, eight regimens containing anti–PD-1 or anti–PD-L1 antibodies have been approved by the FDA, and five regimens have been approved by the EMA. Nivolumab is EMA and FDA-approved. Pembrolizumab is approved by the FDA and EMA for tumor cells with a high level of PD-L1 expression (≥ 50%) as measured by immunohistochemistry assays, whereas atezolizumab is approved only by the FDA for this indication. OS rates have been significantly improved by ICIs in comparison with those associated with traditional chemotherapy [10–13]. However, some studies have revealed that the efficacy of ICIs and tumor response rates vary depending on the site of metastasis. [14,15]. Liver metastases are associated with poor prognosis and poor response to ICI treatment [16–20]. Atezolizumab combined with chemotherapy has been evaluated in three phase III randomized controlled trials for the treatment of nonsquamous NSCLC with liver metastases, but the results are controversial. In the IMpower130 [21] and IMpower132 [22] studies, the subgroup of patients with liver metastases who received ICIs combined with chemotherapy did not achieve significant OS benefits (hazard ratio [HR], 1.04; 95% confidence interval [CI], 0.63 to 1.72 and HR, 0.99; 95% CI, 0.57 to 1.70, respectively). However, the IMpower150 study showed that compared with chemotherapy alone, the risk of death among patients with liver metastases in the atezolizumab in combination with bevacizumab plus carboplatin plus paclitaxel treatment group was reduced by 48% [23].
The efficacy of immunotherapy in NSCLC patients with liver metastases has been directly evaluated in few RCTs, and it remains controversial whether this population benefits from immunotherapy. Therefore, we conducted a network meta-analysis (NMA) to comprehensively summarize the current literature to evaluate the differences in the efficacies of ICI monotherapy, ICIs combined with chemotherapy, dual immunotherapy, and ICIs combined with chemotherapy plus antiangiogenic therapy among patients with NSCLC liver metastases.
Materials and Methods
We conducted an NMA following the guidelines for Preferred Reporting Items for Systematic Reviews and Meta-analyses (PRISMA) [24]. The NMA has been registered in the International Prospective Register of Systematic Reviews (PROSPERO) with the CRD code CRD42021237080.
1. Search strategy
We searched the English literature available in the PubMed, American Society of Clinical Oncology, and European Society for Medical Oncology databases from January 2015 to January 2021. The search formula was as follows: (Immunotherapy OR “checkpoint inhibitor”[All Fields] OR Nivolumab OR Pembrolizumab OR Durvalumab OR Atezolizumab OR Avelumab OR Ipilimumab OR Tremelimumab) AND (NSCLC OR “non-small-cell lung cancer” OR “carcinoma, non-small-cell lung “[Mesh Terms] OR (“carcinoma”[All Fields]) AND “non-small-cell”[All Fields] AND “lung”[All Fields]) OR “Non-small-cell lung carcinoma”[All Fields]) AND (advanced or metastatic) AND (randomized or randomised or random RCT or randomly). In addition, we reviewed relevant review articles and the reference lists of the included studies to identify other articles that might qualify for this analysis.
2. Study selection
We included studies that met all of the following inclusion criteria: (1) studies of NSCLC patients with liver metastases diagnosed by histology or cytology; (2) studies comparing ICIs with chemotherapy; (3) studies with progression-free survival (PFS) or overall survival (OS) and the corresponding HRs and 95% CI as the primary result, and the objective response rate (ORR) or disease control rate and the corresponding HRs and 95% CI as the secondary result; and (4) studies that were phase III randomized control trials. The exclusion criteria were as follows: (1) single-arm or nonrandomized trials; (2) studies without relevant data; and (3) experimental animal studies. When several papers repeatedly reported the same experiment, we select the most informative article for the final analysis.
3. Data extraction
The characteristics and data were extracted by two authors (Q.Y. and R.S.), and any differences were resolved through discussion or negotiation with a third author (L.D.) until a consensus was reached. The following information was extracted: first author, publication year, study name, patient race, Eastern Cooperative Oncology Group (ECOG), age, sex, smoking history, baseline liver metastasis sample size, histological characteristics, intervention group, control group, number of treatment lines, PD-L1 expression status, the HR of the OS or PFS and the corresponding 95% CI and other available results.
4. Quality assessment
We used the Cochrane Risk of Bias Tool to explore the sources of bias in the included randomized trials [25]. We included (1) random sequence generation; (2) allocation concealment; (3) blinding of participants and personnel; (4) blinding of outcome assessment; (5) incomplete outcome data; (6) selective reporting; and (7) other bias. These parameters were divided into three levels, in which “yes” indicated a low risk for bias, “no” indicated a high risk for bias, and “unclear” indicated that the risk for bias was not clear. The risk of bias in the included studies was independently assessed by two authors. Any differences were being resolved through discussion or consultation with a third author (S1 Fig.).
5. Statistical analyses
NMA can compare the therapeutic effectiveness of interventions that have not been studied in head-to-head clinical trials [26,27]. HR estimates with 95% confidence intervals for indirect comparisons are obtained from an NMA using a frequentist framework. Random-effects models were used, and the outcomes of interest in the NMA were the OS and PFS rates of the overall patient cohort. Further subgroup analyses by histology and therapy line were carried out. The sensitivity analysis was performed using STATA ver. 15.0 (Stata Corp., College Station, TX), and the remaining statistical analyses were performed using R 4.0.2 (R Foundation for Statistical Computing, Vienna, Austria). All data are expressed as HRs and 95% CIs. p < 0.05 was considered statistically significant.
Results
1. Study selection
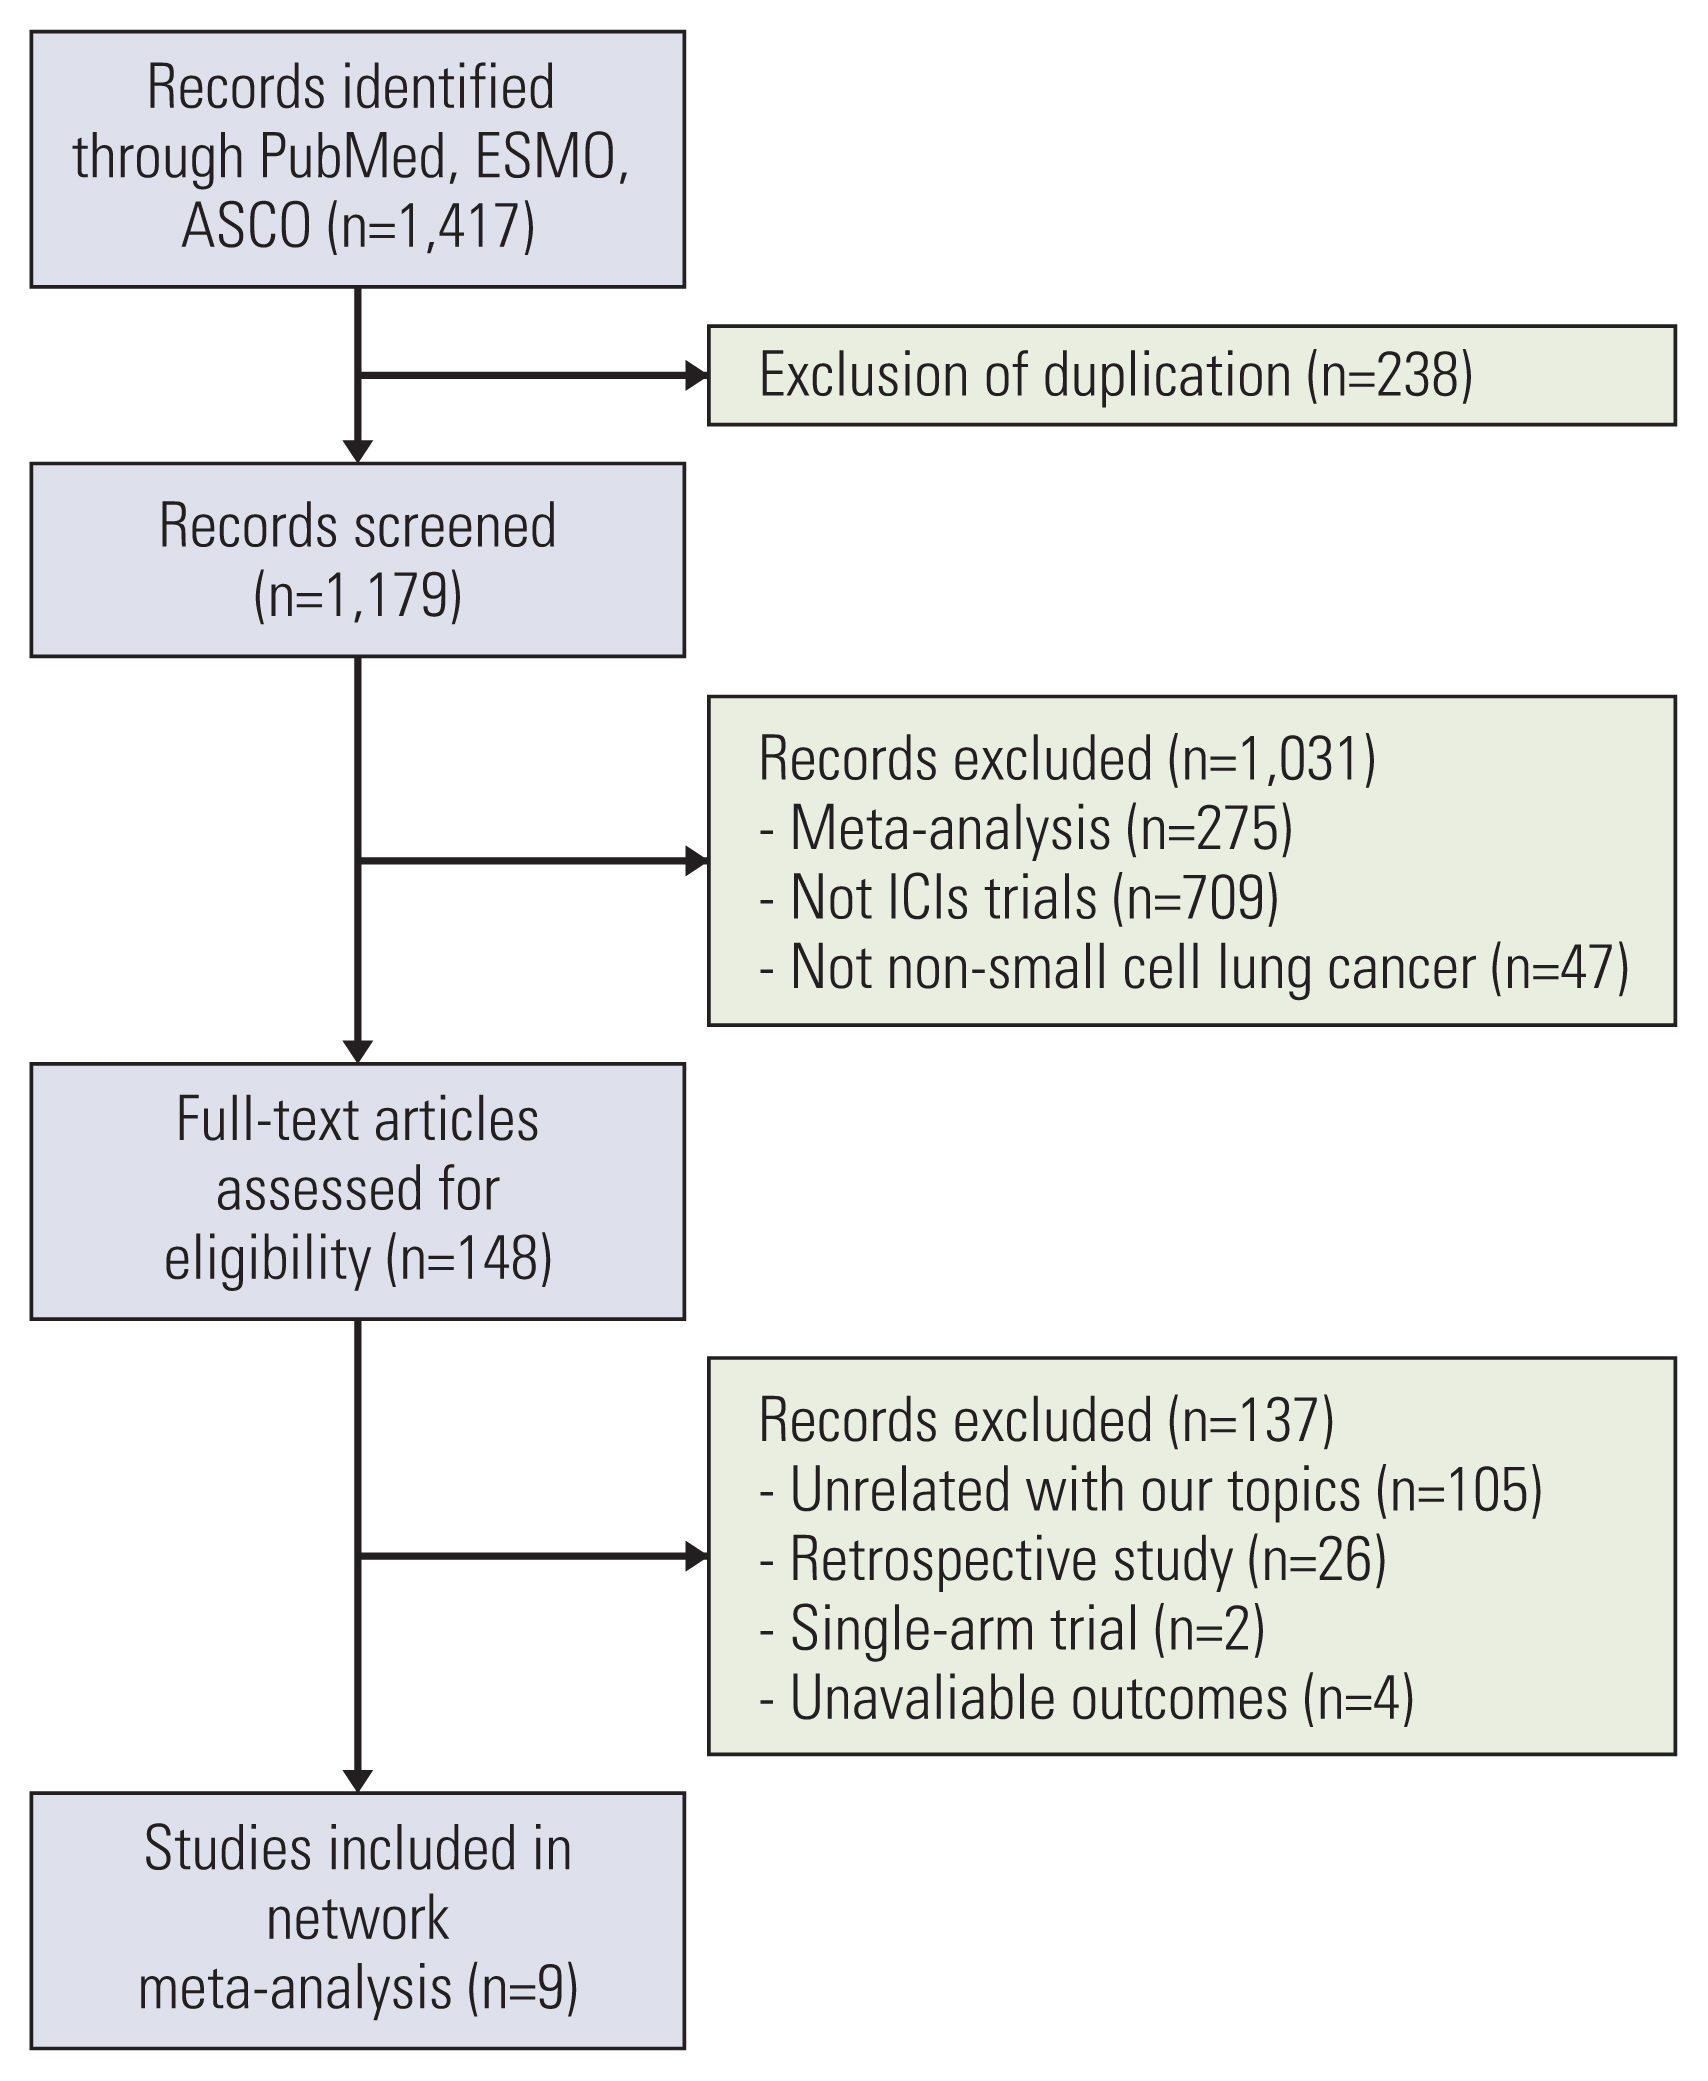
Our initial literature search strategy retrieved 1,417 records. After excluding studies that did not meet the inclusion criteria, we finally included nine studies that compared ICIs and chemotherapy. Our selection process and the exclusion criteria are shown in Fig. 1.
2. Characteristics of the eligible studies
The specific characteristics of the included studies are summarized in Table 1. The nine eligible studies were all international multicenter phase III randomized controlled trials. A total of 1,141 patients with liver metastases were included in this study. Of the nine studies, one study [28] included patients with squamous NSCLC, five studies [21–23,29] included patients with nonsquamous NSCLC, and the other three studies [30–32] included patients with either squamous or nonsquamous NSCLC. Eight studies [21–23,28,29,31,32] evaluated the use of PD-1 or PD-L1 inhibitors combined with other treatments in the intervention group, and one study [30] evaluated PD-1 inhibitors alone. Only one study [23] evaluated the addition of bevacizumab in both the experimental and control groups. One study evaluated a second-line treatment or above [30], while the others all evaluated a first-line treatment. The network plot established for the NMA of the OS and PFS outcome is shown in Fig. 2.
3. OS rate analysis of the overall study cohort
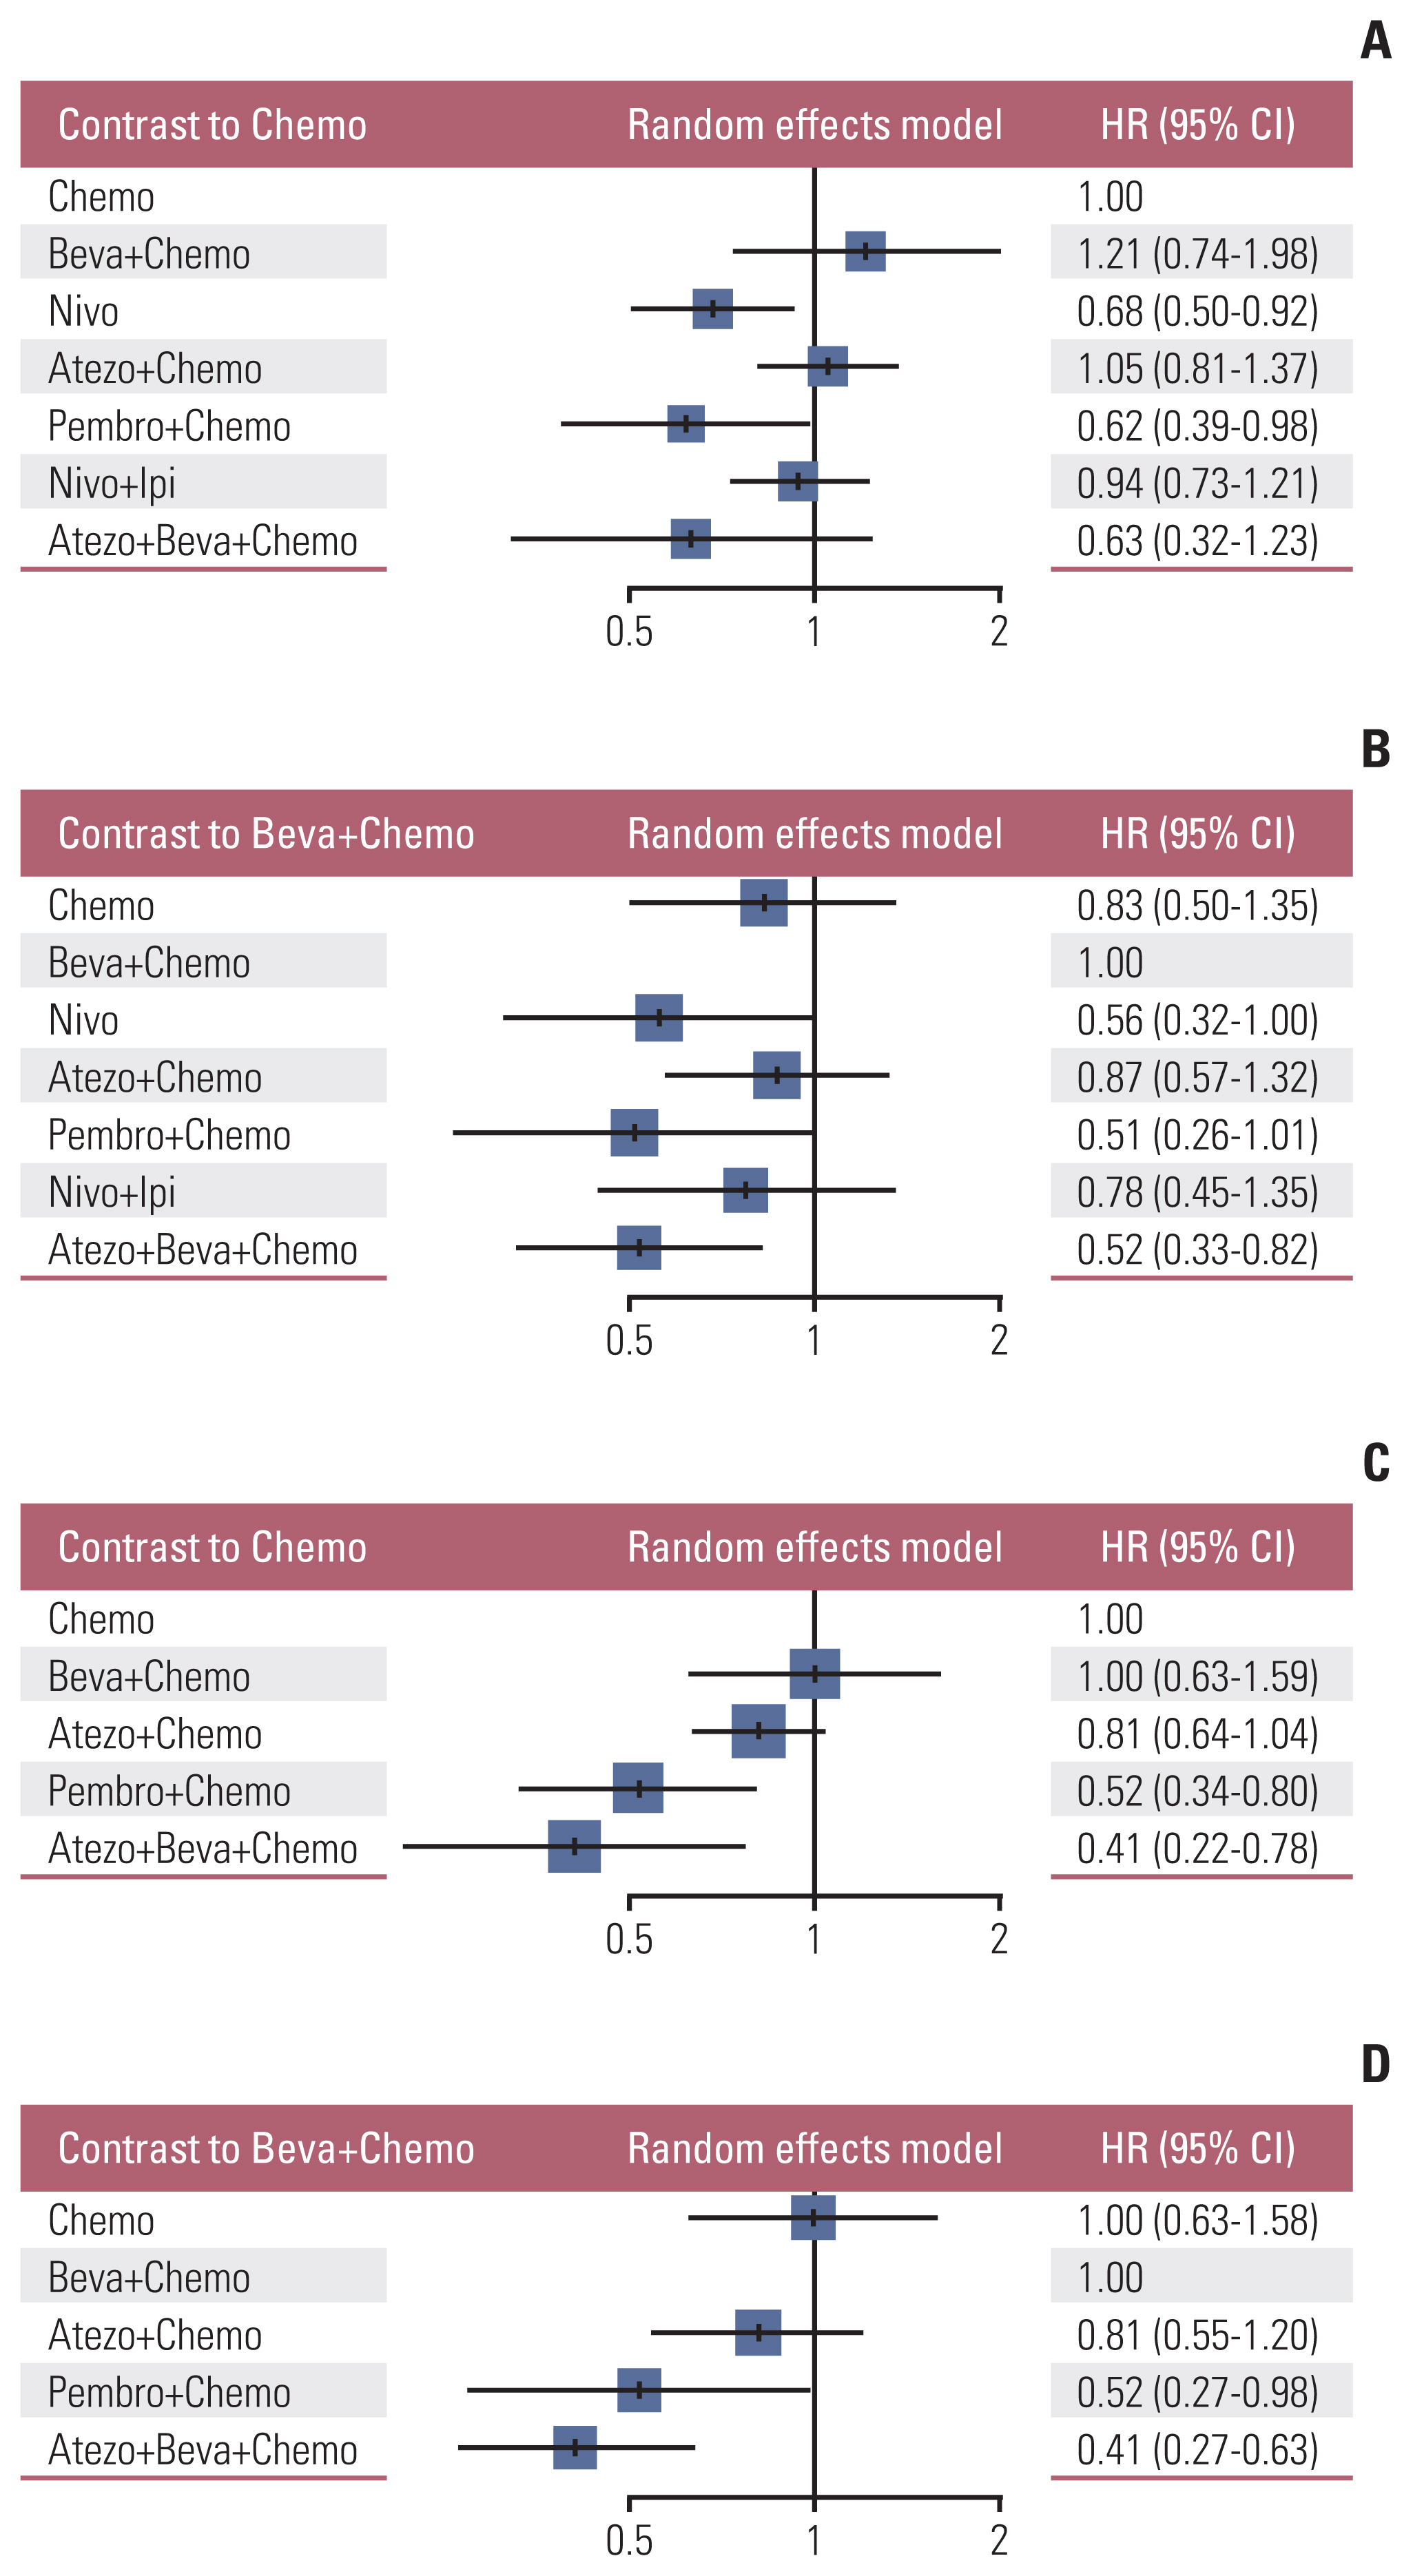
Nine studies were connected to a common network for OS analysis using HR data. Fig. 3A and B presents the forest plots associated with the OS-HR analysis. Chemotherapy and bevacizumab+chemotherapy were established as the reference groups in this NMA since they were the control arms in these nine trials. Nivolumab (HR, 0.68; 95% CI, 0.50 to 0.92) and pembrolizumab+chemotherapy (HR, 0.62; 95% CI, 0.39 to 0.98) showed a significant benefit in OS over chemotherapy alone. No significant differences were observed between any of the other three groups compared to chemotherapy alone with regard to OS—i.e., the groups receiving atezolizumab+chemotherapy, nivolumab+ipilimumab, atezolizumab+bevacizumab+chemotherapy. Only atezolizumab+bevacizumab+chemotherapy (HR, 0.52; 95% CI, 0.33 to 0.82) showed a significant OS benefit compared with that obtained with bevacizumab+chemotherapy.
Indirect comparison results and ranks of all interventions are provided in Table 2. Only the nivolumab vs. atezolizumab+chemotherapy and pembrolizumab+chemotherapy vs. atezolizumab+chemotherapy indirect comparisons reached statistical significance (HR, 0.64; 95% CI, 0.43 to 0.96 and HR, 0.58; 95% CI, 0.34 to 0.99, respectively). The SUCRA rankings indicate that pembrolizumab+chemotherapy (0.794) is the best intervention, followed by atezolizumab+bevaci− zumab+chemotherapy (0.765), nivolumab (0.748), nivolu− mab+ipilimumab (0.421), chemotherapy (0.329), and atezo− lizumab+chemotherapy (0.276). Bevacizumab+chemotherapy (0.169) ranked last.
4. OS by histology
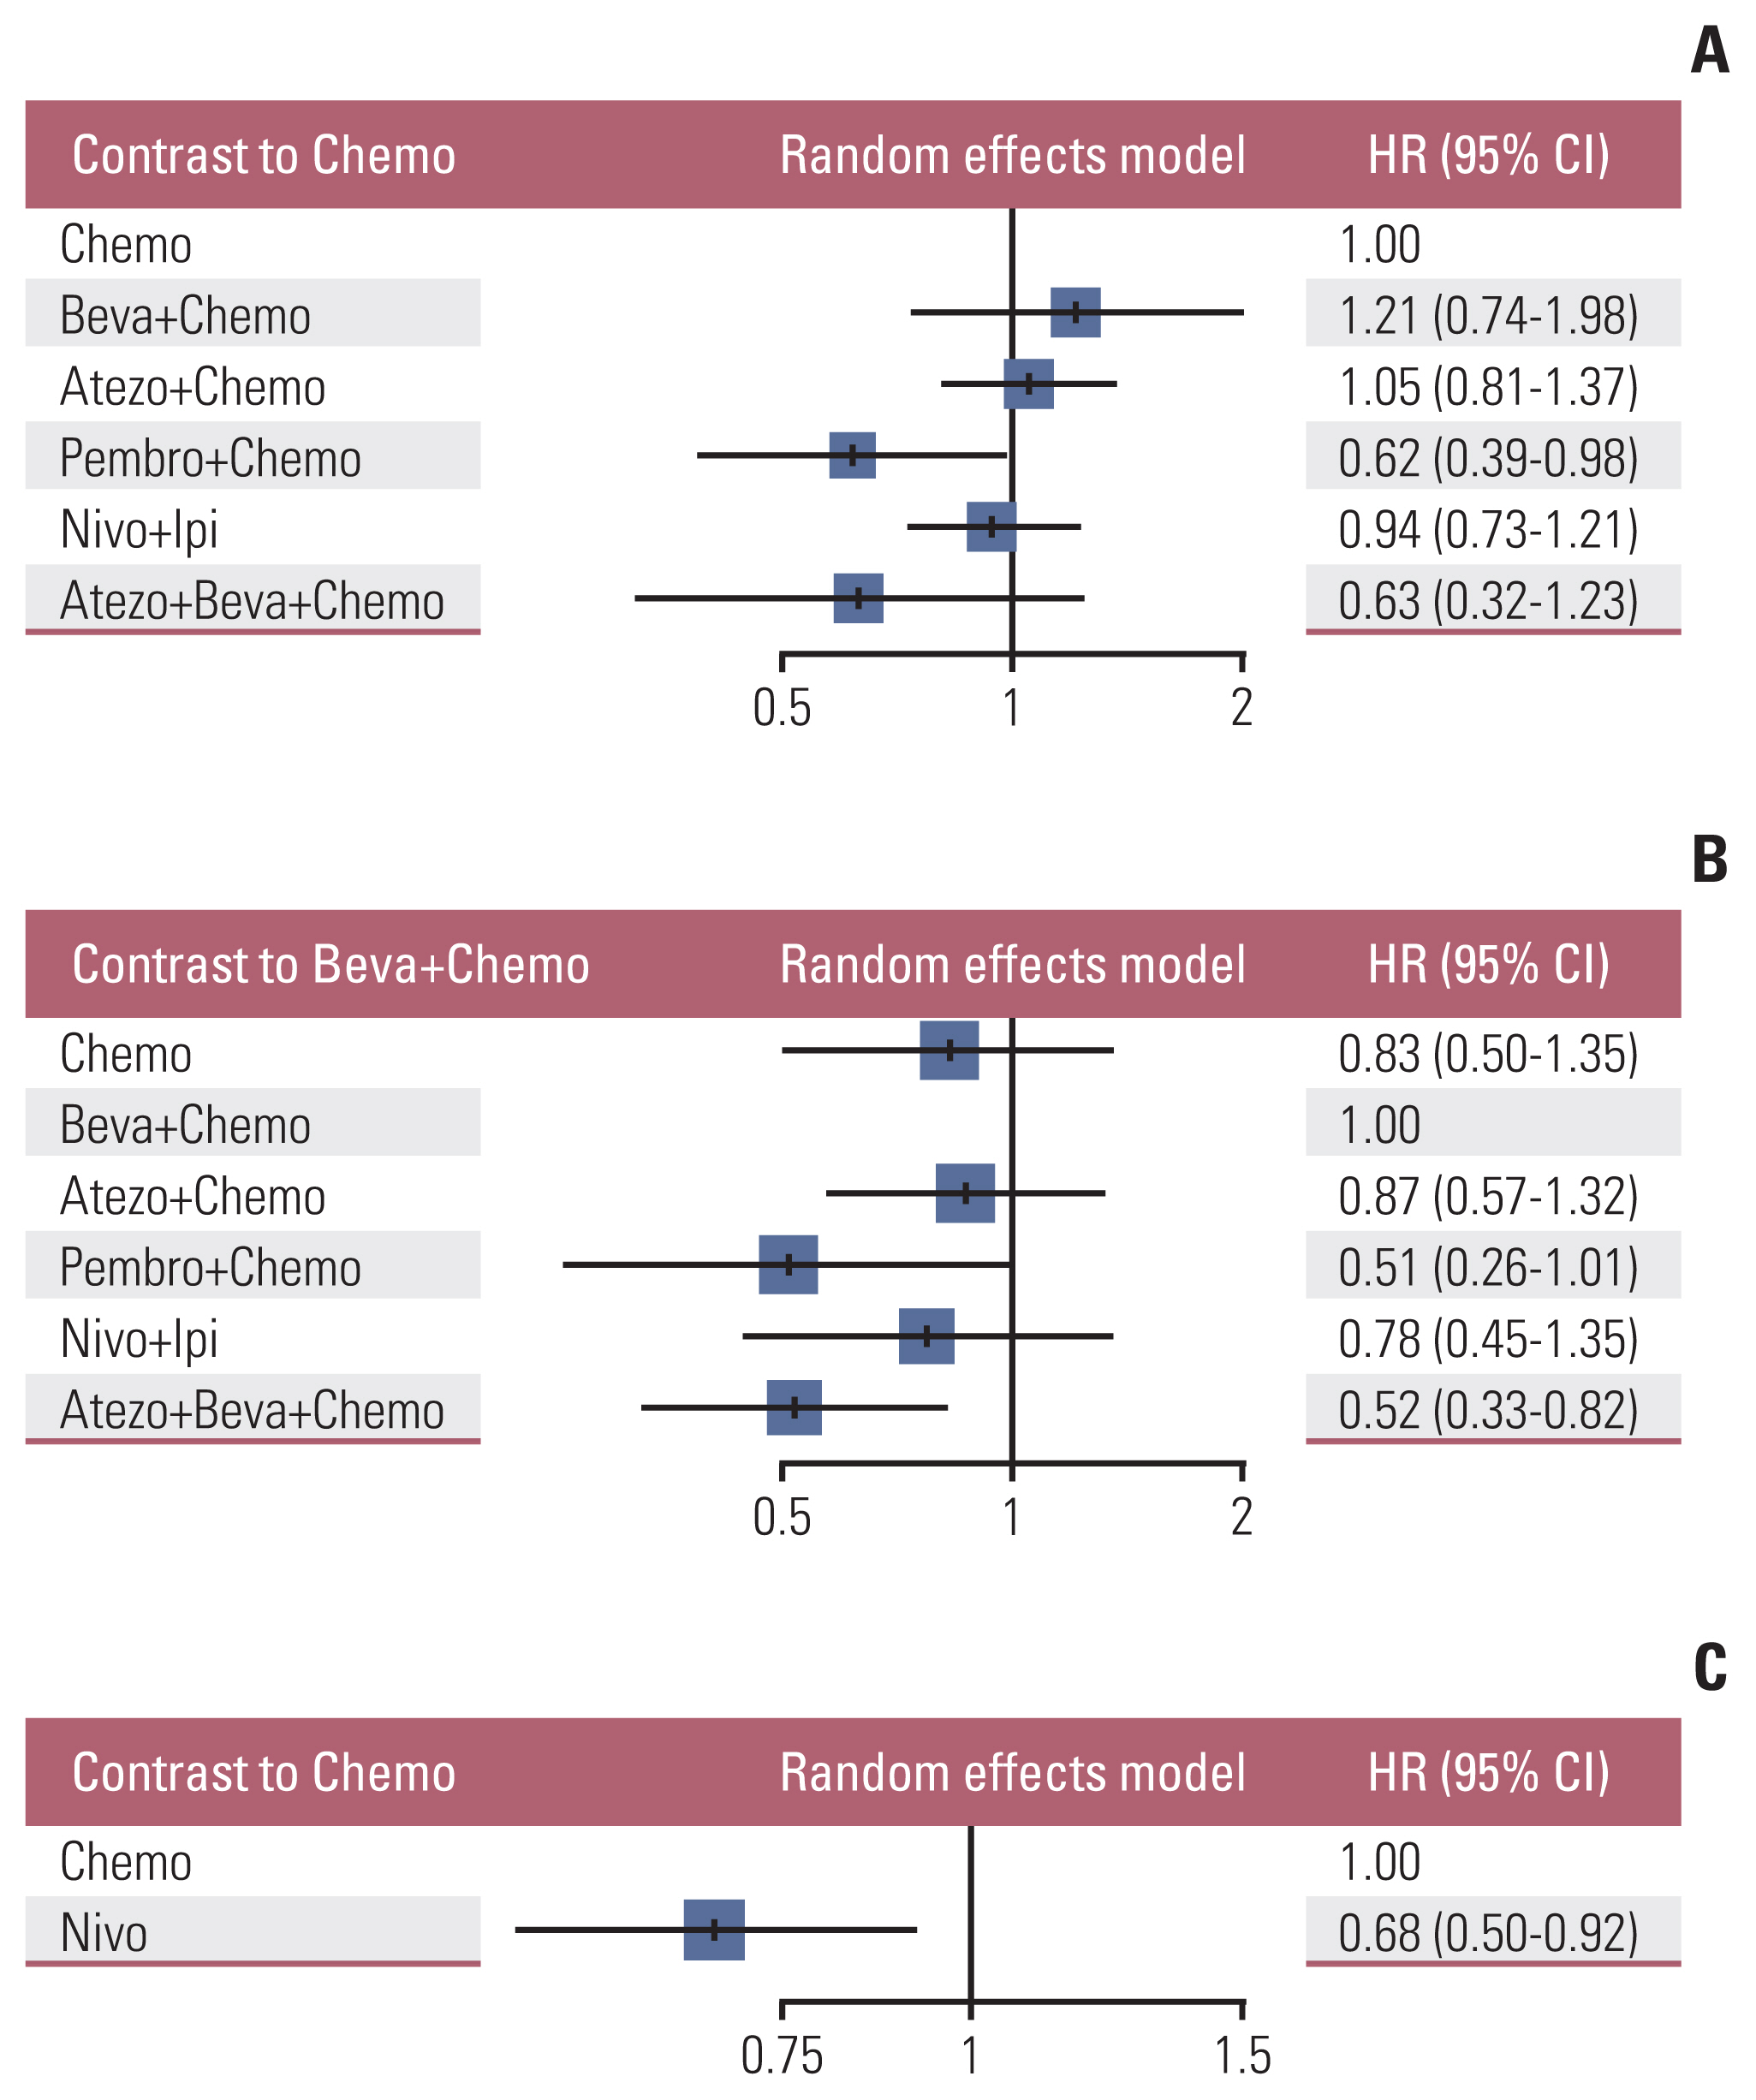
Similar to the overall cohort, pembrolizumab+chemotherapy (HR, 0.62; 95% CI, 0.39 to 0.98) showed a significant OS benefit over chemotherapy alone as determined by histological analysis of nonsquamous tumors (Fig. 4B). Similar to the overall cohort, atezolizumab+bevacizumab+chemotherapy (HR, 0.52; 95% CI, 0.33 to 0.82) yielded better survival outcomes than bevacizumab+chemotherapy as determined by histological analysis of nonsquamous tumors (Fig. 4C). In both squamous and nonsquamous tumors, nivolumab (HR, 0.68; 95% CI, 0.50 to 0.92) showed a significant benefit in OS over chemotherapy alone (Fig. 4D). No such significant benefit was observed for nivolumab+ipilimumab (HR, 0.94; 95% CI, 0.73 to 1.21) compared with chemotherapy alone (Fig. 4A).
5. OS by therapy line
The OS subgroup analyses based on therapy line were generally consistent with those obtained by analyzing the overall population. For therapy line=1, only pembrolizumab+chemotherapy (HR, 0.62; 95% CI, 0.39 to 0.98) showed a significant OS benefit over chemotherapy alone, and only atezolizumab+bevacizumab+chemotherapy (HR, 0.52; 95% CI, 0.33 to 0.82) were significantly more effective than bevacizumab+chemotherapy (Fig. 5A and B). For therapy line ≥ 2, nivolumab (HR, 0.68; 95% CI, 0.50 to 0.92) showed a significant OS benefit over chemotherapy alone (Fig. 5C).
6. PFS rate analysis of the overall study cohort
Six studies were connected to a common network for the PFS analysis using HR data. The forest plots associated with the PFS-HR analysis are shown in Fig. 3C and D. Pembrolizumab+chemotherapy and atezolizumab+bevacizumab+chemotherapy showed a significant PFS benefit over chemotherapy alone (HR, 0.52; 95% CI, 0.34 to 0.80 and HR, 0.41; 95% CI, 0.22 to 0.78, respectively) and bevacizumab+chemotherapy (HR, 0.52; 95% CI, 0.27 to 0.98 and HR, 0.41; 95% CI, 0.27 to 0.63, respectively) (data not shown). Atezolizumab+chemotherapy showed a benefit over chemotherapy alone (HR, 0.81; 95% CI, 0.64 to 1.04) or bevacizumab+chemotherapy (HR, 0.81; 95% CI, 0.55 to 1.20).
Indirect comparison results and ranking of all interventions are provided in Table 3. Only the atezolizumab+bevacizumab+chemotherapy vs. atezolizumab+chemotherapy indirect comparison reached statistical significance (HR, 0.50; 95% CI, 0.28 to 0.91). The SUCRA rankings suggested that atezolizumab+bevacizumab+chemotherapy (0.875) is the best intervention, followed by pembrolizumab+chemotherapy (0.767), atezolizumab+chemotherapy (0.457), bevacizumab+ chemotherapy (0.211) and chemotherapy (0.189), which ranked last.
7. PFS by histology
Similar to the overall cohort, the histological analysis of nonsquamous lung cancer revealed that pembrolizumab+ chemotherapy and atezolizumab+bevacizumab+chemotherapy showed a significant PFS benefit over chemotherapy alone (HR, 0.52; 95% CI, 0.34 to 0.80 and HR, 0.43; 95% CI, 0.22 to 0.85, respectively) and bevacizumab+chemotherapy (HR, 0.49; 95% CI, 0.25 to 0.97 and HR, 0.41; 95% CI, 0.27 to 0.63, respectively). No such significant benefit was observed by histological analysis of nonsquamous and squamous tumors with atezolizumab+chemotherapy compared with chemotherapy alone or bevacizumab+chemotherapy (Fig. 4E–G).
8. Sensitivity analysis
The leave-one-out approach was used for the sensitivity analysis to evaluate the impact of each study on the pooled HRs of the OS and PFS rates. No single study influenced the final interpretation of the pooled results, which indicates relatively good stability (S2 Fig.).
9. Publication bias
When fewer than 10 studies were included, the funnel plot was biased. Therefore, publication bias was evaluated by Begg’s and Egger’s tests. p < 0.05 was considered statistically significant. There was no evidence of publication bias in the OS (Egger’s test: p=0.93; Begg’s test: p > 0.99) or PFS (Egger’s test: p=0.78; Begg’s test: p=0.85) results.
Discussion
ICIs have dramatically changed the treatment of NSCLC [33]. Previous meta-analyses that compared ICI-based treatments with chemotherapy [34–37] revealed that NSCLC patients with liver metastases can benefit from ICIs. However, no study has compared OS and PFS outcomes among nivolumab, atezolizumab+chemotherapy, pembrolizumab+ chemotherapy, nivolumab+ipilimumab, and atezolizumab+bevacizumab+chemotherapy treatments for NSCLC patients with liver metastases. Hence, we comprehensively summarize the current literature to compare the efficacy of different ICI approaches for advanced NSCLC patients with liver metastases. To the best of our knowledge, this study is the most up-to-date NMA.
Regarding the OS rate, pembrolizumab+chemotherapy, atezolizumab+bevacizumab+chemotherapy, and nivolumab were superior to the other treatments (nivolumab+ipilimumab, atezolizumab+chemotherapy). Regarding the PFS rate, atezolizumab+bevacizumab+chemotherapy and pembroli− zumab+chemotherapy ranked highest. Four earlier meta-analyses by Yang et al. in 2020 [34], Li et al. in 2020 [35], and Kitadai et al. in 2020 [36] showed that NSCLC patients with liver metastases could benefit from nivolumab, pembrolizumab+chemotherapy, and atezolizumab+bevacizumab+chemotherapy, similar to the findings of our NMA.
However, several other studies showed that NSCLC patients with liver metastases had worse survival rates with pembrolizumab+chemotherapy and nivolumab [16,17,38–40]. Shiroyama et al. [41] also found that liver metastasis was associated with shorter PFS times and lower treatment response rates in nivolumab-treated NSCLC patients. The multivariate analyses showed that poor PFS rates after nivolumab treatment were independently related to poor baseline ECOG performance status and more metastatic sites, while elevated lactate dehydrogenase and neutrophil-to-lymphocyte ratio values tended to have a greater negative impact than liver metastases [41]. A previous study showed that a history of smoking was associated with a higher response rate to nivolumab [42]. Several studies revealed that patients with liver metastasis were younger and had poorer ECOG scores, larger tumor volumes, a higher frequency of local lymph node infiltration, poorer tumor differentiation, and more metastatic sites [9,41]. Based on these observations, the baseline clinical characteristics of NSCLC patients with liver metastasis may influence the outcomes of ICI therapy. There are few reports on the correlation between the population characteristics of NSCLC patients with liver metastasis and the outcomes of ICI treatment. Therefore, these confounding clinical factors need to be further investigated in future clinical trials.
The data did not show that atezolizumab+chemotherapy exhibited an OS or PFS benefit over chemotherapy alone for NSCLC patients with liver metastasis. However, significant OS and PFS benefits were observed with the addition of bevacizumab. One real-world study showed that bevacizumab could improve PFS and OS rates in NSCLC patients with and without baseline liver metastases, and the relative OS benefit was greater in the former [43]. Similarly, Sandler et al. [44] also showed that the addition of bevacizumab for NSCLC patients with liver metastasis had a significant survival benefit. There is increasing evidence that immunotherapy combined with antiangiogenic therapy has synergistic effects [45–47]. In addition to its known antiangiogenic effects, bevacizumab also inhibits vascular endothelial growth factor (VEGF), increases T cell infiltration and activates T cell responses, relieving immunosuppression, thereby further enhancing the therapeutic effect of ICIs [48,49]. In NSCLC models, immunotherapy combined with antiangiogenic therapy significantly inhibited tumor growth, whereas neither treatment alone had a significant effect [46]. These results illustrate the importance of the use of ICI combined with antiangiogenic therapy for NSCLC patients with liver metastases. However, a multidrug combination regimen may result in a high rate of grade 3 or 4 treatment-related adverse events [50]. A previous NMA showed that atezolizumab+bevacizumab+chemotherapy resulted in a significantly higher risk for serious adverse events than pembrolizumab+chemotherapy in NSCLC patients [51]. Therefore, a more tolerable yet equally effective regimen is needed. This new combination of therapies is being evaluated in many phase I clinical trials for advanced NSCLC and other solid tumors [52–55]. Importantly, the study results suggest that the combination of ICIs and antiangiogenic drugs is well tolerated. Ramucirumab plus pembrolizumab is being evaluated in patients with advanced NSCLC, gastroesophageal cancer, or urothelial carcinomas [52]. No dose-limiting toxicity has been reported in a cohort of patients with NSCLC. In a phase I advanced melanoma trial, the combination of bevacizumab and ipilimumab also yielded promising results. Among patients with metastatic melanoma, the ORR of those treated with ipilimumab and bevacizumab in combination was 19.6%, and the median OS duration was 25.1 months, nearly double that achieved in previous ipilimumab monotherapy studies [53]. These results are worth investigating to better understand the potential of combining antiangiogenic drugs with immunotherapy.
To identify the clinical factors that might influence the efficacy of ICIs, we performed a subgroup analysis. The data showed that in patients with liver metastasis, both OS and PFS improvements were observed with pembrolizumab+ chemotherapy and atezolizumab+bevacizumab+chemotherapy in the therapy line and histological analyses. The FDA-approved nivolumab+ipilimumab as a first-line treatment for metastatic NSCLC patients with tumors expressing PD-L1 (≥ 1%) and without epidermal growth factor receptor (EGFR) or anaplastic lymphoma kinase (ALK) genomic abnormalities. Our subgroup analysis showed that nivolumab+ipilimumab for NSCLC liver metastasis did not produce an OS benefit, in part due to the limited number of studies and patients included. Therefore, the subgroup analysis is insufficient to form conclusions regarding the efficacy of dual immune combination therapy for NSCLC patients with liver metastases. For the same reason, conclusions cannot be made regarding the efficacy of ICIs as a first-line treatment for patients with liver metastases. Therefore, we urgently need more clinical studies to evaluate the efficacy of dual immunotherapy in this population and determine when to treat patients with ICIs. Additionally, our study only discussed the efficacy of different drugs. Studies have shown combining radiotherapy with ICIs has a positive effect on overcoming the immunosuppressive tumor microenvironment [56–58]. The KEYNOTE-001 study [59] showed that patients with metastatic NSCLC who received radiotherapy before immunotherapy had longer PFS (4.4 months vs. 2.1 months) and OS (10.7 months vs. 5.3 months) times than patients who did not receive radiotherapy. The CheckMate 017 and CheckMate 057 trials, which allowed enrollment of patients who had received prior therapeutic radiotherapy, also demonstrated that radiotherapy before immunotherapy improved the OS rate of patients with liver metastases [30]. Antitumor immunity is a complicated process, and the future development of combination strategies is necessary to improve the efficacy of immunosuppressants. The efficacy of triple therapy with a PD-1 or PD-L1 inhibitor+ cytotoxic T lymphocyte antigen-4+a VEGF inhibitor for NSCLC liver metastases is worth investigating. Whether and when radiotherapy is combined is also worthy of attention.
We should not exaggerate the efficacy of ICIs in patients with liver metastases because the ability of ICIs to enhance the immune system may be partially offset by the relatively strong tolerance of liver metastases to therapy. This is related to the immune function of the liver itself, and patients with liver metastases are generally considered to be exempt from receiving immunotherapy. The liver is characterized as an immunosuppressive microenvironment. Interleukin-10–secreting dendritic cells, Kupffer macrophages, and sinusoidal endothelial cells can induce T cell anergy and reduce the response to individual immunotherapies [60,61]. The liver has immunoregulatory functions that maintain local and systemic immune tolerance to self-antigens and foreign antigens. The relationship between liver metastasis and CD8+ T cells suggests that peripheral tolerance induced by the liver may affect the treatment outcome [36]. The microenvironment and mechanism of liver metastases are extremely complicated. Therefore, it is of great clinical significance to investigate how to overcome the immune tolerance of liver metastases and determine effective immunotherapy strategies. Another possible explanation for the poor prognosis of immunotherapy patients with liver metastases is the mutational heterogeneity of the tumor, as the mutation spectrum of the primary tumor and metastatic foci may be different [62].
A meta-analysis conducted by Duan et al. [63] to indirectly compare the efficacy of PD-1 inhibitors and PD-L1 inhibitors showed that, compared with PD-L1 inhibitors, PD-1 inhibitors significantly improve survival outcomes. This may be related to the inherent biological differences between PD-1 inhibitors and PD-L1 inhibitors. PD-1 inhibitors can block the binding between PD-1 receptors and PD-L1 and PD-L2 ligands. In addition, PD-L1 inhibitors can only block PD-L1. When using PD-L1 inhibitors, tumors may escape the antitumor immune response through the PD-1/PD-L2 axis [64,65]. However, the efficacy of different PD-1 or PD-L1 inhibitors have not been compared in patients with NSCLC liver metastasis. Therefore, it is difficult to determine which PD-1 or PD-L1 inhibitors are more suitable for these patients, and prospective clinical studies are required.
Our research also has several limitations. First, the number of studies included in the analysis was relatively insufficient, especially in the subgroup analysis. Due to the lack of relevant literature, there are few studies on ICI monotherapy and ICIs+chemotherapy+antiangiogenic therapy. There is only one follow-up study including ICIs; thus, the results must be interpreted with caution. Second, the included study population may have had additional metastases, the impact of which was not assessed. Additionally, we cannot ignore other factors that may affect the efficacy of ICIs and the response of tumors to these drugs, such as age, sex, race, ECOG score, PD-L1 expression, and driver gene mutations. Third, the literature search was limited to studies published in English, potentially introducing language bias.
Our results indicated that pembrolizumab+chemotherapy, nivolumab, and atezolizumab+bevacizumab+chemotherapy could significantly improve OS outcomes in NSCLC patients with liver metastases. Regarding PFS outcomes, atezolizumab+bevacizumab+chemotherapy and pembrolizumab+chemotherapy ranked highest. These new findings may help clinicians better select therapeutic strategies for NSCLC patients with liver metastases. Because of the limited number of studies, our results should be interpreted with caution and need to be further validated in future head-to-head clinical trials. Meanwhile, the safety of multidrug combinations is worth considering. Furthermore, identifying the characteristics that indicate patients who will benefit the most from each treatment among those with NSCLC with liver metastases is an important direction that needs to be addressed in future prospective clinical studies.