Introduction
The number of cancer cases in Korea has continued to rise, from 154,898 in 2006 to 232,255 in 2017. Moreover, the five-year cancer relative survival rate rose from 54.0% in 2001 to 70.6% between 2012 and 2016. Cancer is a major cause of death among Koreans, and approximately 26.5% (79,153 individuals) of total deaths in Korea in 2018 were cancer-related [1]. To alleviate the high burden owing to cancer mortality, continuous monitoring of cancer incidence is essential for public health monitoring [2,3].
National Health Insurance Service (NHIS) claim data are actively used in public health research because they contain almost all medical use information that was registered during the claim process. However, health insurance claim data are intended for reimbursement and regulation of medical expenses and not for research purposes. Thus, while operational definitions of patients are important to design studies that utilize them, Michael Ranopa’s study found that the method for defining cancer cases was not clear and that a detailed list of disease codes is not publicly available [4]. Ajruche et al. [3] developed a definition of cancer patients using administrative data; however, inpatient data used by many researchers underestimated the incidence of cancer. In addition, the definition of disease code-dependence was not appropriate because surgery or subsequent examinations for prevention could be defined as cancer incidence [2–4]. Owing to these characteristics of secondary data, several studies in the England, the United States, Taiwan, and Denmark have sought to validate the clinical record data by combining the clinical record database with the cancer registry [5–8].
Defining incidence and prevalence has been a subject of interest in many studies. Defining incidence helps identify the phase of patient treatment or excludes patients with a medical history to prevent the prevalence period from affecting the study results [9,10]. Defining prevalence is important to identify patients who are actually being treated for that disease, especially in studies on medical costs or the number of patients [11]. Failure to properly define patients who are actually being treated may result in overestimation or underestimation of the number of patients who are being treated.
This study aimed to investigate the validity of cancer-related research using claim data by evaluating the accuracy of the operational definitions of cancer incidence and prevalence in administrative data. We used two methods to define cancer incidence in the NHIS data; the difference in annual diagnosis dates according to the methodology and the characteristics of cancer incidence were compared using the Korean Central Cancer Registration (KCCR)–NHIS link-ed database. Furthermore, we compared the number of patients who did not die after cancer occurrence with the number of patients using the operational definition.
Materials and Methods
1. Methods
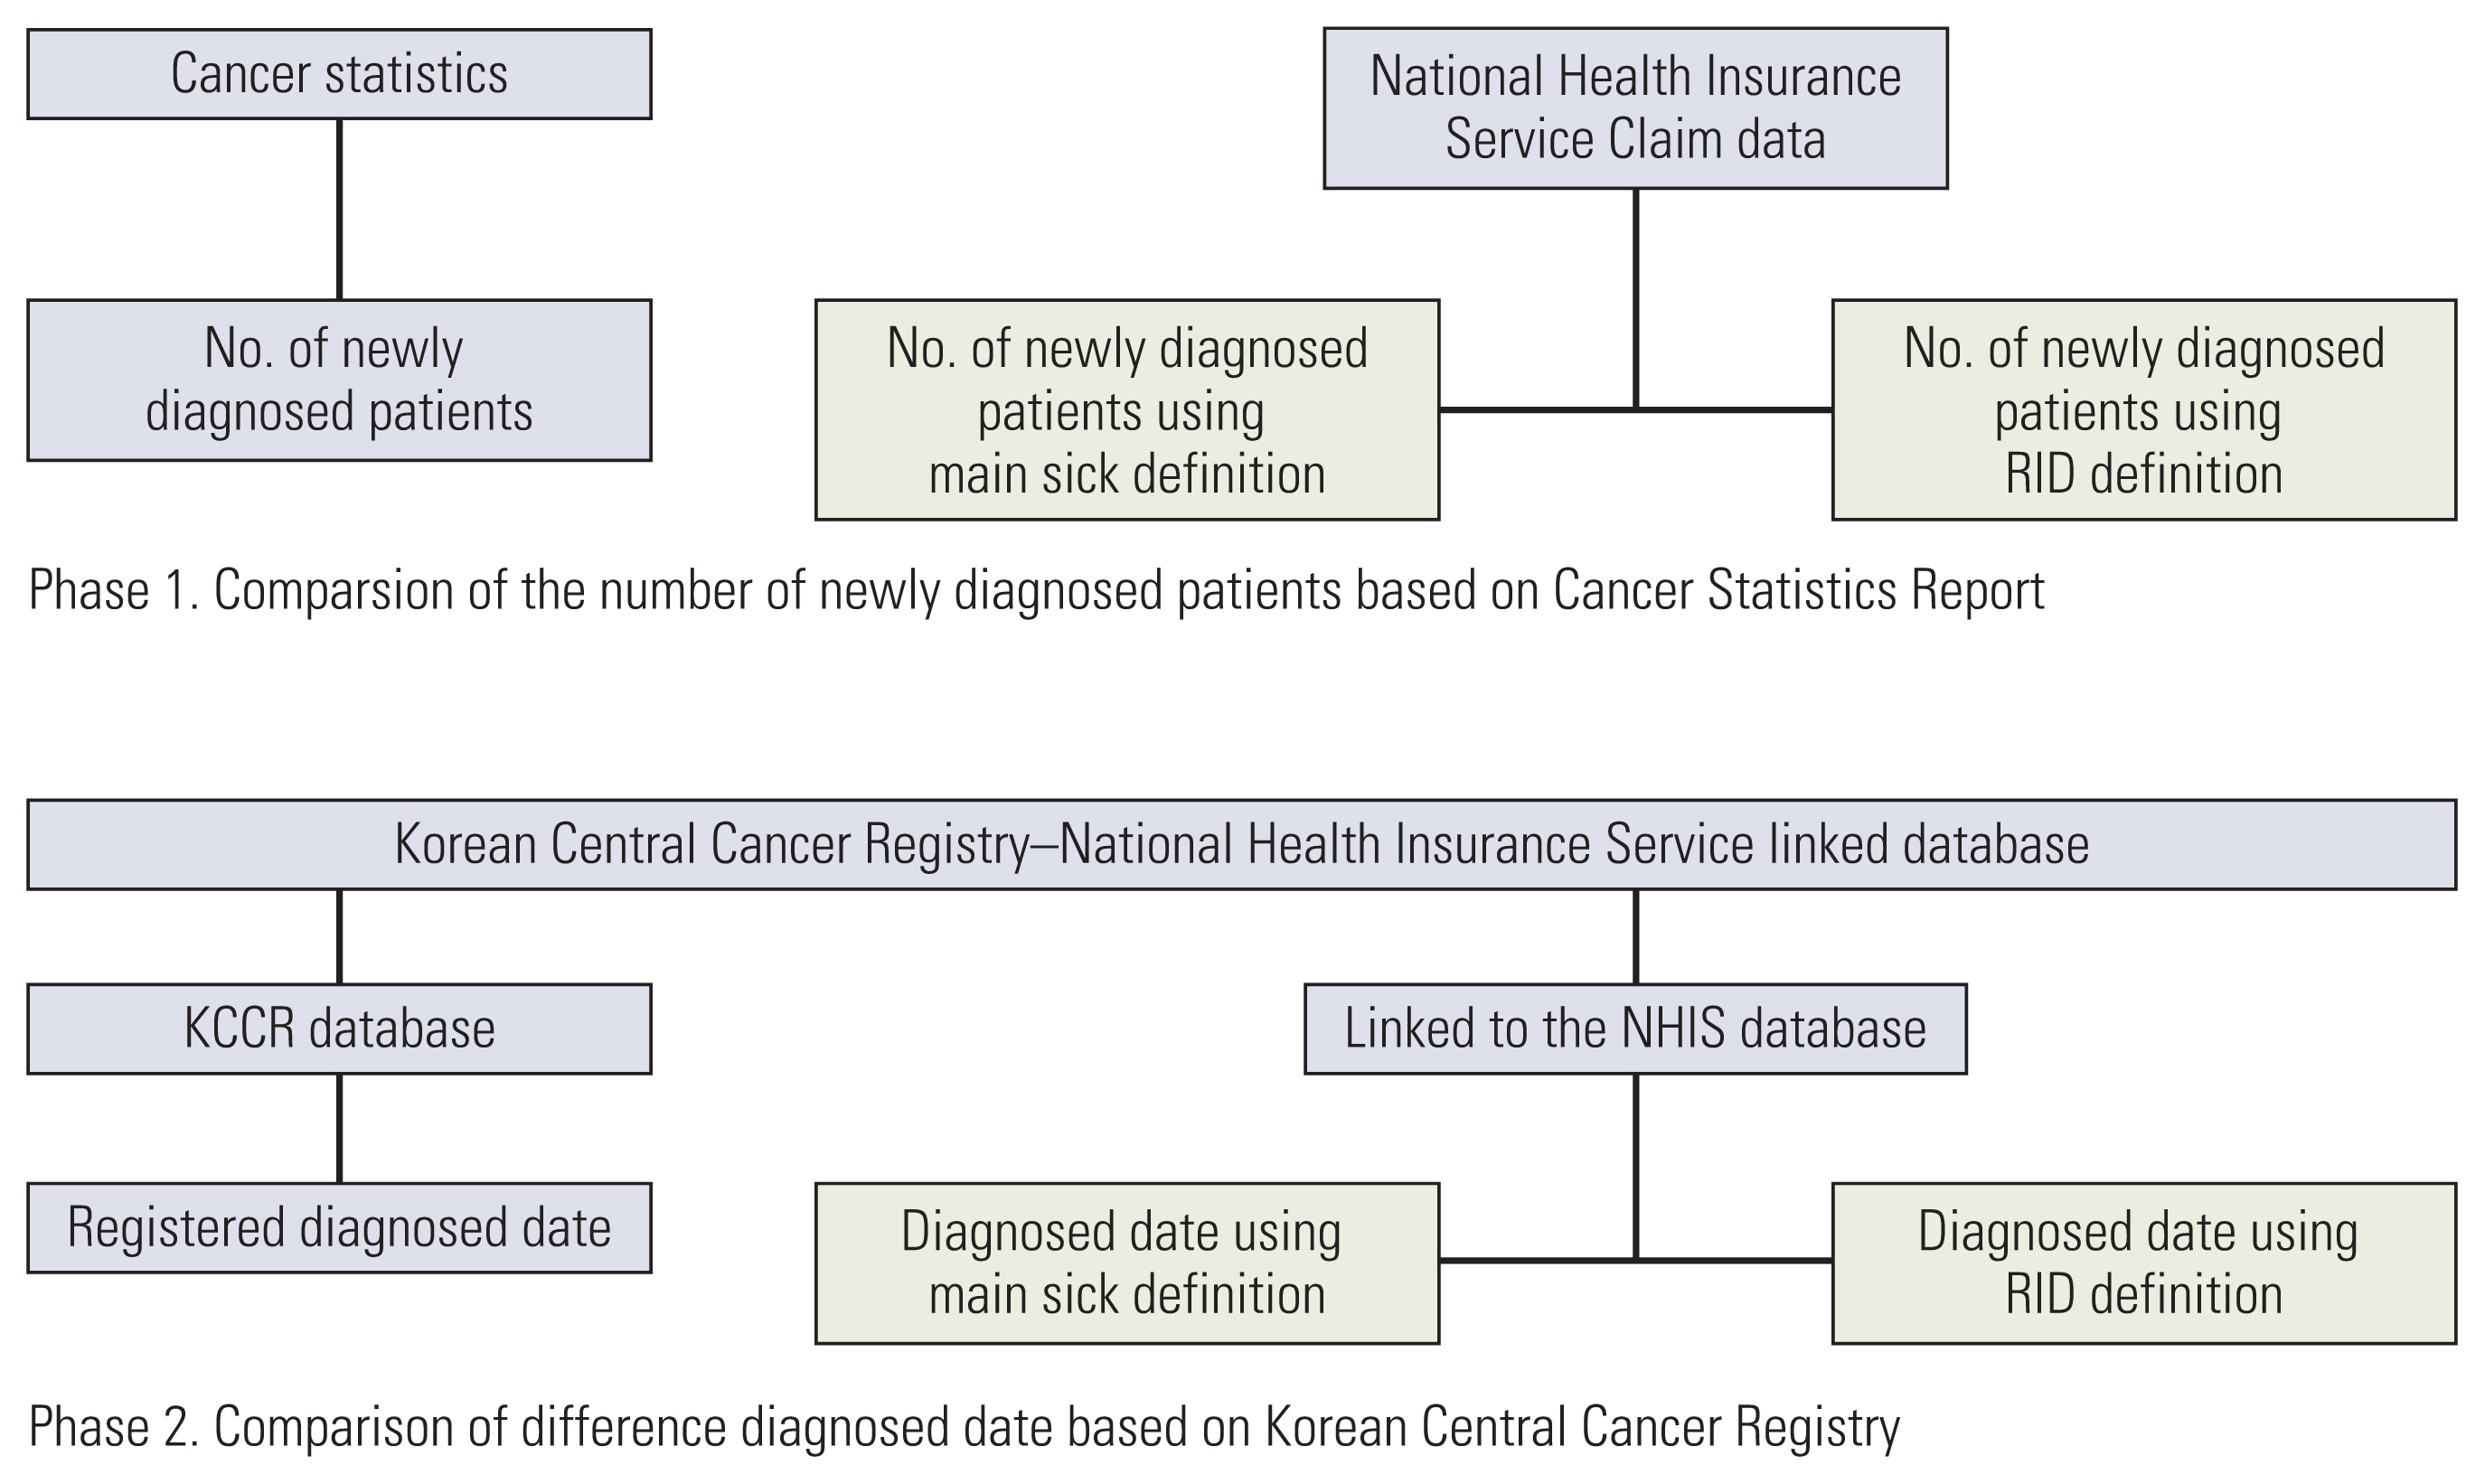
The study identified cancer occurrence in 2006, 2009, 2012, and 2015 under two operational definitions of cancer occurrence using the NHIS claim database from 2002 to 2017. In addition, the cancer occurrence derived using both methods was compared with the trend in the number of major cancer incidence in the Korean cancer statistics published in 2016 [1].
The KCCR-NHIS linked database was used to determine the number and year of diagnosis for each of the two operational definitions of cancer [12]. For each definition, we identified the number of patients whose year of cancer diagnosis by the operational definition corresponded to the KCCR year of diagnosis. To confirm the diagnosis date definition, we analyzed the difference between the date of cancer diagnosis from the KCCR data and the date of diagnosis obtained using the operational definition.
To estimate cancer prevalence, we determined the total number of patients who did not die after diagnosis. The number of patients actually being treated was compared with the total number of surviving patients (Fig. 1).
2. Data sources
The NHIS database has less information compared with the KCCR-NHIS linked database. However, the KCCR-NHIS linked database has limited accessibility owing to policy and security. In addition, the KCCR statistics publish data from the two previous years, whereas NHIS database is open to many researchers and update the database every year. Therefore, in this study, we used two data sources: the NHIS reimbursement database, which is widely used in studies as a test dataset, and the KCCR. The cancer incidence in the NHIS database with its operational definition was compared with that of the KCCR. The data used in this study included claims for International Classification of Diseases, 10th revision (ICD-10) cancer diagnosis codes (C00–C97) between 2002 and 2017 as a primary diagnosis, or claims to the NHIS for a rare and intractable disease (RID) registration.
We set 2002–2004 as the wash-out period to ensure the exclusion of patients diagnosed before 2005. The 2002–2004 period was a stricter criterion because the NHIS database started in 2002. In the NHIS database, we analyzed cancer incidence in 2006, 2009, 2012, and 2015 using the operational definition and compared it with the number of diagnosed patients by year in the KCCR.
The second dataset was the KCCR-NHIS database established through a Memorandum of Understanding between the National Cancer Center and the NHIS Health Insurance Policy Institute. This dataset includes > 98% of cancer patients diagnosed and registered in the KCCR, with each registered cancer patient linked by a randomly assigned individual identification number. Therefore, it was used as reference dataset to measure the accuracy of the operational definition for patients with actual diagnosis and registered cancer.
In the KCCR-NHIS database, KCCR-registered patients were matched to the NHIS claim data by anonymized individual numbers. The cancer types were defined as the seven major cancers based on their incidence rates in South Korea: stomach, liver, colorectal, lung, breast, cervix, and prostate cancer. To compare the trends before and after the Benefit Enhancement Act conducted in 2006 and 2010, we analyzed data for 2006, 2009, 2012, and 2013. Because the KCCR-NHIS data contain patients diagnosed cancer between 2001 and 2013, 2013 was included in the analysis to verify the accuracy of the operational definition in the last year of the follow-up.
Our study consisted of three steps. First, differences in cancer incidence were identified in the NHIS database: the major cancer incidence by year and cancer type was compared to that of the KCCR statistics. Second, the KCCR-NHIS linked database was used to calculate the sensitivity of the operational definition, which was determined by analyzing the percentage of all registered patients of the same cancer type. Lastly, dates of diagnosis using the operational definition were compared to those of the KCCR-NHIS database. In addition, we classified the patients in groups based on days of diagnosis date differences.
3. Definition for cancer occurrence using primary diagnosis
In the NHIS database, the major disease that led the patient to seek medical attention is recorded as primary diagnosis. Our first operational definition used to confirm cancer occurrence was the primary diagnosis in the NHIS claim data. In the NHIS claim data, a person who was an outpatient three times or was hospitalized once within the first year of the claim with the same cancer was defined as a newly diagnosed cancer patient.
4. Definition of cancer occurrence using the RID registry
The second operational definition for cancer occurrence used the RID claim. Briefly, newly diagnosed cancer patients are registered with the RID program for at least five years to reduce their medical expenses. Therefore, most cancer patients can be found in the RID registry. We declared the first RID claim and primary diagnosis (cancer) as cancer occurrence.
Using these two definitions, we identified the incidence of the seven major cancers in 2006, 2009, 2012, and 2015 and compared them to the 2016 National Cancer Registry Statistics Report.
5. Date of cancer diagnosis by operational definitions
Since the NHIS claim database does not include variables such as diagnostic date, KCCR-NHIS linked data was utilized to prepare criteria for the comparison of date of diagnosis. The date of cancer diagnosis in the KCCR-NHIS linked data is recorded as the date on which the cancer occurred in patients with confirmed cancer according to the cancer registration guidelines of the Korea Central Cancer Registration Program, which has more information than the date of diagnosis (according to the operational definition). Two definitions were used in the KCCR-NHIS database to analyze accuracy of the date of diagnosis. The date of the initial cancer treatment was defined as the date of diagnosis by the operational definitions. To determine the match between the defined patients and the KCCR-registered patients, sensitivity and specificity were calculated.
6. Statistical analysis
The incidence of operational definitions and cancer statistics was compared by frequency analysis (Table 1). Sensitivity and specificity of operational definition was analyzed using senspec option (Table 2). The consistency of diagnosis year between definition was analyzed using crossover analysis (Table 3). All analyses were performed using SAS ver. 9.4 (SAS Institute Inc., Cary, NC).
Results
1. Number of cancer occurrences according to the two operational definitions: primary diagnosis and RID claims
Cancer registration statistics showed that the highest number of cases per year was for stomach cancer, with 26,460 cases in 2006, 30,040 cases in 2009, 31,133 cases in 2012, and 29,337 cases in 2015. The lowest incidence of cases was for cervical cancer, with 4,064 in 2006, 3,832 cases in 2009, 3,664 cases in 2012, and 3,616 cases in 2015 (Table 1).
We observed that the maximum difference between the number of occurrences according to the cancer registration statistics and according to the operational definitions of cancer (Table 1) occurred in cervical cancer cases in 2006 (n=1,053, 26.9%). The maximum difference in the number of occurrences according to the RID-based definition and according to the cancer registration statistics was observed in cervical cancer cases i.e., 2,185 cases (53.8%). The least difference in the number of cases between data from primary diagnosis-based definition and cancer registration statistics was observed in colorectal cancer cases with 168 cases (0.6%) in 2012, followed by 258 cases (1.3%) of lung cancer in 2009 and 690 cases (2.4%) of colorectal cancer in 2015.
The difference in occurrence between the cancer registration statistics data and the RID claims-based data was very small for the following cancers: one (0.0%) for lung cancer in 2012, 61 (0.2%) for colorectal cancer in 2009, and 87 (0.3%) for colorectal cancer in 2012.
2. Sensitivity and positive prediction of the operational definitions
Sensitivity assessment (Table 2) revealed that the primary diagnosis-based definition was 97.9% for breast cancer (95% confidence interval [CI], 97.8 to 98.0), 96.0% sensitive for stomach cancer (95% CI, 96.0 to 96.1), 95.0% for lung cancer (95% CI, 94.8 to 95.1), 94.7% for prostate cancer (95% CI, 94.5 to 94.9), 93.8% for cervical cancer (95% CI, 93.6 to 94.1), 92.2% for liver cancer (95% CI, 92.0 to 92.3), and 91.5% for colorectal cancer (95% CI, 91.4 to 91.7). The sensitivity of the RID claims-based definition was as follows: 98.1% for breast cancer (95% CI, 98.0 to 98.2), 95.7% for stomach cancer (95% CI, 95.7 to 95.8), 95.3% for prostate cancer (95% CI, 95.1 to 95.5), 94.4% for cervical cancer (95% CI, 94.1 to 94.7), 93.1% for lung cancer (95% CI, 93.0 to 93.3), 92.3% for colorectal cancer (95% CI, 92.2 to 92.4), and 91.9% for liver cancer (95% CI, 91.7 to 92.0).
Sensitivity of the primary diagnosis-based definition was the highest in breast cancer cases (97.9%, 95% CI, 97.8 to 98.0) and the lowest in colorectal cancer cases (91.5%, 95% CI, 91.4 to 91.7). The RID claims-based definition showed the highest sensitivity for breast cancer cases (98.1%; 95% CI, 98.0 to 98.2), whereas the lowest sensitivity for liver cancer cases (91.9%; 95% CI, 91.7 to 92.0).
Positive predictions as per the primary diagnosis-based definition were as follows: stomach cancer, 94.1% (95% CI, 94.0 to 94.2); colorectal cancer, 92.4% (95% CI, 92.2 to 92.5); prostate cancer, 91.9% (95% CI, 91.7 to 92.1); breast cancer, 91.4% (95% CI, 91.3 to 91.6); lung cancer, 88.9% (95% CI, 88.8 to 89.1); liver cancer, 85.6% (95% CI, 85.4 to 85.8); and cervical cancer, 81.8% (95% CI, 81.3 to 82.2). Positive predictions for the RID claims-based definition were as follows: stomach cancer, 93.9% (95% CI, 93.8 to 94.0); prostate cancer, 93.7% (95% CI, 93.5 to 93.9); colorectal cancer, 91.8% (95% CI, 91.6 to 91.9); lung cancer, 90.2% (95% CI, 90.1 to 90.4); breast cancer, 89.6% (95% CI, 89.4 to 89.7); liver cancer 86.0% (95% CI, 85.8 to 86.1); and cervical cancer, 76.3% (95% CI, 75.9 to 76.8). The highest number of positive predictions as per the primary diagnosis-based definition was for stomach cancer cases (94.1%; 95% CI, 94.0 to 94.2) and the lowest number was for cervical cancer cases (81.8%; 95% CI, 81.3 to 83.2). The highest number of positive predictions according to the RID claims-based definition was in case of stomach cancer (93.9%; 95% CI, 93.8 to 94.0) and the lowest was in case of cervical cancer (76.3%; 95% CI, 75.9 to 76.8).
3. Consistency of cancer incidence
Diagnosis year variables in the KCCR-NHIS database were used to analyze occurrences in 2006, 2009, 2012, and 2013 in accordance with the definition of occurrence that corresponded to the registered patients in that year (Table 3). In case of both operational definitions, the year of diagnosis in more than 80% of patients in all cancer types matched with the year of cancer registration data. The consistency of the diagnosed year between cancer registry and primary diagnosis-based definition was as follows: stomach cancer, 88.3% for liver cancer, 82.6% for colorectal cancer, 85.9% for lung cancer, 87.0% for breast cancer, 90.4% for cervical cancer 85.2%, and 81.4% for prostate cancer. Consistency of the year of diagnosis between the cancer registry and the RID definition was 88.6% for stomach cancer, 81.1% for liver cancer, 86.8% for colorectal cancer, 84.5% for lung cancer, 91.8% for breast cancer, 86.9% for cervical cancer, and 83.1% for prostate cancer. The consistency in diagnosis year was higher in 2013 than in 2006, 2009, and 2012; in 2013, the highest consistency of diagnosis year was found in breast cancer cases, with 92.3% consistency as per the data based on the primary diagnosis definition and 95.0% as per the RID claims-based definition. Comparing the proportion of the patients with matched-year of diagnosis, consistency was higher in 2006 in liver cancer (82.6%) and lung cancer (87.0%) as per the primary diagnosis-based definition. Since 2009, however, the proportion of patients with matched-year of diagnosis was high in all cancer types according to the RID claims-based definition.
4. Difference in date of cancer diagnosis
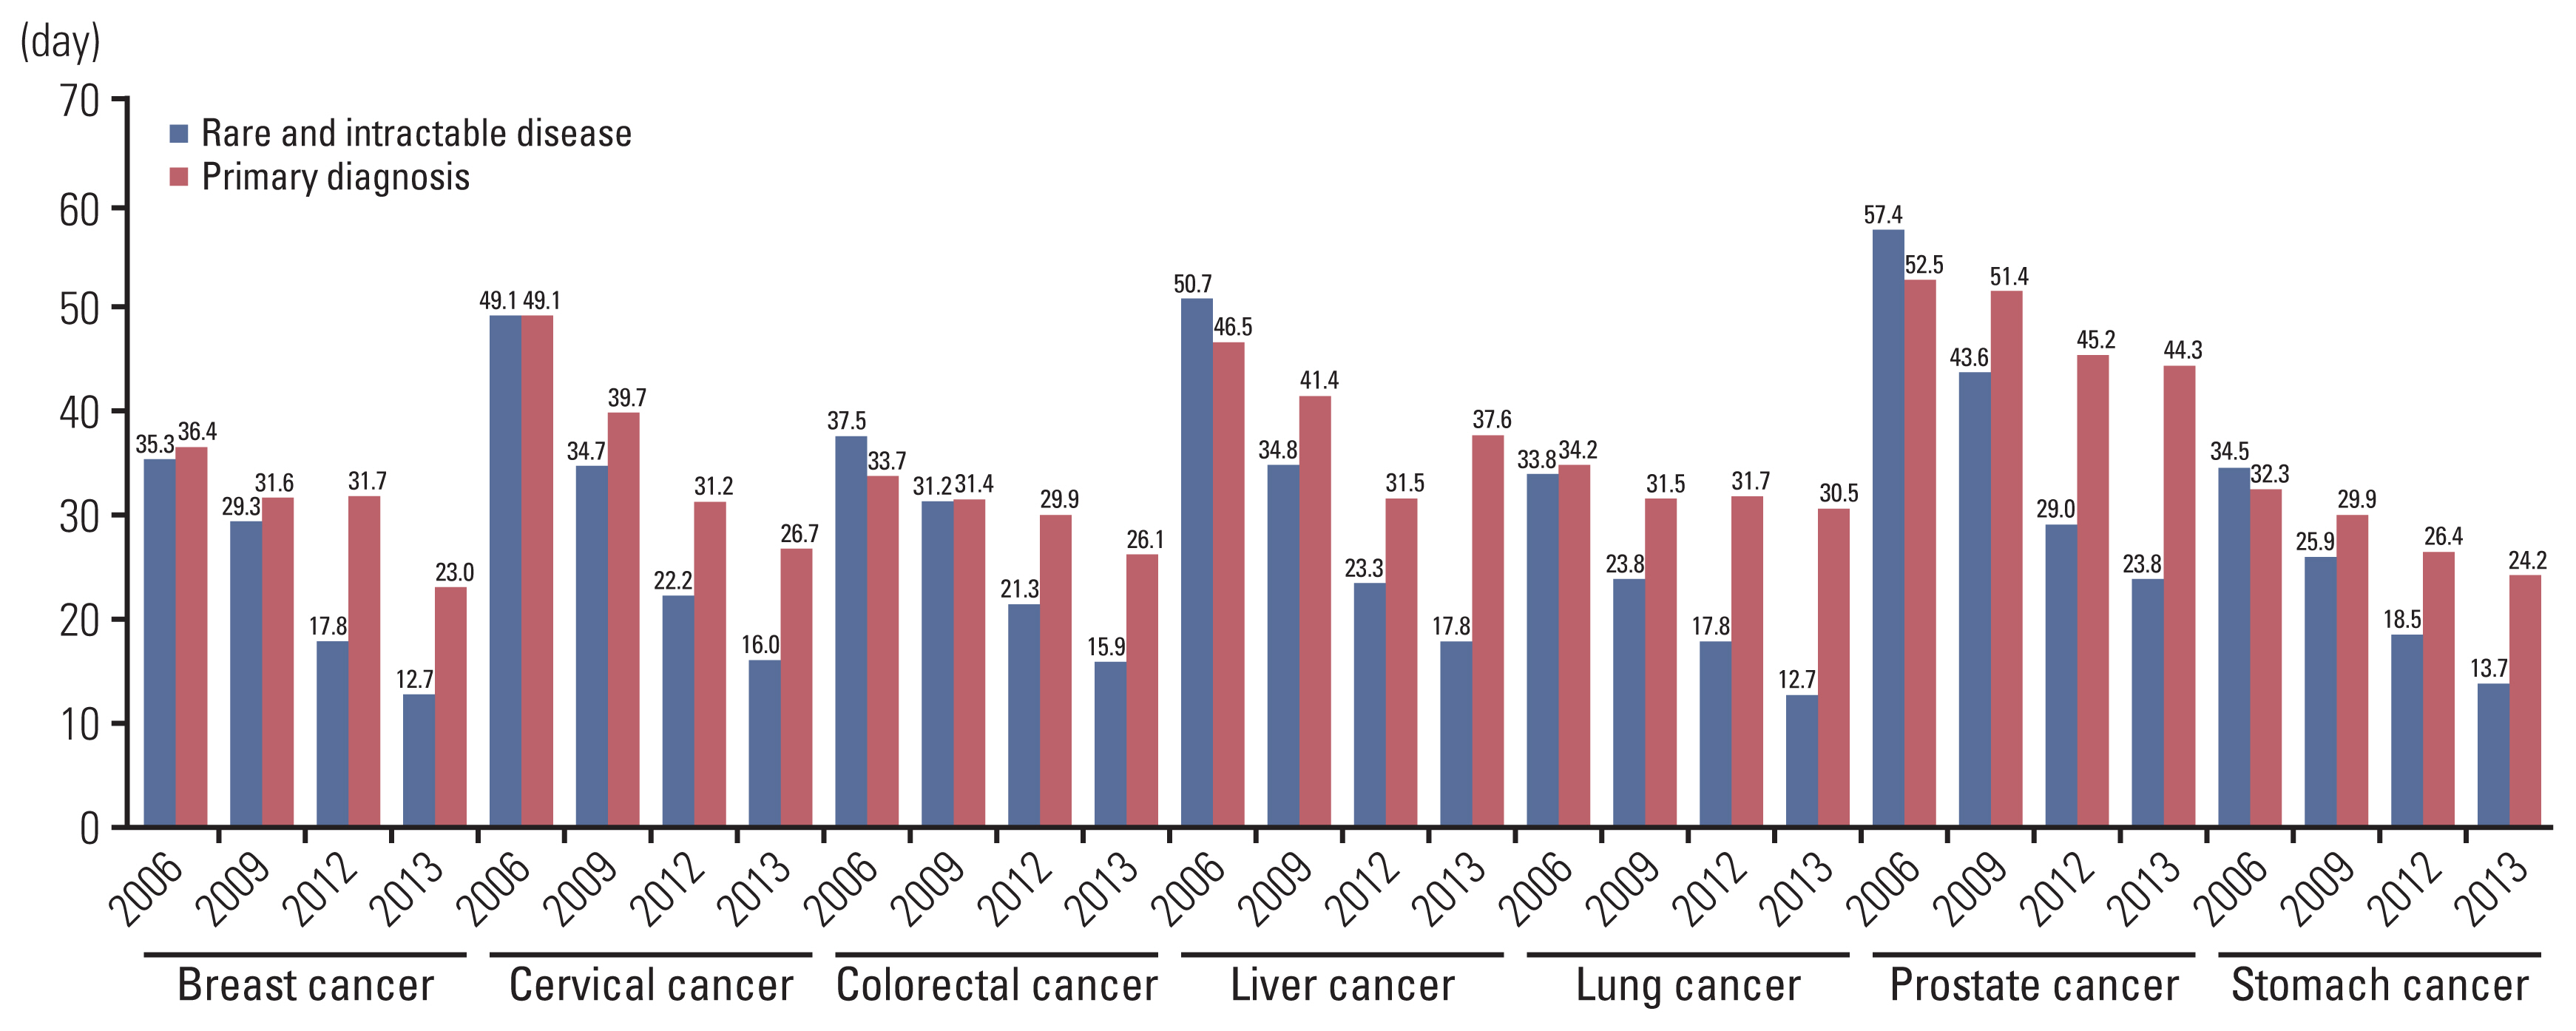
When comparing the difference between the average diagnosis date of cancer and the diagnosis date based on the definition of cancer occurrence (Fig. 2), breast cancer cases in 2013 showed the smallest difference with an average of 23 days, and prostate cancer cases showed the largest difference in 2006 with 52.5 days. The RID claims-based definition had significantly different data from that of the primary diagnosis definition data in all cancer types except lung cancer (33.8 days) and breast cancer (35.3 days) in 2006, with prostate cancer cases being the most different at 57.4 days. However, in 2013, the RID claims-based definition showed a difference of 13.7 days for stomach cancer, 17.8 days for liver cancer, 15.9 days for colorectal cancer, 12.7 days for lung cancer, 12.7 days for breast cancer, 16.0 days for cervical cancer, and 23.8 days for prostate cancer.
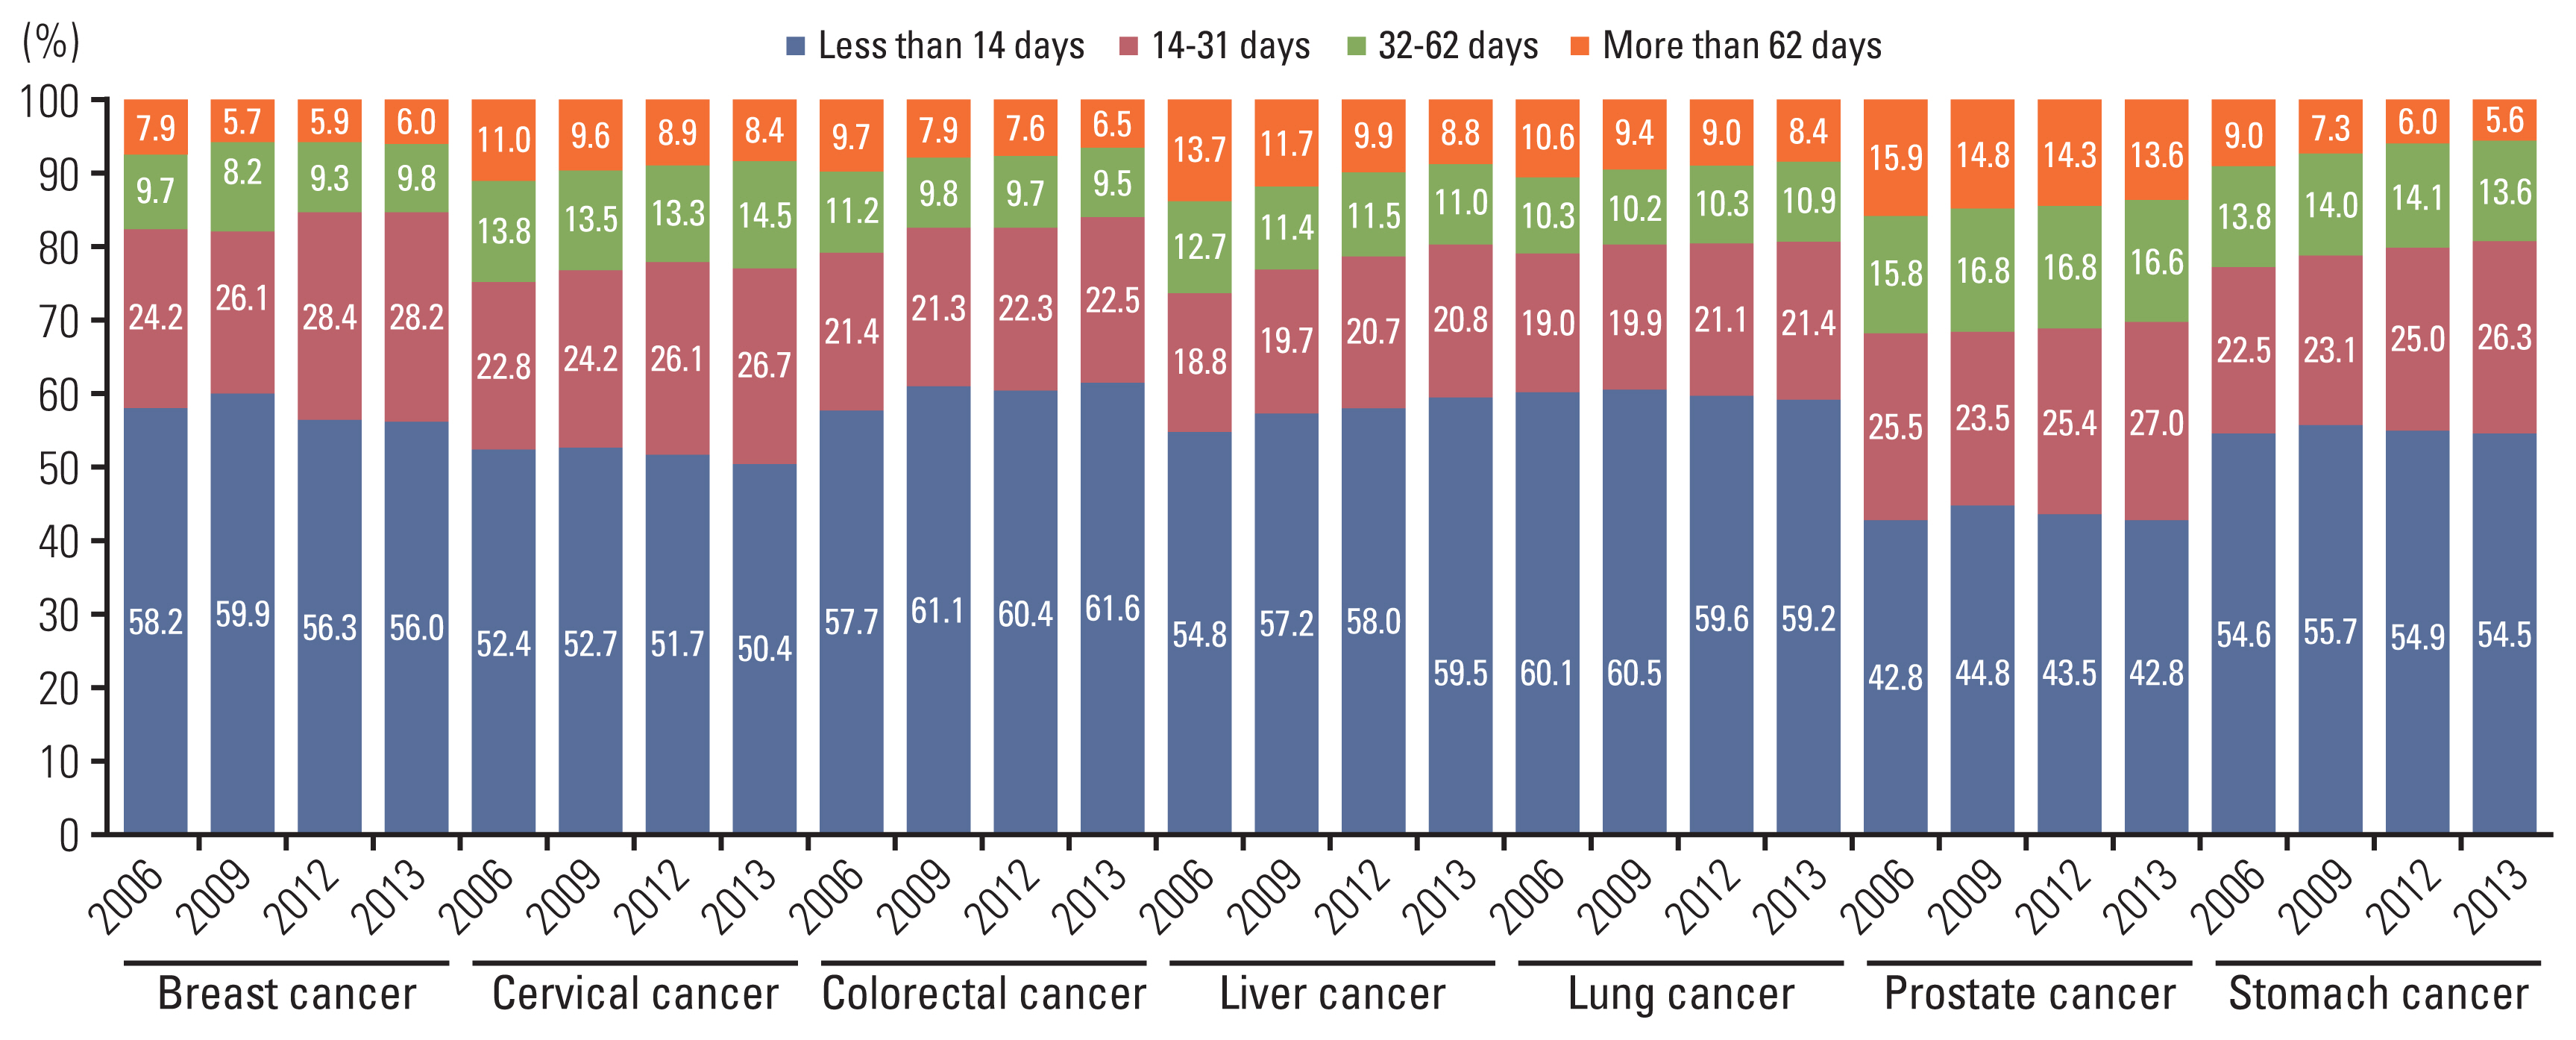
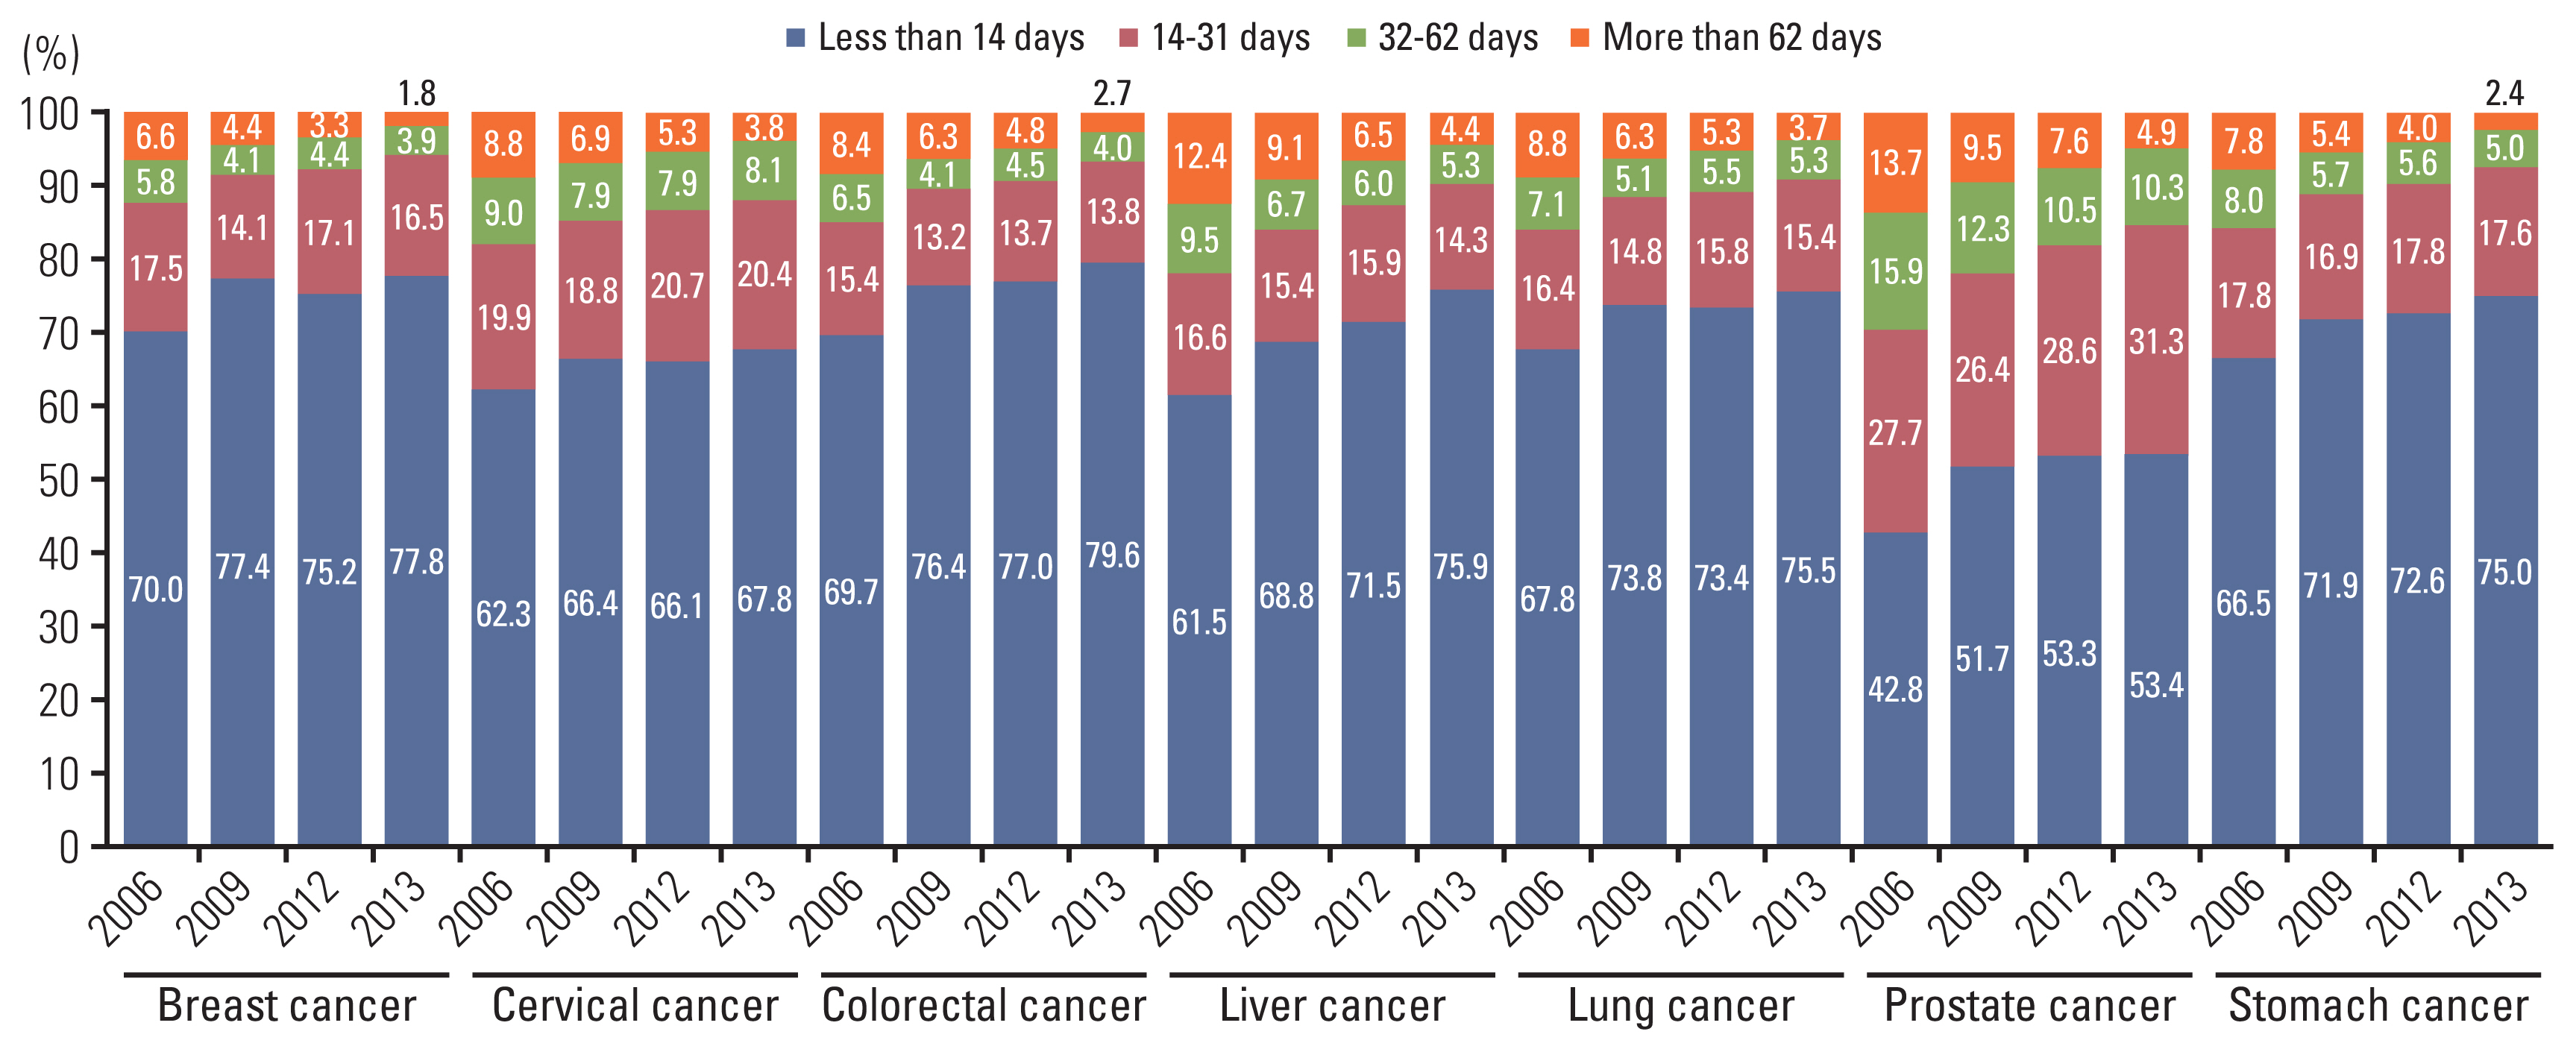
As of 2013, the difference in diagnosis date of each patient was divided into different categories according to the number of days (Fig. 3), and RID claims-based definition showed that more than 70% of all cancer types, except cervical and prostate cancer, showed a difference of less than 14 days. According to the primary diagnosis-based definition, more than 50% of almost all cancer types, except prostate cancer, showed a difference of less than 31 days (Fig. 4).
Discussion
This study identified the sensitivity of the methodology to for defining cancer incidence in cancer studies using health insurance claim data and determined the accuracy of cancer diagnosis date according to two definitions. Both definitions showed over 90% sensitivity in identifying patients with central cancer registration and 80% consistency between cancer registry data and operational definitions in comparison with cancer incidence years. In particular, when RID claims-based definition was used, the accuracy increased after 2005, when the program was first implemented. And accuracy of definition was different by cancer type. The reason of difference can be better survival rate. Actually, breast, cervix and prostate cancer show over 80% 5-year survival rate. Or it can be caused by fewer cases compared to other cancers. The correlation can be confirmed by further analysis of rare cancers in future studies. The consistency rate of diagnosis year was higher in 2006, 2009, 2012, and 2013, except for 81.1% of liver cancer cases and 84.5% of lung cancer cases in 2006, in the data according to the RID claims-definition as compared with that according to the primary diagnosis-based definition.
1. Meaning of the study
Through this study, we validated two limitations of the claim database and confirmed the feasibility of using claim data for cancer-related research. The first limitation of claim data is that it is not clinical data and is analyzed using operational definitions. If the operational definition is not properly defined, researchers cannot identify their study subject. High sensitivity of the definition is paramount while conducting research on critical and treatable diseases like cancer [5]. Therefore, sensitivity of operational definitions must be ensured to perform cancer-related studies using claim data. Existing cancer studies have defined cancer patients using operational definitions based on RID claims or primary diagnosis [13,14]. Our study shows that an operational definition using RID and primary diagnosis claim had high sensitivity and accuracy. However, a study by Regan et al. showed false positives according to a definition of cancer occurrence based on relevant alarm symptoms [5]. This is consistent with our results of comparing the number of occurrences using operational definition and cancer registration statistics report over four years (2006, 2009, 2012, and 2015).
The second limitation is that there are no diagnosis date variables in NHIS data. To conduct research related to cancer incidence was difficult because of this limitation. Date of diagnosis for cancer patients is clinically important. Tsai et al. [15] analyzed the differences in prognosis in small-cell lung cancer patients owing to treatment delays and showed that the diagnosis and treatment start dates are among the most important variables that affect the survival rate of patients. A study by Chen et al. [16] showed that a delay in treatment of cancer patients leads to worse prognosis. According to the characteristics of the disease, the United Kingdom National Health Service has developed the following criteria for each stage from diagnosis to treatment initiation: within 14 days, 14 to 31 days, and 32 to 62 days. However, it is difficult to accurately estimate a patient’s clinical characteristics if the time of occurrence is inaccurate in the claim data.
NHIS data only contains the visit date or claim date of the first claim of the disease instead of the actual diagnosis date, and claim codes can be recorded inaccurately. Therefore, it is necessary to verify the accuracy of the operational definition of cancer patients using the claim data. For cancer registration data, the diagnostic date is registered as the most appropriate date for cancer diagnosis according to the cancer registration guidelines. We compared diagnosis date from cancer registration data with the diagnosis date as per each operational definition; it is possible to determine the reliability of an operational definition. In this study, most patients had fewer than 31 days differences between registered date of diagnosis and operational definition in KCCR-NHIS linked database. In addition, the diagnosis date using both definitions compared with the time of cancer registration was confirmed to be accurate over time. This may result from the accumulation of data, which more accurately excludes patients who cannot be seen as newly diagnosed. In particular, the RID claims-based definition was more accurate after 2005 when the RID program began, and in 2013, the diagnosis day difference of all cancer types was smaller than that of the definition using the disease. Kim et al. [17] also showed that the accuracy of disease occurrence varies according to the look back period setting of the disease. This suggests that sufficiently large observation periods are needed to define the incidence.
Kao et al. [8] used Taiwan’s health insurance data to compare survival rates with national cancer registration data and concluded that although health insurance data and cancer registration data are generally consistent, the data should be carefully used for research, based on the discharge of the two datasets. Wu et al. [2] reported that out of the three methods used in their study based on medical records and discharge summaries of the Cancer Registry, incidence of pancreatic cancer was the most accurate. Our study also used both claim data and cancer registry data.
2. Differences from other studies
Kim et al. [12] defined cancer patients using the sickness code (ICD-10) and inpatients in the NHIS-National Sample Cohort (NHIS-NSC) and compared the number of cancer patients and patient characteristics according to each definition with the figures in cancer registration statistics. In stomach cancer, liver cancer, lung cancer, breast cancer, cervical cancer, and prostate cancer cases, they defined the most appropriate cases as hospitalization for the primary diagnosis, and colorectal cancer cases were hospitalized for a sub sickness. However, in the above study, only 2% of the nation’s population was targeted because a NHIS-NSC was used, and there were limitations that could not be confirmed for the RID claims. In our study, we used the KCCR database, which contained a register of 98% of cancer patients, and the NHIS database, which contained every claim for cancer treatment and evaluated the validity of the RID claim not included in NHIS-NSC.
3. Limitations
Although the validity of the claim data has been verified, there are certain limitations in this study. First, the accuracy in different cancer types differed owing to the use of a universal operational definition applicable to all cancer types. This can be overcome by combining specific treatment codes for each cancer type, such as those used in the study by Couris et al. [18]. However, these methods can reduce sensitivity and, therefore, should be chosen by the researcher based on the purpose of the study. Second, claim data cannot be used without taking into account the health care system because it is affected by health care policies. In the case of an RID claim, at the time of program implementation, patients before diagnosis were registered retroactively. Therefore, some patients received first RID claims after a year of diagnosis. This could have led to relatively low diagnosis date accuracy in 2006. This discrepancy could change with modifications in future policy. Therefore, for studies that take place over a long period, including the period before the implementation of the RID program, the primary diagnosis-based patient definition may be more appropriate than the RID claims-based definition. Furthermore, the NHIS-KCCR linked data used in this study were linked only to health insurance claims for patients registered with the KCCR, so claims for unregistered patients were not available for analysis, and recurrent patients were not identified through the claim data.
The NHIS database and an operational definition to identify patients are appropriate for use in cancer-related studies. Accuracy of claim data improved over time, although accuracy of operational definition differed by cancer type. For certain types of cancer or group of patients, additional detailed definitions may be required to provide more accurate patient identification.