Introduction
Breast cancer is the most common malignancy in women worldwide. Approximately 5%–8% of patients with breast cancer are initially diagnosed with distant metastases, known as de novo metastatic breast cancer (dnMBC) [1]. While dnMBC itself is considered incurable, advances in systemic agents in the last 25 years have prolonged survival in patients with metastatic breast cancer [2]. As 25% of patients survive for > 5 years, the concept of dnMBC as a chronic disease for this subgroup of patients has emerged [3].
Locoregional treatment (LRT) including primary tumor resection (PTR) and/or radiotherapy (RT) has arisen not only for local control but also for improving survival. However, this use remains controversial, and there are no clear guidelines. Three prospective randomized controlled trials (RCTs) have compared PTR to systemic therapy alone [4–6], only one of which reported the benefit of PTR [5]. Early results from the ECOG-ACRIN research group did not demonstrate the benefit of early PTR; however, further data are awaited [7].
Despite conflicting results from RCTs, 35%–80% of patients with stage IV breast cancer undergo PTR [8,9]. Accordingly, the incidence of postoperative radiotherapy (PORT) has also increased [10]. Unlike PTR, there is little data on the efficacy of PORT in dnMBC. Among the three RCTs, only that by Soran et al. [5] reported the impact of PORT. Among patients who underwent mastectomy, 38% also received PORT, with no difference in overall survival (OS) between patients who did and did not receive PORT. In contrast, a retrospective study reported that PORT was a significant predictor of OS and progression-free survival (PFS) [11].
To reveal the effects of PORT, this retrospective multicenter study investigated a cohort of patients with dnMBC who underwent PTR. We also aimed to identify the subset of patients that would most benefit from PORT.
Materials and Methods
Data from patients who were diagnosed with dnMBC and underwent PTR between October 2000 and December 2015 at 15 cancer centers were retrospectively analyzed. Patients with (1) palliative surgery due to bleeding, necrosis, or infection; (2) progression after preoperative chemotherapy or within 2 months after PTR; (3) bilateral breast cancer; (4) no information on RT; and (5) double primary cancer other than thyroid or skin cancer were excluded. Finally, a total of 426 patients were enrolled.
Staging was performed based on the American Joint Committee on Cancer 7th edition. The initial workup modalities included physical examination, mammography, ultrasound, pathologic confirmation, chest computed tomography (CT), and abdominopelvic CT. Brain imaging was additionally performed in patients with symptoms suggestive of central nerve system involvement. 18-Fluoro-deoxyglucose positron emission tomography (FDG-PET) was optional, but most patients underwent FDG-PET CT (50.2%) or FDG-PET alone (35.9%). Biopsy confirmation for metastatic sites was performed in 19.0% of patients. Metastatic burden was categorized according to (1) number (≤ 5 or > 5) and (2) single, oligo, and disseminated categories according to Kobayashi et al. [12], who defined oligometastases as follows: (1) involvement of ≤ 2 organs other than the breast and its regional lymph nodes (LNs), (2) ≤ 5 metastases per organ (≤ 10 in patients with tiny, unclear lesions in the lungs and/or bones), and (3) lesion size ≤ 5 cm.
Multidisciplinary teams including a surgeon, a medical oncologist, a radiation oncologist, and a radiologist developed the management plans. The surgeon determined the types of PTR and nodal evaluation (axillary LN dissection, sentinel LN biopsy, or none) based on individual tumor and patient characteristics. Preoperative and/or postoperative chemotherapy was administered to selected patients. Based on immunohistochemistry (IHC) markers of estrogen receptor (ER), progesterone receptor (PR), and human epidermal growth factor 2 (HER2), hormonal therapy and/or anti-HER2 therapy (trastuzumab and/or pertuzumab) were administered. IHC types were defined as follows; (1) luminal A (ER and/or PR positive, but HER2 negative), (2) luminal B (ER and/or PR positive, and HER2 positive), (3) HER2-enriched (ER and PR negative, but HER2 positive) and (4) triple-negative. Treatment responses were assessed according to the Response Evaluation Criteria in Solid Tumors ver. 1.1 [13]. After treatment, patients were routinely followed up every 3 months with relevant imaging modalities.
The primary outcome of the present study was 5-year OS. The secondary endpoint was 5-year PFS. Progression included locoregional recurrence (LRR), a failure in the breast/chest wall or regional nodal areas, and distant progression (DP), the appearance of any new lesions, and/or a ≥ 20% increase in the sum of the diameters of the target metastatic lesions compared to the last preoperative measurements. Follow-up durations and survivals were calculated from the date of PTR.
The characteristics of patients in each treatment arm were compared using Student’s t tests. Univariate and multivariate analyses were performed using Cox proportional hazards models. Backward elimination Cox regression was used for multivariate analysis. Factors with p ≤ 0.2 in univariate analysis were included in the multivariate analysis. The Kaplan-Meier method was used to estimate survival. To identify the subgroup of patients who most benefited after PORT, univariate and multivariate analyses were also performed among patients who received PORT. Using the statistically significant factors, we defined subgroups and compared the primary and secondary endpoints between patients who did and did not receive PORT. All statistical analyses were performed using Web-R ver. 3.4.1 (http://web-r.org), a web-based statistical analysis program.
Results
Among the 426 patients, 176 and 250 patients received PTR alone and PORT, respectively. The characteristics of the patients according to PORT are listed in S1 Table. The PORT group included more patients with unfavorable prognostic factors (advanced nodal stage and metastatic sites other than bone), and favorable factors which represented a limited burden of metastases (single or oligometastases, and ≤ 5 metastases). Moreover, the following treatments were more prevalent in the PORT group: preoperative chemotherapy, breast-conserving operation, hormonal therapy, and intervention (surgery and/or radiotherapy) to all metastatic lesions within 3 months. Detailed information on the PORT group is summarized in S2 Table. Briefly, the median dose irradiated to breast/chest wall and supraclavicular lymph node was 50.4 Gy with a median fraction size of 1.8 Gy. Most patients (87.6%) received the supraclavicular LN irradiation, and among them, 40.8% also underwent irradiation of the internal mammary LN.
The median follow-up time was 53.7 months (range, 3.1 to 194.4 months). The 5-year OS and PFS of the overall patient population were 73.2% (S3A Fig.) and 32.0% (S3B Fig.), respectively. Univariate and multivariate analyses for OS and PFS were performed for the overall patient population (Table 1). Multivariate analyses revealed advanced T category, > 5 metastases, triple-negative breast cancer (TNBC), and postoperative chemotherapy as significant poor prognostic factors for OS. However, PORT failed to show any significance. Regarding PFS, PORT was a favorable prognostic factor (hazard ratio [HR], 0.64; 95% confidence interval [CI], 0.50 to 0.82; p < 0.001), in addition to T1/2 category, ≤ 5 metastases, and non-TNBC IHC subtypes.
Univariate and multivariate analyses of patients who had undergone PORT were performed to identify the subgroup of patients that had most benefited from PORT (S4 Table). Multivariate analyses of OS revealed that clinical T3/4 category and TNBC were poor prognostic factors. Analysis of PFS, revealed significant associations for > 5 metastases, T category, and TNBC. Based on these findings, we divided the patients into three groups: group 1, T1/2 and non-TNBC (n=193); group 2, T3/4 and non-TNBC (n=171); and group 3, TNBC (n=49).
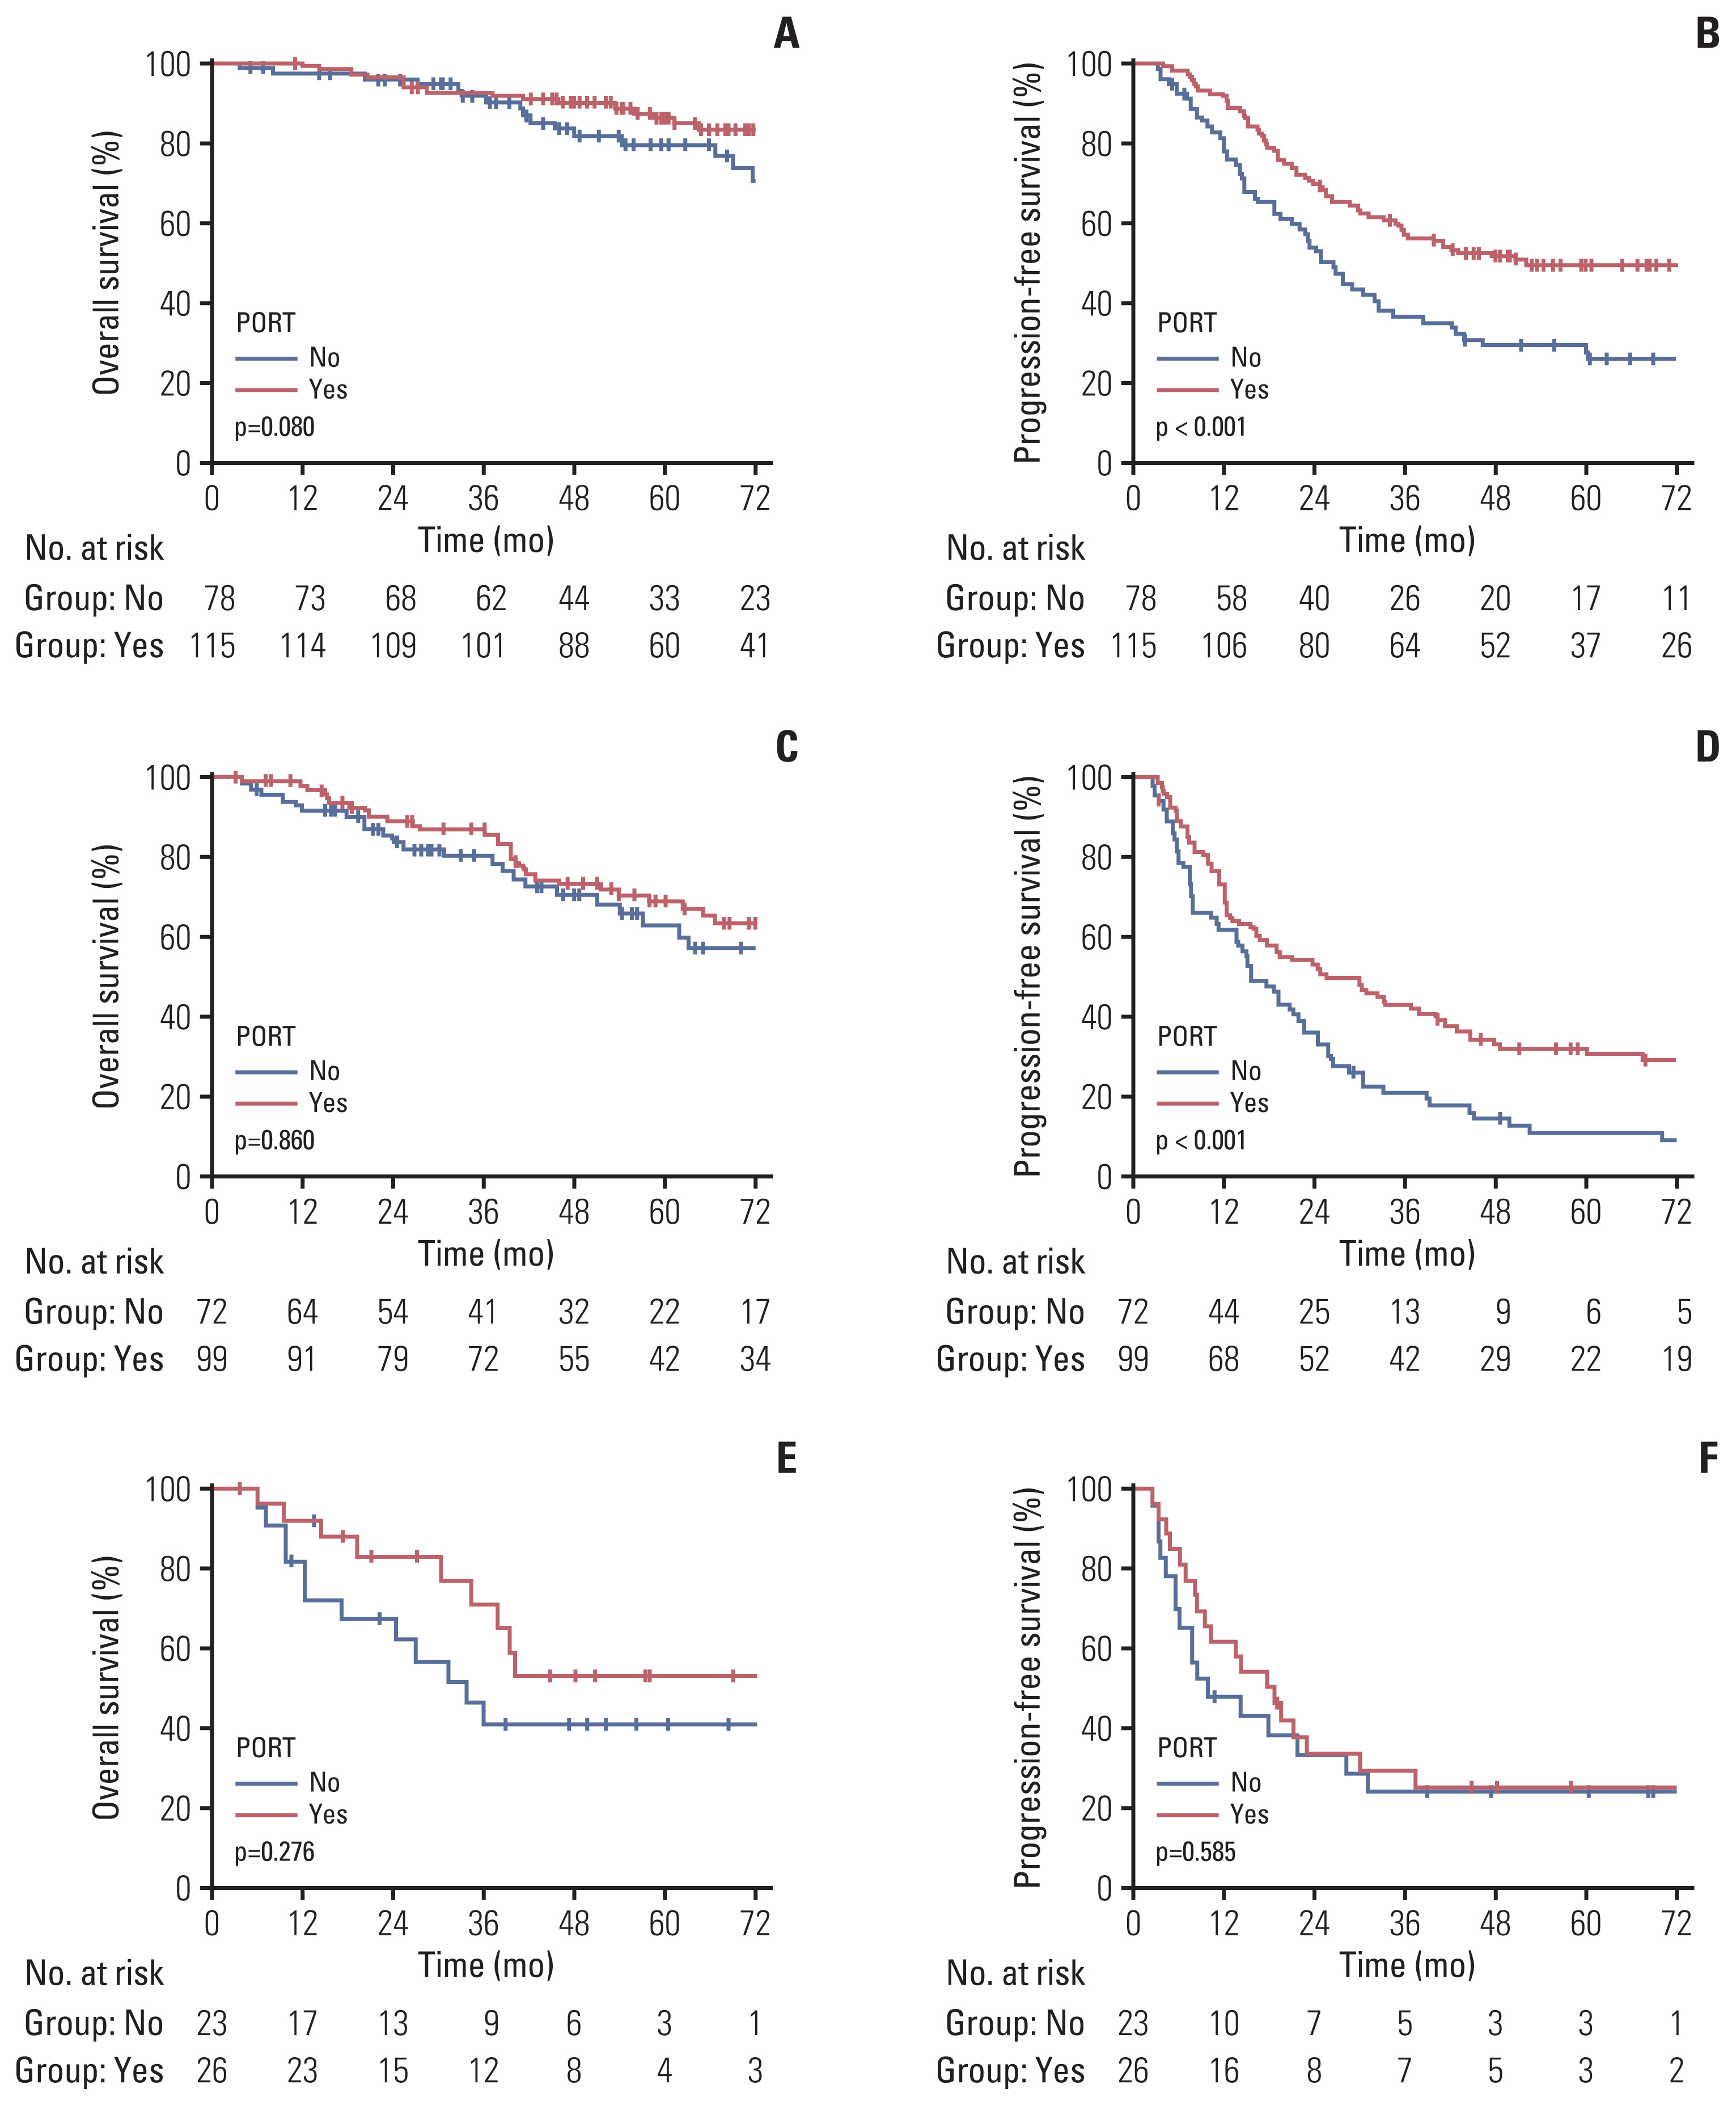
Univariate and multivariate analyses in group 1, the most favorable group, showed that no factor was significantly associated with OS (Table 2). PORT showed a trend towards a favorable prognosis (HR, 0.59; 95% CI, 0.31 to 1.10; p=0.096) (Fig. 1A). However, in analyses of PFS, ≤ 5 metastases and PORT were significant factors associated with good prognosis (HR, 0.57; 95% CI, 0.39 to 0.83; p=0.004) (Fig. 1B). In group 2 (Table 3), the metastatic site was the only significant factor associated with OS, while PORT showed no significant association (HR, 0.95; 95% CI, 0.56 to 1.61; p=0.860) (Fig. 1C). The results for group 2 were comparable to those for group 1, in which the number of metastases and PORT were significantly associated with PFS (HR, 0.66; 95% CI, 0.46 to 0.97; p=0.032) (Fig. 1D). In group 3 (S5 Table), the number of metastases (> 5) was the only significant factor associated with OS. Regarding PFS, T category, numbers of metastases, and timing of chemotherapy were significantly associated, while PORT was not (Fig. 1E and F).
LRR occurred in 65 patients, with a 5-year LRR incidence rate of 15.7%. Thirty cases of LRR (46.2%) coincided with DP and eight failures occurred after DP. LRR preceded DP in 17 patients with a median interval of 9.7 months (range, 1.9 to 33.7 months). The breast/chest wall was the most common site of LRR (34 patients). Among these patients, 10 also had the regional nodal failure. Axilla and supraclavicular recurrences occurred in 23 and 21 patients each, while four patients had internal mammary node recurrence. Among the 65 patients with LRR, 30 received PORT, and all but two cases were in-field recurrences. Multivariate analyses of LRR in the overall population showed significant associations between lower LRR rates and lower N category (N0/1), bone metastases, and PORT (HR, 0.43; 95% CI, 0.26 to 0.71; p=0.001). Among the subgroups, PORT was a significant factor for LRR only in group 1 (HR, 0.36; 95% CI, 0.15 to 0.84; p=0.019) with a metastatic burden. However, PORT had no impact on the LRR rate in other groups, and neither did other factors.
A total of 290 patients experienced DP, with a 5-year incidence rate of 65.9%. PORT was a meaningful prognostic factor for DP in the multivariate analyses (HR, 0.71; 95% CI, 0.55 to 0.91; p=0.008). Following factors were also significant factors regarding DP; T3/4 category, number of metastases over 5, TNBC, and PTR type of mastectomy. Among subgroups, PORT was significantly associated with lower DP in group 1 (HR, 0.58; 95% CI, 0.40 to 0.86; p=0.006) with the number of metastases ≤ 5 and breast-conserving operation. PORT also had significant impact in group 2 (HR, 0.67; 95% CI, 0.46 to 0.96; p=0.029) with single metastatic burden. However, PORT did not impact DP in group 3, while no administration of chemotherapy (HR, 6.61; 95% CI, 1.28 to 34.1; p=0.024) and T3/4 (HR, 3.02; 95% CI, 1.13 to 8.04; p=0.027) disease status were poor prognostic factors.
Discussion
The value of PTR for dnMBC is still controversial despite three RCTs comparing systemic therapy plus PTR with systemic therapy alone [4–6]. Each study had a different sequence of chemotherapy and PTR, and had limitations of few targeted therapy [4], uneven distribution of TNBC [5], and poor recruitment [6]. The most recent study from the ECOG-ACRIN research group reported no benefit of PTR in abstract format, however, we have to wait for further data maturation [7]. The results of the present study are quite encouraging with 3- and 5-year OS rates of 85.6% and 73.2%, respectively, among patients with dnMBC who received PTR +/− PORT. These rates were comparable or superior to those of previous studies reporting 3-year OS rates of 49%–68.4% [5–7]. These excellent results were likely due to the exclusion of not only patients who progressed after preoperative chemotherapy but also those with rapid progression within 2 months after PTR. In addition, selection bias was possible, in which physicians with relatively favorable patients received PTR due to the retrospective nature of the study design. We also assumed that patients might have received aggressive treatments after progression due to the low burden of medical costs owing to national health insurance support in Korea.
The main goal of this study was to evaluate the impact of PORT. Although PORT failed to show a significant improvement in OS, it was one of the significant factors associated with PFS. PORT decreased not only LRR but also DP. However, there was a fundamental limitation in this study that the no-PORT group included more patients with the disseminated metastatic burden. Also, the PORT group might be more amenable to receive other systemic therapy or RT for metastatic lesions. However, some studies have also reported improved PFS after PORT [11,14], which supports the theory that RT could boost the anti-tumor immune response by inducing immunogenic cell death and the abscopal effect [15,16]. In addition, aggressive local control might decrease ongoing distant dissemination [17].
Among the three subgroups, patients with TNBC showed no PFS benefit from PORT. This might be attributed to the fact that no effective systemic therapy is available for TNBC compared with the other subtypes. Before the advent of anti-HER2 therapy, HER2 positivity in breast cancer was associated with rapid tumor proliferation, shorter disease-free survival, and poorer OS [18]. Thanks to the combination of pertuzumab, trastuzumab, and docetaxels, patients with HER2-enriched metastatic breast cancer could achieve the median OS was 56.5 months [19]. More recently, the addition of cyclin-dependent kinase 4 and 6 inhibitors to fulvestrant prolonged the OS of luminal A breast cancer patients who failed previous endocrine therapy [20]. Unlike the other IHC types, TNBC still doesn’t have any systemic agent which could control the distant disease burden so that the overall prognosis is dismal [21]. Also, the number of TNBC cohort was too small (n=49) to evaluate the effect of PORT. Similar to our cohort, a retrospective study of 4276 dnMBC patients demonstrated that LRT comprising RT, PTR, or both was associated with a better OS in ER/PR-positive (61.6 months vs. 45.9 months, p < 0.001) and HER2-positive (77.2 months vs. 52.6 months, p=0.008) patients, but not in patients with TNBC (19.0 months vs. 18.6 months, p=0.54) [22]. Another study evaluating the impact of PTR in dnMBC reported that PTR improved survival only in patients with ER/PR- or HER2-positive disease [23]. Thus, patients with TNBC may not be the primary candidates for the routine administration of PORT.
Group 1 (T1/2 and non-TNBC) most benefited from PORT. In this group, the OS showed a trend favoring PORT and the LRR and DP were significantly decreased by PORT. However, PORT did not affect the LRR in group 2 (T3/4 and non-TNBC). Patients with clinical T1/2 disease more often received breast-conserving operations compared to patients with T3/4 disease; thus, the decrease in LRR might be more dramatic in group 1 than that in group 2. A recent review proposed a decision algorithm to select the optimal candidates for LRT in dnMBC and reported that LRT could be an option for ER/PR or HER2-positive patients [24]. Although most previous RCTs on LRT for dnMBC failed to demonstrate the benefit of LRT, future studies focusing on patients with these favorable IHC subtypes may demonstrate improved survival through LRT including PORT.
The present study had several limitations. First, the characteristics differed significantly between patients in the PORT and no-PORT groups. Statistical analysis to compensate for this limitation such as propensity score matching was not feasible due to the small number of patients. Moreover, we did not collect data on toxicities, which is important clinical data for certain treatments. PTR may increase the risks of infection, hematoma, and lymphedema, while PORT may cause radiation dermatitis, esophagitis, fibrosis, etc. [25]. Due to the retrospective nature of the present study, descriptions of toxicities were largely missing. Nonetheless, we collected real-world data including specific information on surgery and RT, as well as patterns of failure.
PORT was associated with a significantly better PFS in patients with dnMBC who received PTR. Patients with clinical T1/2 and non-TNBC disease benefited most from PORT, while PORT had little effect on those with TNBC. The retrospective design of the study prevented us from obtaining direct evidence to support PORT. However, our results suggest that further studies on LRT for dnMBC should focus on diseases with favorable prognoses such as ER/PR or HER2-positive tumors.