Introduction
The advent of immune checkpoint inhibitors (ICIs) as first- and second-line of treatments for advanced non–small cell lung cancer (NSCLC) has resulted in improved survival and anti-tumor response in selected patients [1–4]. Unfortunately, nearly 60% patients with advanced NSCLC do not benefit from anti–programmed death-1 (PD-1) or programmed death-ligand-1 (PD-L1) agents, which are commonly used in immunotherapy. Therefore, besides tumor PD-L1 expression, more reliable markers that can predict responses to immunotherapy are required to guide individualized treatment.
Recently, several biomarkers involved in the interplay between the tumor and host genomics, tumor microenvironment, and immune functions have been identified. One of them is tumor mutational burden (TMB), which has been suggested to be a potent predictor of response to ICIs in metastatic NSCLC in multiple studies [5–7]. However, some studies have regarded it as an inconsistent predictor of response to treatment with single or multiple ICIs [8,9]. Another biomarker that can be used is the gene signature associated with immune cells. Especially, the CD8+ T cell– related genes and interferon-γ (IFN-γ) signatures are predictive of the effectiveness of ICI therapies [10,11]. As these biomarkers interact closely with each other at different stages of the complex process of cancer immunity, the use of a combination of multiple biomarkers can increase the positive or negative predictive value of response to ICI treatment.
Recent studies support the notion that combined use of these biomarkers enhances their ability to predict the therapeutic response and prognosis compared to their individual use [12,13]. Additionally, a pan-cancer meta-analysis revealed that multiparametric biomarker strategies are associated with improved performance for predicting ICI therapeutic response compared to PD-L1 immunohistochemistry (IHC), TMB, or transcriptional signatures alone [14]. In this study, we aimed to verify whether multimodal biomarker testing improves the predictiveness of the immunotherapy response in real-world NSCLC patients.
Materials and Methods
1. Study population
Thirty patients with NSCLC who were treated with ICIs between May 2016 and March 2019 at Seoul National University Bundang Hospital were selected. Inclusion criteria included histologically diagnosed and surgically resected NSCLC with sufficient pretreatment tumor samples and complete progression-free survival (PFS) and overall survival (≥ 1 month) data. Additionally, we collected data on their smoking status, genetic alterations, and tumor staging from medical records. Patients were characterized as having either durable clinical benefit (DCB) or no durable benefit (NDB), in addition to complete/partial response (CR/PR), stable disease (SD), or progressive disease (PD) as the best response (Response Evaluation Criteria in Solid Tumor ver. 1.1) [15]. DCB was defined as CR/PR or SD for at least 6 months, whereas NDB was defined as progression within 6 months from the start of ICI treatment [5].
2. Targeted sequencing and TMB calculation
DNA isolated from formalin-fixed, paraffin-embedded (FFPE) tumor sections were subjected to hybridization capture-based next generation sequencing to detect somatic alterations in 377 genes with a 1.67-Mbp custom capture probe (SureSelect DNA Advanced Design Wizard, Agilent, Santa Clara, CA). A total of 359 genes were designed to contain whole exons, 18 hotspot regions, and 17 rearranged regions. In addition, 16 loci of microsatellite instability regions were also included in the panel. The gene list of the custom-designed panel is presented in S1 Table. Paired-end sequencing was performed on a HiSeq platform (Illumina, San Diego, CA). Reads were aligned to the genome build GRCH19 using BWA, followed by the removal of duplicates using Picard Tools, indel realignment, and base recalibration using the Genome Analysis Toolkit (GATK, Broad Institute). Somatic mutation, single-nucleotide variant/indel, copy number variation (CNV), and translocation calling were performed using MuTect2, Vardict, CNVkit, and Lumpy, respectively. The mean on-target depth was 355×. TMB, defined as the number of nonsynonymous and in-frame shift mutations per megabase (Mb), was calculated. To determine whether our panel could accurately quantitate TMB, we simulated TMB measurements in the Cancer Genome Atlas pan-cancer cohort of 10,182 tumors and compared it with whole exome sequencing (WES) data.
3. Gene expression profiling
Total RNA was isolated from FFPE sections using a Qiagen RNeasy FFPE kit (Qiagen, Hilden, Germany). Gene expression was determined using NanoString nCounter analysis for the PanCancer IO360 panel (NanoString Technologies, Seattle, WA) to evaluate 770 genes that cover the key pathways at the interface of the tumor, tumor microenvironment, and immune response. The samples were tested according to the manufacturer’s recommendations [16]. The nSolver v4.0 and the nSolver Advanced Analysis v2.0.115 were used to normalize gene expression using the geNorm algorithm, and differentially expressed gene (DEG) tests were also conducted. Analysis was performed using R v3.6.3. DEGs are defined as having p ≤ 0.05 and |fold-change| ≥ 2. Single-sample gene set enrichment analysis (ssGSEA) was performed using ssGSEA v10.0.6 module in GenePattern [17]. ssGSEA caslculated separate enrichment score (ES) for each pairing of a sample and gene set. Each ES represents the degree to which the genes in a particular gene set are coordinately up- or downregulated within a sample [17].
4. PD-L1 IHC
PD-L1 IHC was performed using the 22C3 PharmDx assay as previously described [18]. PD-L1 expression was evaluated in tumor cells and reported as the tumor proportion score. Tumors were grouped according to PD-L1 expression: < 1% (negative), 1%–49% (intermediate), or ≥ 50% (high).
5. Statistical analysis
Student’s t test, chi-square test, and Wilcoxon rank-sum test were used to compare variables between patient subgroups. The receiver operating characteristic (ROC) curves and the resultant area under the curve (AUC) were used to measure the association between the different assay modalities. The cutoff values providing the best separation between responders and non-responders to PD-1 blockade were also determined using ROC curves. For survival analysis, Kaplan-Meier curves were used to estimate time-to-event outcome parameters, and multiple groups were compared using the log-rank test. All tests were two-sided, and statistical significance was set at p < 0.05. Data were analyzed using R v3.6.3. and SPSS ver. 21 (IBM Corp., Armonk, NY).
Results
1. Demographics and genetic characteristics
The baseline characteristics of the 30 enrolled patients with NSCLC treated with ICI are summarized in Table 1. In brief, 67% were ever-smokers and 77% had non-squamous histology. PD-L1 expression was positive in 83% of the patients.
Most of the patients (20/30, 66.7%) were initial stage II/III (3 for IIA, 5 for IIB, 10 for IIIA, 2 for IIIB, 3 for IIA, and 5 for IIB) and they relapsed after adjuvant treatment and received immunotherapy. Eight out of 30 patients (26.7%) were in initial stage IV, and after chemotherapy/radiotherapy, if the tumor size decreased or there was a resistant nodule, surgery was performed for palliative purposes. One of the two stage IA patients was a solid predominant adenocarcinoma and relapsed 18 months after surgery. The other had squamous cell carcinoma (SqCC) and received photodynamic therapy after surgery, but relapsed after 8 months. The majority of patients received PD-1/PD-L1 blockade therapy as second-line treatment, and only two received it as first-line therapy. Eleven patients (36.7%) were placed in the DCB group, while the remaining 19 were assigned to the NDB group. The number of non-SqCC in the DCB group was higher than that in the NDB group, but the difference was not statistically significant. In addition, there was no significant difference in the clinicopathological characteristics between the two groups (Table 1).
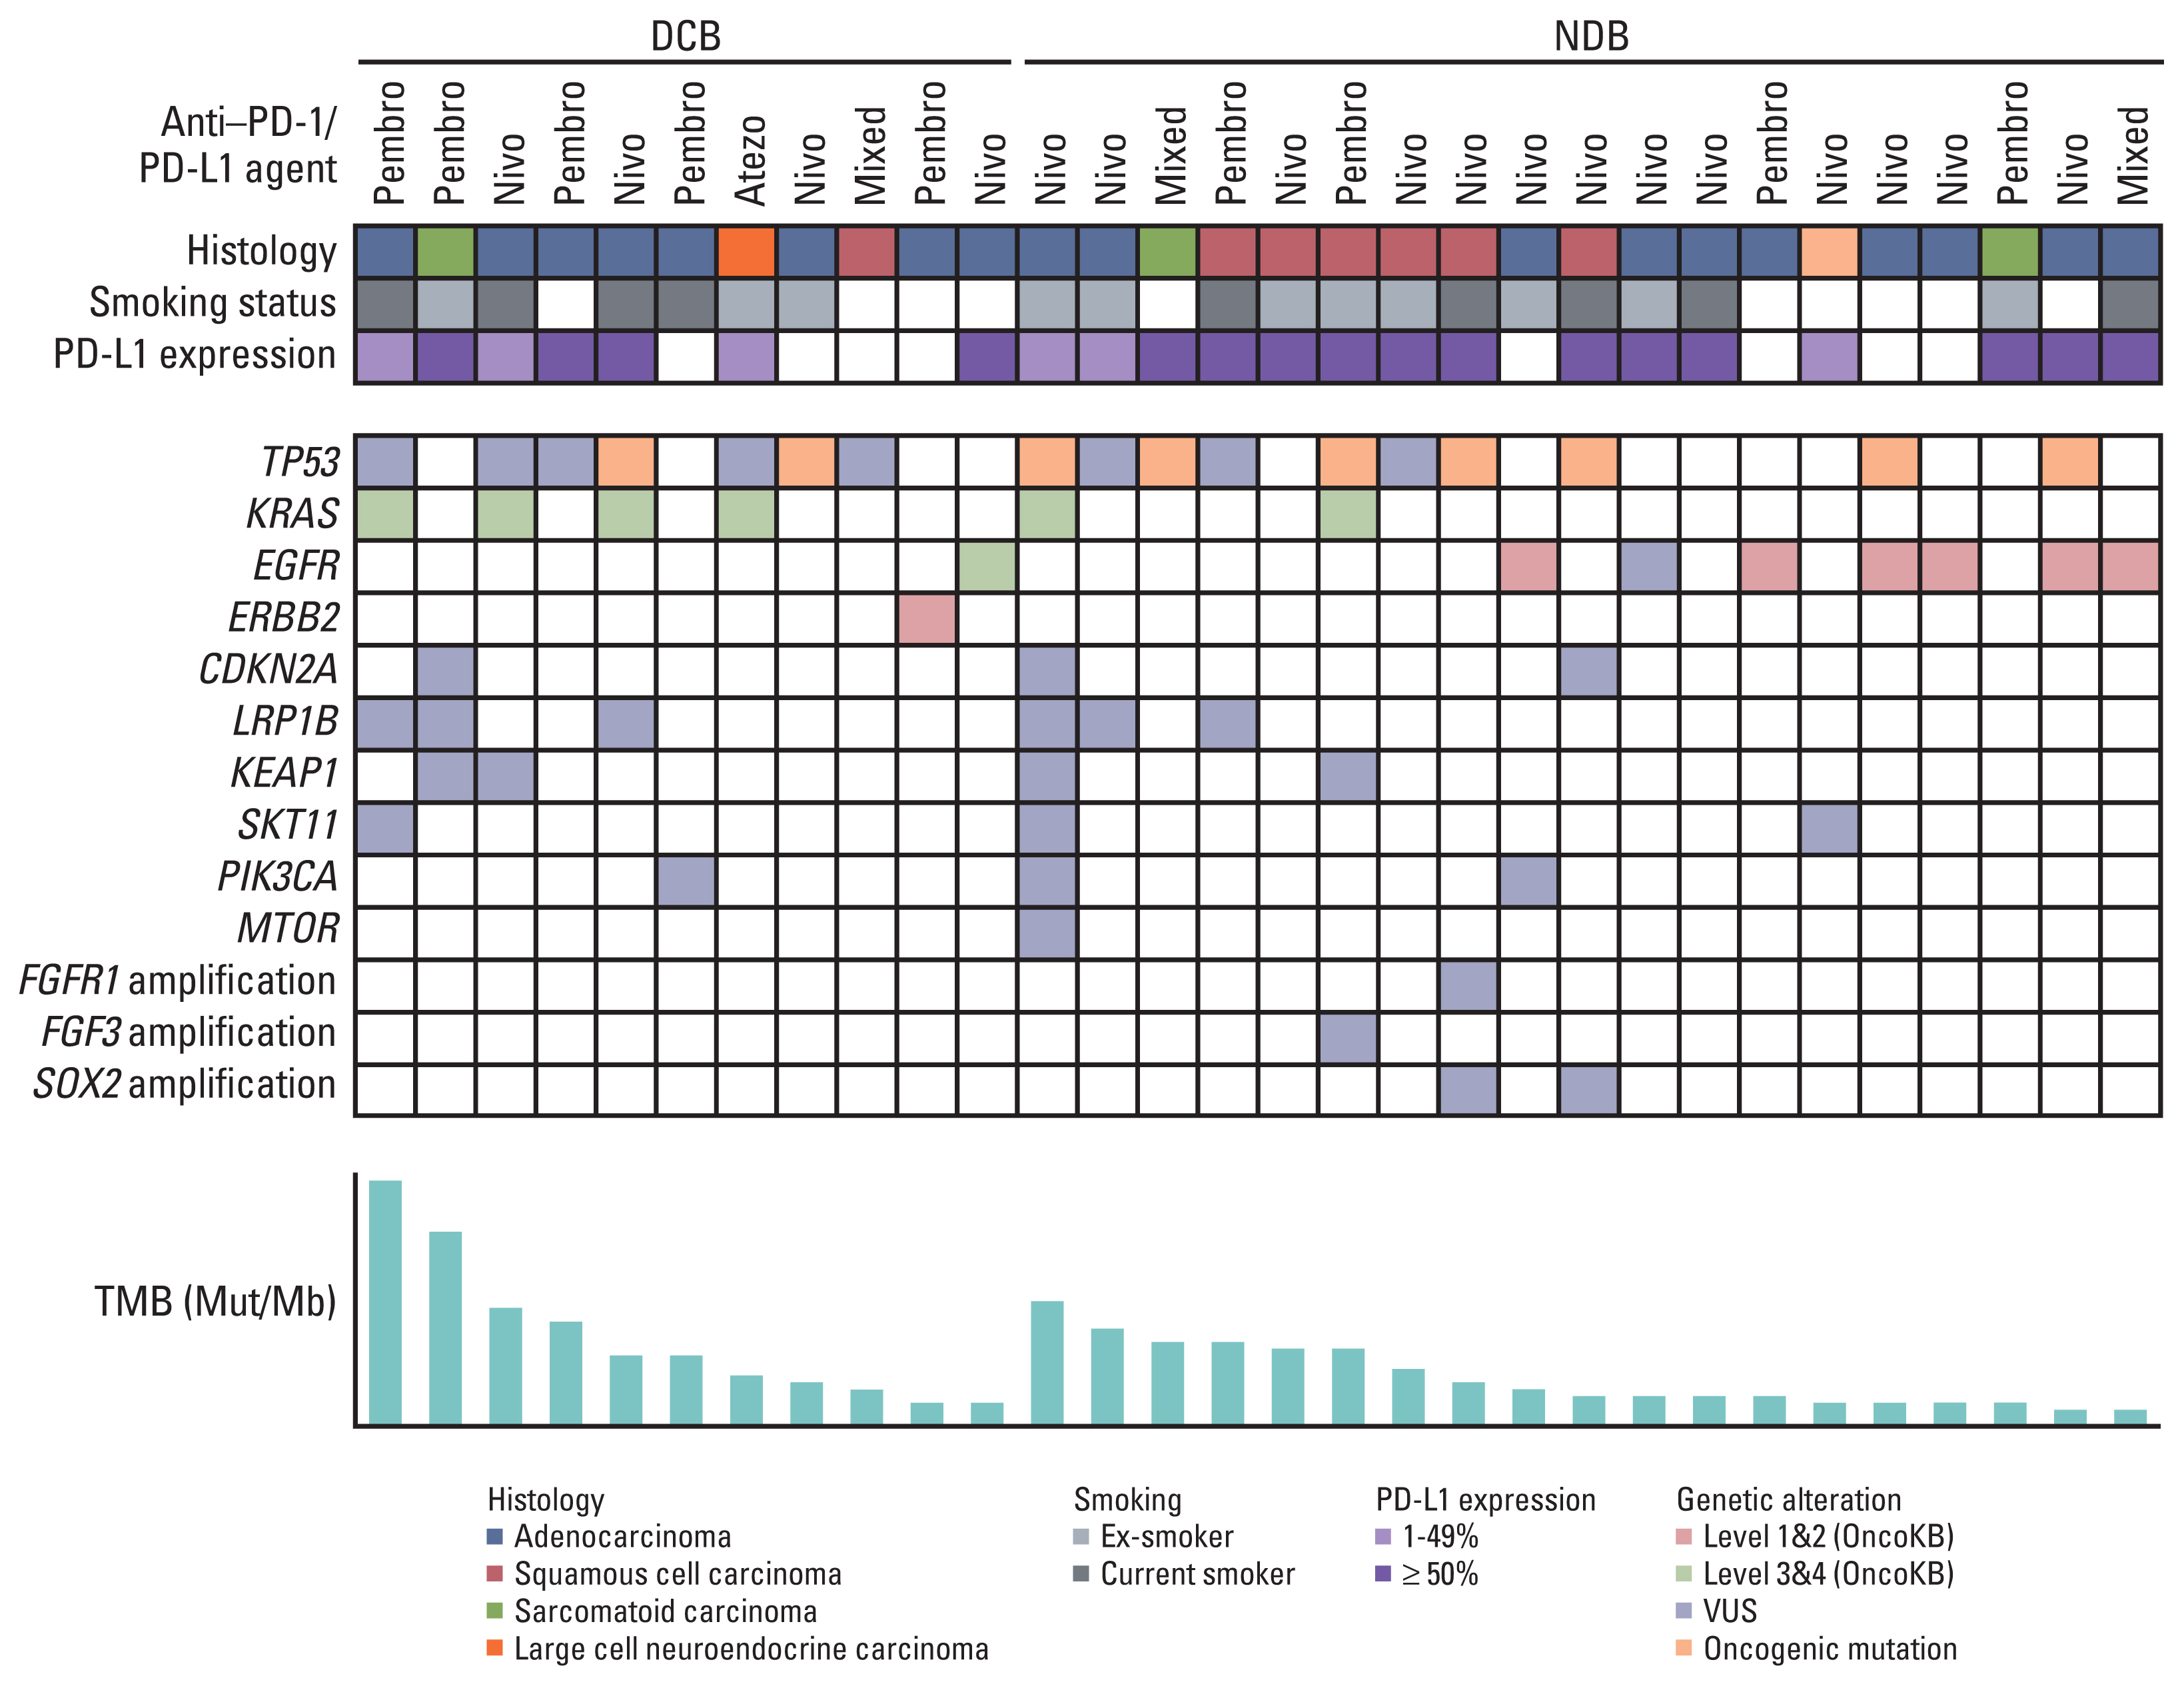
Fig. 1 shows the clinicopathological and molecular characteristics of each patient. Mutations in TP53 were the most common, and its mutation rate between DCB and NDB groups was similar (22.2% vs. 36.8%). The KRAS mutation was more frequent in the DCB group (36.4% vs. 10.5%), whereas epidermal growth factor receptor (EGFR) was more frequent in the NDB group (9.1% vs. 31.6%); however, these differences were not statistically significant.
2. Comparison of each biomarker according to anti–PD-1/PD-L1 response
1) Tumor mutational burden
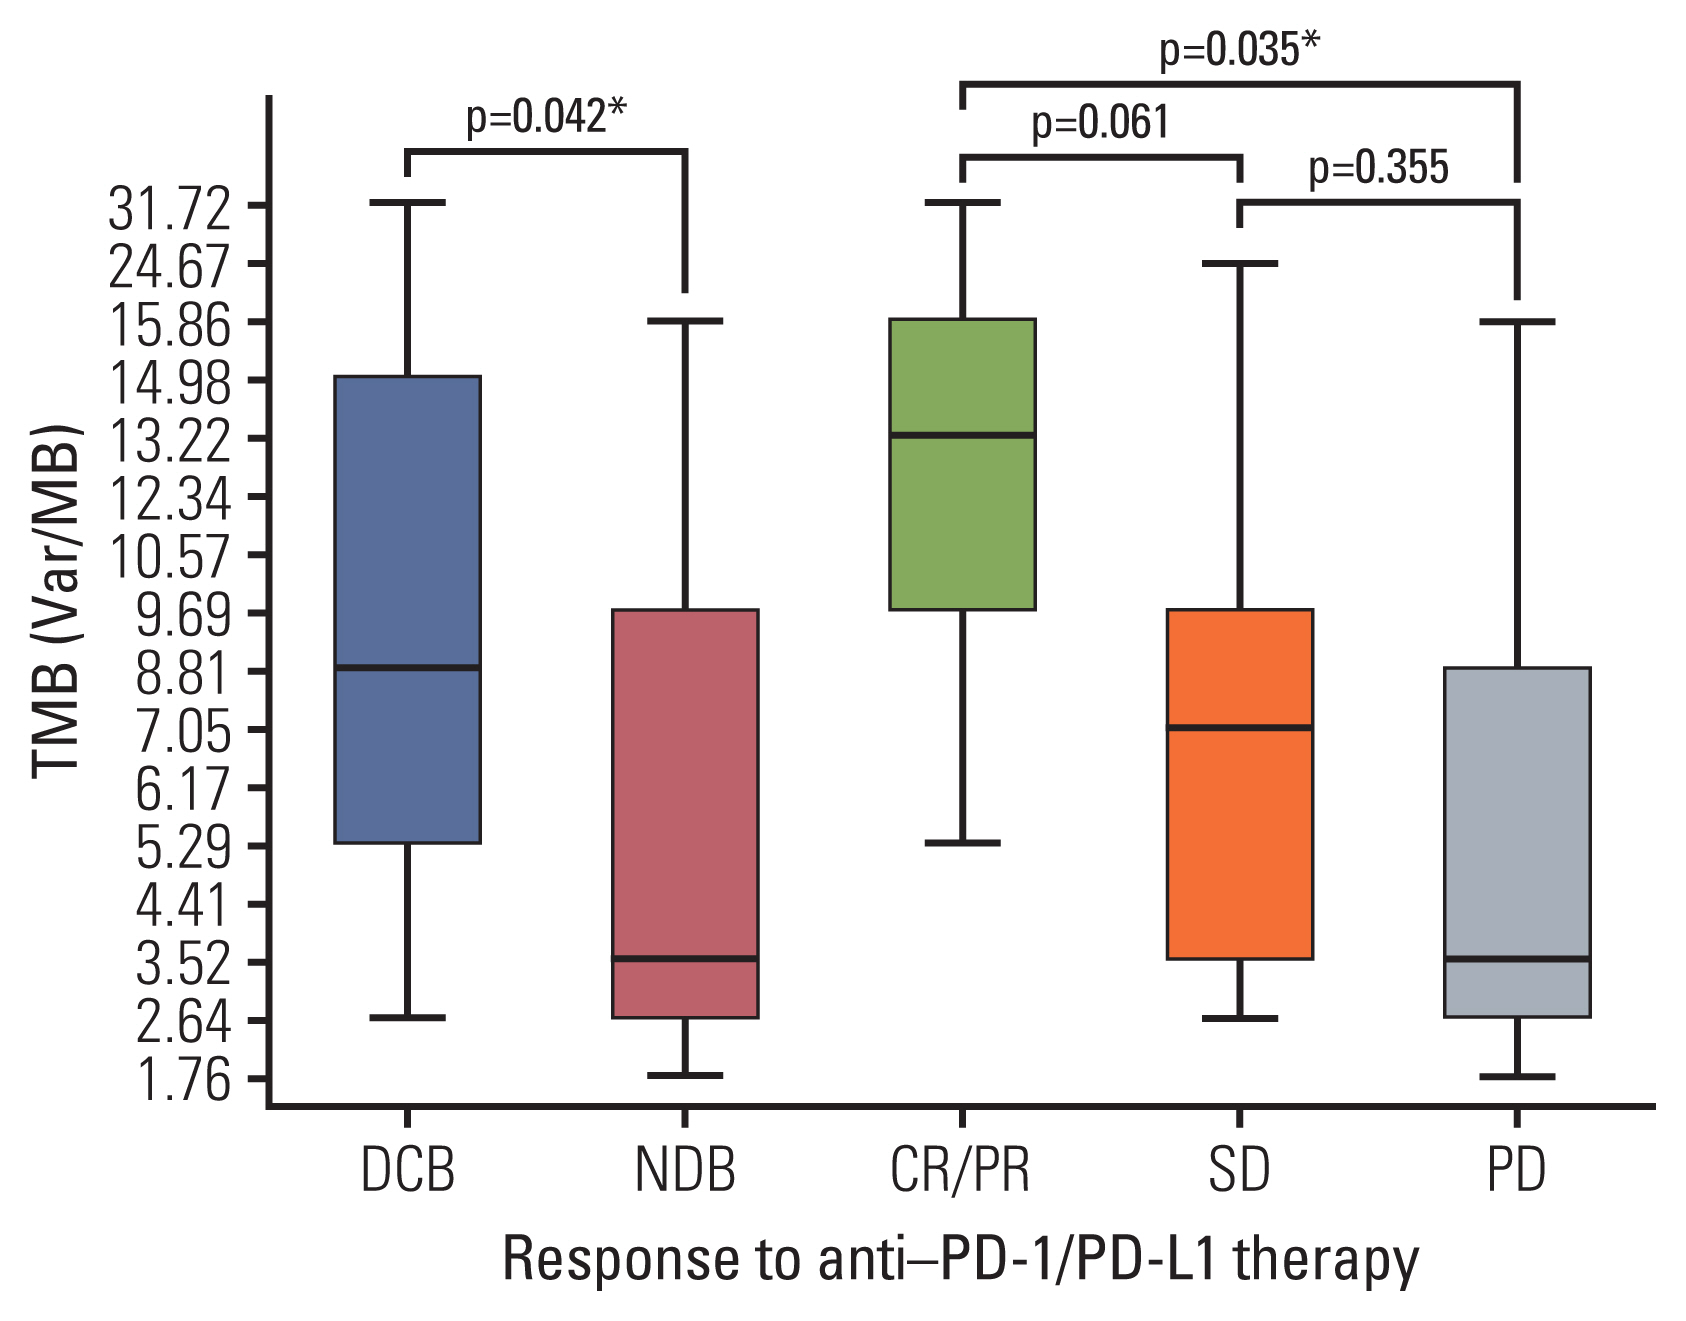
Strong correlation (R2=0.884) between panel sequencing and WES was observed (S2 Fig). In our cohort, the median TMB was 5.29 var/Mb (range, 1.76 to 31.72 var/Mb). TMB was greater in the DCB group than in the NDB group (mean, 11.21 vs. 5.98; p=0.044) and in patients showing best response with CR/PR than in those showing SD or PD (mean 16.7 vs. 7.7 vs. 5.8, respectively) (Fig. 2). In particular, the mean TMB was greater in patients with CR/PR than in those with SD or PD (p=0.061 and p=0.035, respectively), and the TMB distribution between the SD and PD groups was similar (p=0.355) (Fig. 2).
2) Gene set enrichment analysis and ES
Among the 30 RNA samples, 26 passed quality control. Singular enrichment analysis showed that the immune system-related pathways in the gene ontology biological process was highly enriched in the DCB group (Fig. 3A). A total of 111 upregulated and six downregulated DEGs were identified between the DCB and NDB groups. The key identified genes are linked to activated T cells, B cells, and natural killer cells (such as IL1A, TNFRSF8, BTLA, GZMM, NCR1, and FOXP3) and IFN-γ signaling (such as DNMT1, PDCD1, TIGIT, CXCR6, and IFNGR1) in the DCB group. Representative genes are shown in Fig. 3B. The DCB group was significantly enriched in GSE37605 (regulatory T cell [Treg] and Tconv Cells) (Familywise-error rate [FWER] p=0.466, nominal p < 0.001) and GSE20366 (TregLP vs. TconvLP up) (FWER p=0.768, nominal p=0.008) (Fig. 3C). ssGSEA was performed using a customized gene set with 117 DEGs to obtain an ES. ES was lower in the DCB group than in the NDB group (−0.636 vs. 0.337, p=0.017) and in patients showing the best response with CR/PR than in those with SD or PD (−0.858 vs. 0.098 vs. 0.226, respectively). In particular, the mean ES was lower in patients with CR/PR than in those with SD or PD (p=0.093, p=0.012), and the ES between the SD and PD groups was similar (p=0.782).
3) PD-L1 expression
The percentages of tumors that showed high, intermediate, and negative PD-L1 expression were approximately 50% (15/30), 23.3% (7/30), and 26.7% (8/30), respectively. There was no significant difference in PD-L1 expression between the DCB and NDB groups and among the groups, according to the best response.
3. Predictive power of biomarkers to anti–PD-1/PD-L1 therapy
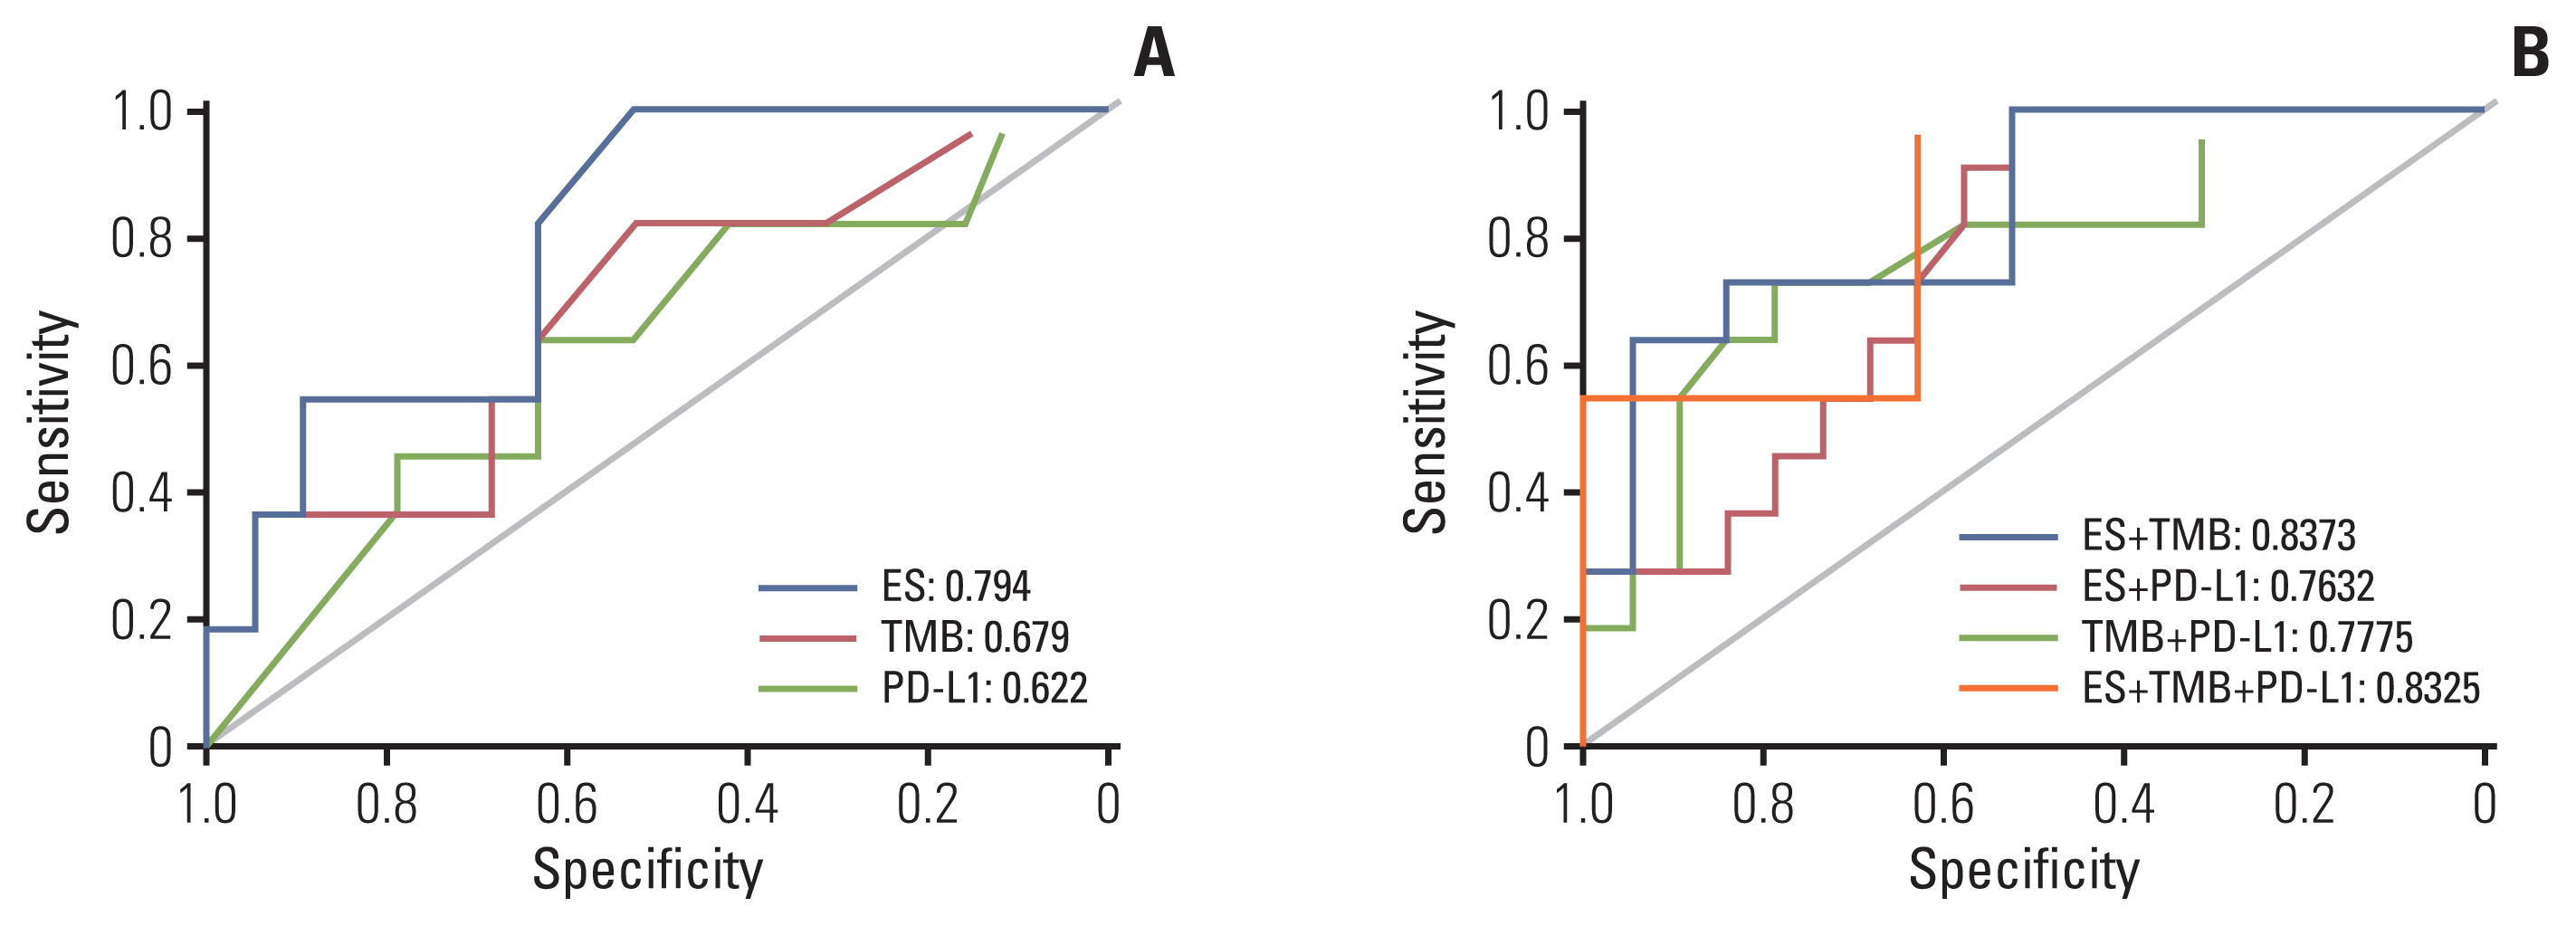
Considering all three biomarkers as continuous variables, no correlation was found between PD-L1 expression and TMB (Spearman r=0.096, p=0.612), PD-L1 and ES (Spearman r=0.162, p=0.429), and TMB and ES (Spearman r=−0.081, p=0.693). The best single biomarker for predicting DCB was ES, with AUC=0.794 (Fig. 4A). TMB and PD-L1 had a similar predictive effect on the likelihood of DCB (0.679 vs. 0.622, respectively). The combination of TMB and ES showed a greater AUC (0.8373) than other combinations (TMB and PD-L1, 0.7775; PD-L1 and ES, 0.7632) (Fig. 4B). Interestingly, the AUC of the combination of TMB and ES was similar to that of the combination of all three biomarkers (0.8325) (Fig. 4B).
4. Survival analysis
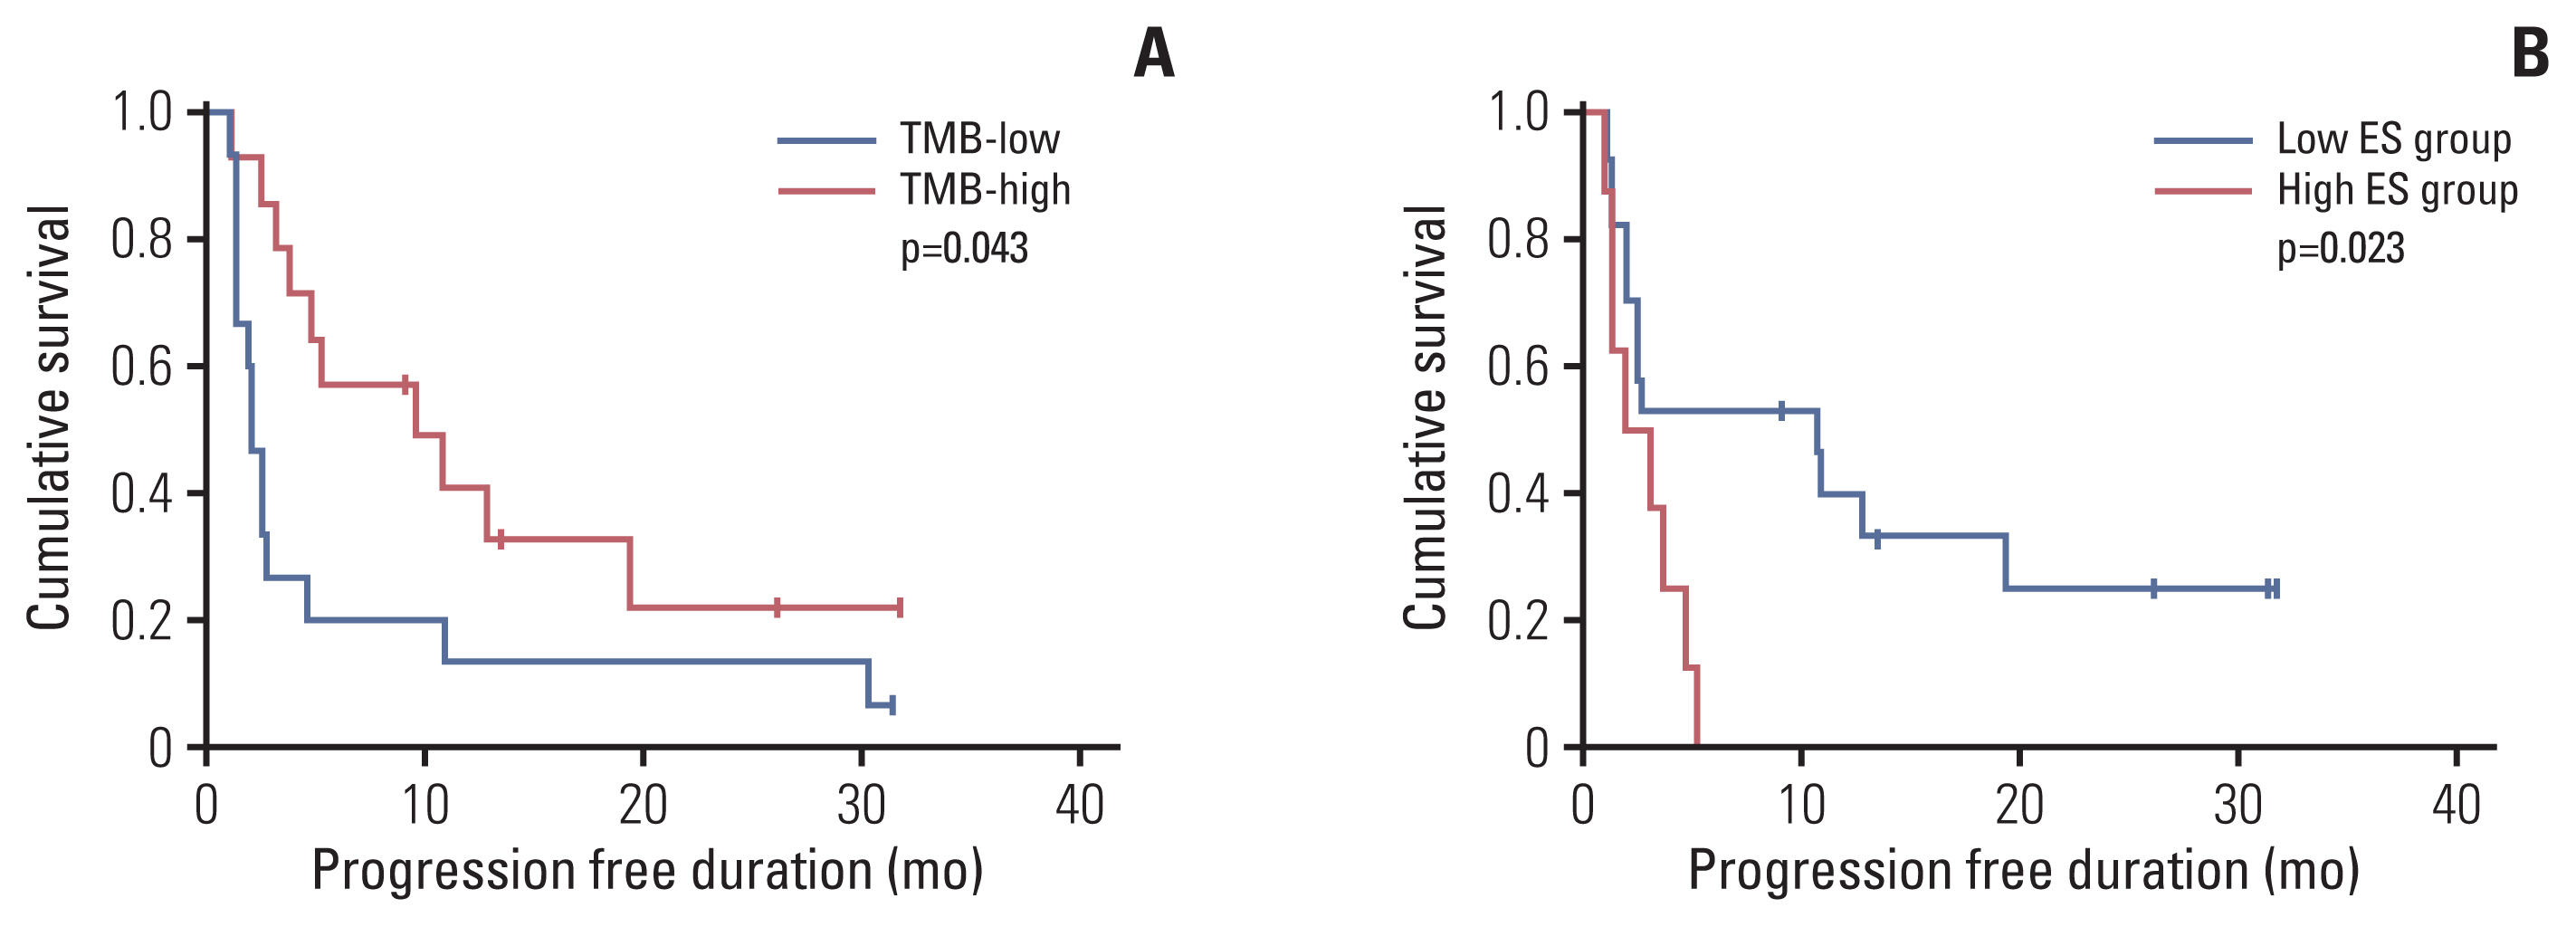
Survival analysis was performed after dichotomizing using the cutoff. When TMB was divided based on the median value (5.29/Mb), the high TMB group showed better PFS than the low TMB group (p=0.043) (Fig. 5A). ES was divided by 0.042, which was the cutoff for predicting the DCB group. The low ES group showed better PFS than the high ES group (p=0.023) (Fig. 5B). PD-L1 expression was not related to survival, and no statistical significance in OS was observed in any of the three biomarkers.
Discussion
A combination of biomarkers could provide complementary information, thus yielding greater accuracy in the prediction of immunotherapeutic benefit. Recently, the combination of TMB with GEP, a T-cell–inflamed gene expression profile, jointly predicted the clinical response to pembrolizumab in pan-tumor types and identified the patterns of underlying, targetable biology related to these groups [19]. In this study, we analyzed TMB, GEP, and PD-L1 expression in FFPE NSCLC specimens and determined their correlation with ICI therapeutic response. We identified that the combination of at least two markers showed greater predictive power than a single biomarker. In particular, the combination of TMB and ES showed the best predictive potency on ICI therapeutic response.
TMB is an emerging predictive biomarker based on the hypothesis that neoantigen formation contributes to the intrinsic immunogenicity of a tumor [6]. The most accurate approach to determine TMB is the WES of paired tumor and normal tissues, although this approach is costly and time-intensive to implement in the clinical setting. To address this issue, targeted sequencing assays, which are enriched for known cancer-driving gene mutations, (including the F1CDx assays), have been recently approved as a companion diagnostic tool by the Food and Drug Administration for solid tumors to assess TMB. However, it is not clear which specific neoantigens drive this host immune response [20]. Preclinical data of patients with melanoma and NSCLC indicate that both the quantity and the quality of mutations are decisive in generating immunogenic neoantigens [21]. Furthermore, TMB alone may not be sufficient to best predict the response to ICI. A recent study has demonstrated that cancer types that show no correlation between neoantigen load and CD8 T-cell infiltration fail to achieve a 20% response rate to ICB in TMB-high tumors and that TMB-high tumors may exhibit a worse response rate to ICB than TMB-low tumors [22]. This suggests that as a host response to the neoantigen generated by mutations, the tumor microenvironment should be considered in the prediction of ICI treatment outcomes.
In our study, the DCB group was particularly enriched in the gene set associated with the regulation of FOXP3 and CD103-positive Treg cells. This is in line with the results of our previous study in which we demonstrated that the CD8+/FOXP3+ tumor-infiltrating lymphocyte (TIL) ratio could predict the ICI therapeutic response in NSCLC [18]. Especially, FoxP3 is the master regulator of Treg development and function and has emerged as an attractive target for specific Treg depletion in cancer [23]. Tregs are attracted to the tumor microenvironment through engagement of chemokine receptors with cognate chemokines, which are abundant in the surrounding microenvironment [24]. Tregs that migrate to the tumor microenvironment (TME) become strongly and preferentially activated by tumor-associated antigens, since Tregs are endowed with high affinity T-cell receptors. Compared to Tregs in the peripheral blood, int-ratumoral Tregs exhibit a more proliferative and immunosuppressive phenotype and are characterized by elevated expression of cytotoxic T-lymphocyte–associated protein 4, CD25, GITR, 4-1BB, OX40, ICOS, LAG-3, TIM3, TIGIT, and PD-1 [24]. In our study, the function of Treg cells, along with CD8+ TIL in the previous study was identified as an important factor in the immunotherapeutic response, suggesting that it is necessary to predict the ICI response to confirm the presence or absence of Tregs along with the CD8+ TIL and IFN-signaling pathway.
We did not find any correlation between PD-L1, TMB, and ES, which is consistent with previous reports that revealed TMB and PD-L1 as independent factors [25], and confirmed that they are indeed independent factors in immunotherapy response. In this study, there was no significant difference in PD-L1 expression according to ICI response. Despite the limitations of PD-L1 as a biomarker, still PD-L1 is regarded as the most commonly used predictive marker for ICI therapy. For this discrepancy, we considered the following reasons. First, since the patients in our cohort were heavily treated patients, treatment before resection may have affected the expression of PD-L1. In addition, it is difficult to guarantee that PD-L1 in the resected specimen is the same as the tumor PD-L1 status at the time of using immunotherapy because relatively long periods exist at the time of specimen acquisition and use of immunotherapy. Secondly, we used the 22C3 PharmDx assay approved as companion diagnostic test for pembrolizumab, but the prescribed PD-1/PD-L1 blockade varied including nivolumab and atezolizumab. Although several PD-L1 Abs have been proven to be equivalent through harmonization studies, IHC platforms and cutoff predicting response were different depending on the drug in clinical trials. Finally, as patients who received immunotherapy were enrolled, there were few PD-L1–negative patients, so it was difficult to confirm the response according to PD-L1 expression.
Here, the genes identified to be related to ICI responses were largely consistent with previous reports. For instance, EGFR mutation predicted poor ICI response [26]. Conversely, mutations in KRAS and PIK3CA, which have been reported as favorable factors in response to ICIs, were frequently observed in the DCB group. Patients with TP53/KRAS co-mutations are responsive to ICI treatments, suggesting the need for the implementation of a model that combine multiple genes [27]. Recently, a STK11/LKB1 co-mutation correlated with significantly shorter PFS after ICI treatment compared with KRAS alteration alone or KRAS/TP53 co-alteration [28]. Another study reported that KRAS/KEAP1 co-alteration as an independent prognostic factor for predicting inferior OS from the start of immunotherapy [29]. In this study, as the number of SKT11 and KEAP1 mutations was small, it was difficult to evaluate the predictive power of ICI response for the combination of genetic mutations.
This study had several limitations. First, we only analyzed a small number of samples. Thus, the correlation between a specific gene mutation and immunotherapy response may not be definitive. Second, we could not propose a gene set for predicting the immunotherapy response because there was no validation in an independent cohort. Nevertheless, our results showed that methods such as targeted panel sequencing and RNA panel analysis of FFPE specimens can be applied in the clinical setting. Studies with lager cohort should be conducted to determine the accurate nature of these relationships and assess the potential clinical utility of developing cutoffs for such biomarkers in patient selection for anti–PD-1 therapy.
In conclusion, TMB and GEP may serve as potential biomarkers to identify patients with NSCLC who are likely to benefit from anti–PD-1/PD-L1 therapy. The assessment of these biomarkers in a randomized, comparative setting is required to provide a better understanding of the predictive versus prognostic elements of these relationships. Further studies on how the different components of the TME and the mutational status may be used to predict outcomes with anti–PD-1/PD-L1 monotherapy and combination therapies relative to standard-of-care treatment should be explored.