Introduction
Adenocarcinoma of the prostate (PCa) is the most common cancer among males from the Unites States, with over 170,000 estimated new cases in 2019 [1]. Although not as frequently diagnosed as in western countries, the incidence of PCa is also rapidly rising in Korea [2]. For localized PCa patients who are not candidates for active surveillance, primary radiotherapy (RT) with or without androgen deprivation therapy is one of the standard treatment modalities throughout all risk groups [3,4].
In external beam RT for PCa, accurate target volume delineation is crucial due to the routine use of intensity-modulated RT and the increasing utilization of hypofractionated RT, including stereotactic body RT [5]. For intermediate-to-high risk localized PCa, extra-margins to cover potential extracapsular extension (ECE) should be considered, as well as the inclusion of the seminal vesicles (SVs) in the target volume [6]. Therefore, precise prediction of the risk of ECE or seminal vesical invasion (SVI) is of importance for patients without clinically overt ECE and SVI, since larger RT-target volumes would result in unnecessary excess radiation exposure to the bladder and rectum. For example, based on pathological findings, the European Organisation for Research and Treatment of Cancer (EORTC) recommends the clinical target volumes to include at least the proximal 1.4 cm and 2.2 cm of the SV for intermediate- and high-risk patients, respectively [6]. The current Radiation Therapy Oncology Group (RTOG) protocols include the proximal 1.0–2.0 cm portion for intermediate- to high-risk patients. These recommendations are convenient and simple for radiation oncologists to adopt. However, further individualization based on risk factors might be necessary because discrepancies between clinical and pathologic stages exist, even in low-risk PCa [7].
The current National Comprehensive Cancer Network (NCCN) risk grouping for PCa is mainly based on clinical staging, initial prostate-specific antigen (iPSA), and Gleason score (GS) obtained from biopsy [4]. Of these, the clinical T-stage should be determined only by the findings of a digital rectal exam. Referring to findings from magnetic resonance imaging (MRI) or tumor laterality from biopsy specimens is discouraged in the 8th American Joint Committee on Cancer (AJCC) staging system [8]. However, the yield of predicting ECE or SVI by digital rectal exam alone is low. Furthermore, it has been reported that the addition of preoperative MRI increases the accuracy of predicting whether the disease is pathologically organ-confined or not [9–11].
The Bayesian network (BN) model is a statistical framework that represents the conditional dependencies of variables via a directed acyclic graph (DAG). In DAG, nodes indicate clinical variables and edges demonstrate conditional dependencies. The strength of BN is accommodating the heterogeneity between clinical or non-clinical variables and providing interpretable clinical scenarios or probabilities to clinicians. Previous studies have facilitated the use of BN for the prediction of prognosis various in cancers, such as breast cancer and gallbladder cancer [12,13]. BN can mimic the human decision-making process, which reveals the surgical indication for patients with gallbladder cancer [14].
Thus, in the current study, we sought BN modeling to predict pathologic findings, such as ECE and SVI in patients with PCa. Specifically, in order to guide radiation oncologists for further individualized target contouring based on MRI findings, we established BN models to accurately predict the risk of pathological ECE and SVI by integrating the MRI findings into clinical T-staging. Furthermore, the positivity rate of the resection margin (RM+ve) was also predicted since these patients are future candidates for salvage RT with increased risk of biochemical relapse [3,4]. This information would be useful not only for radiation oncologists, but for urologists planning surgery.
Materials and Methods
1. Patients and imaging
Patients with PCa confirmed by transrectal ultrasound-guided biopsy and who are undergoing preoperative MRI with radical prostatectomy between 2006 and 2016 were included in the study. All patients were required to have at least eight or more biopsy cores obtained at diagnosis. To minimize patient heterogeneity, those who met the following criteria were excluded: (1) incidentally diagnosed PCa by transurethral prostatectomy for benign prostatic hyperplasia, (2) clinically overt T4 or N1 disease on preoperative imaging, (3) non-adenocarcinoma PCa, (4) history of any anti-PCa treatment such as neoadjuvant androgen deprivation therapy prior to radical prostatectomy, and (5) no information regarding iPSA or MRI within 6 months preoperately. A total of 1915 patients met the inclusion and exclusion criteria. Patient characteristics are shown in Table 1.
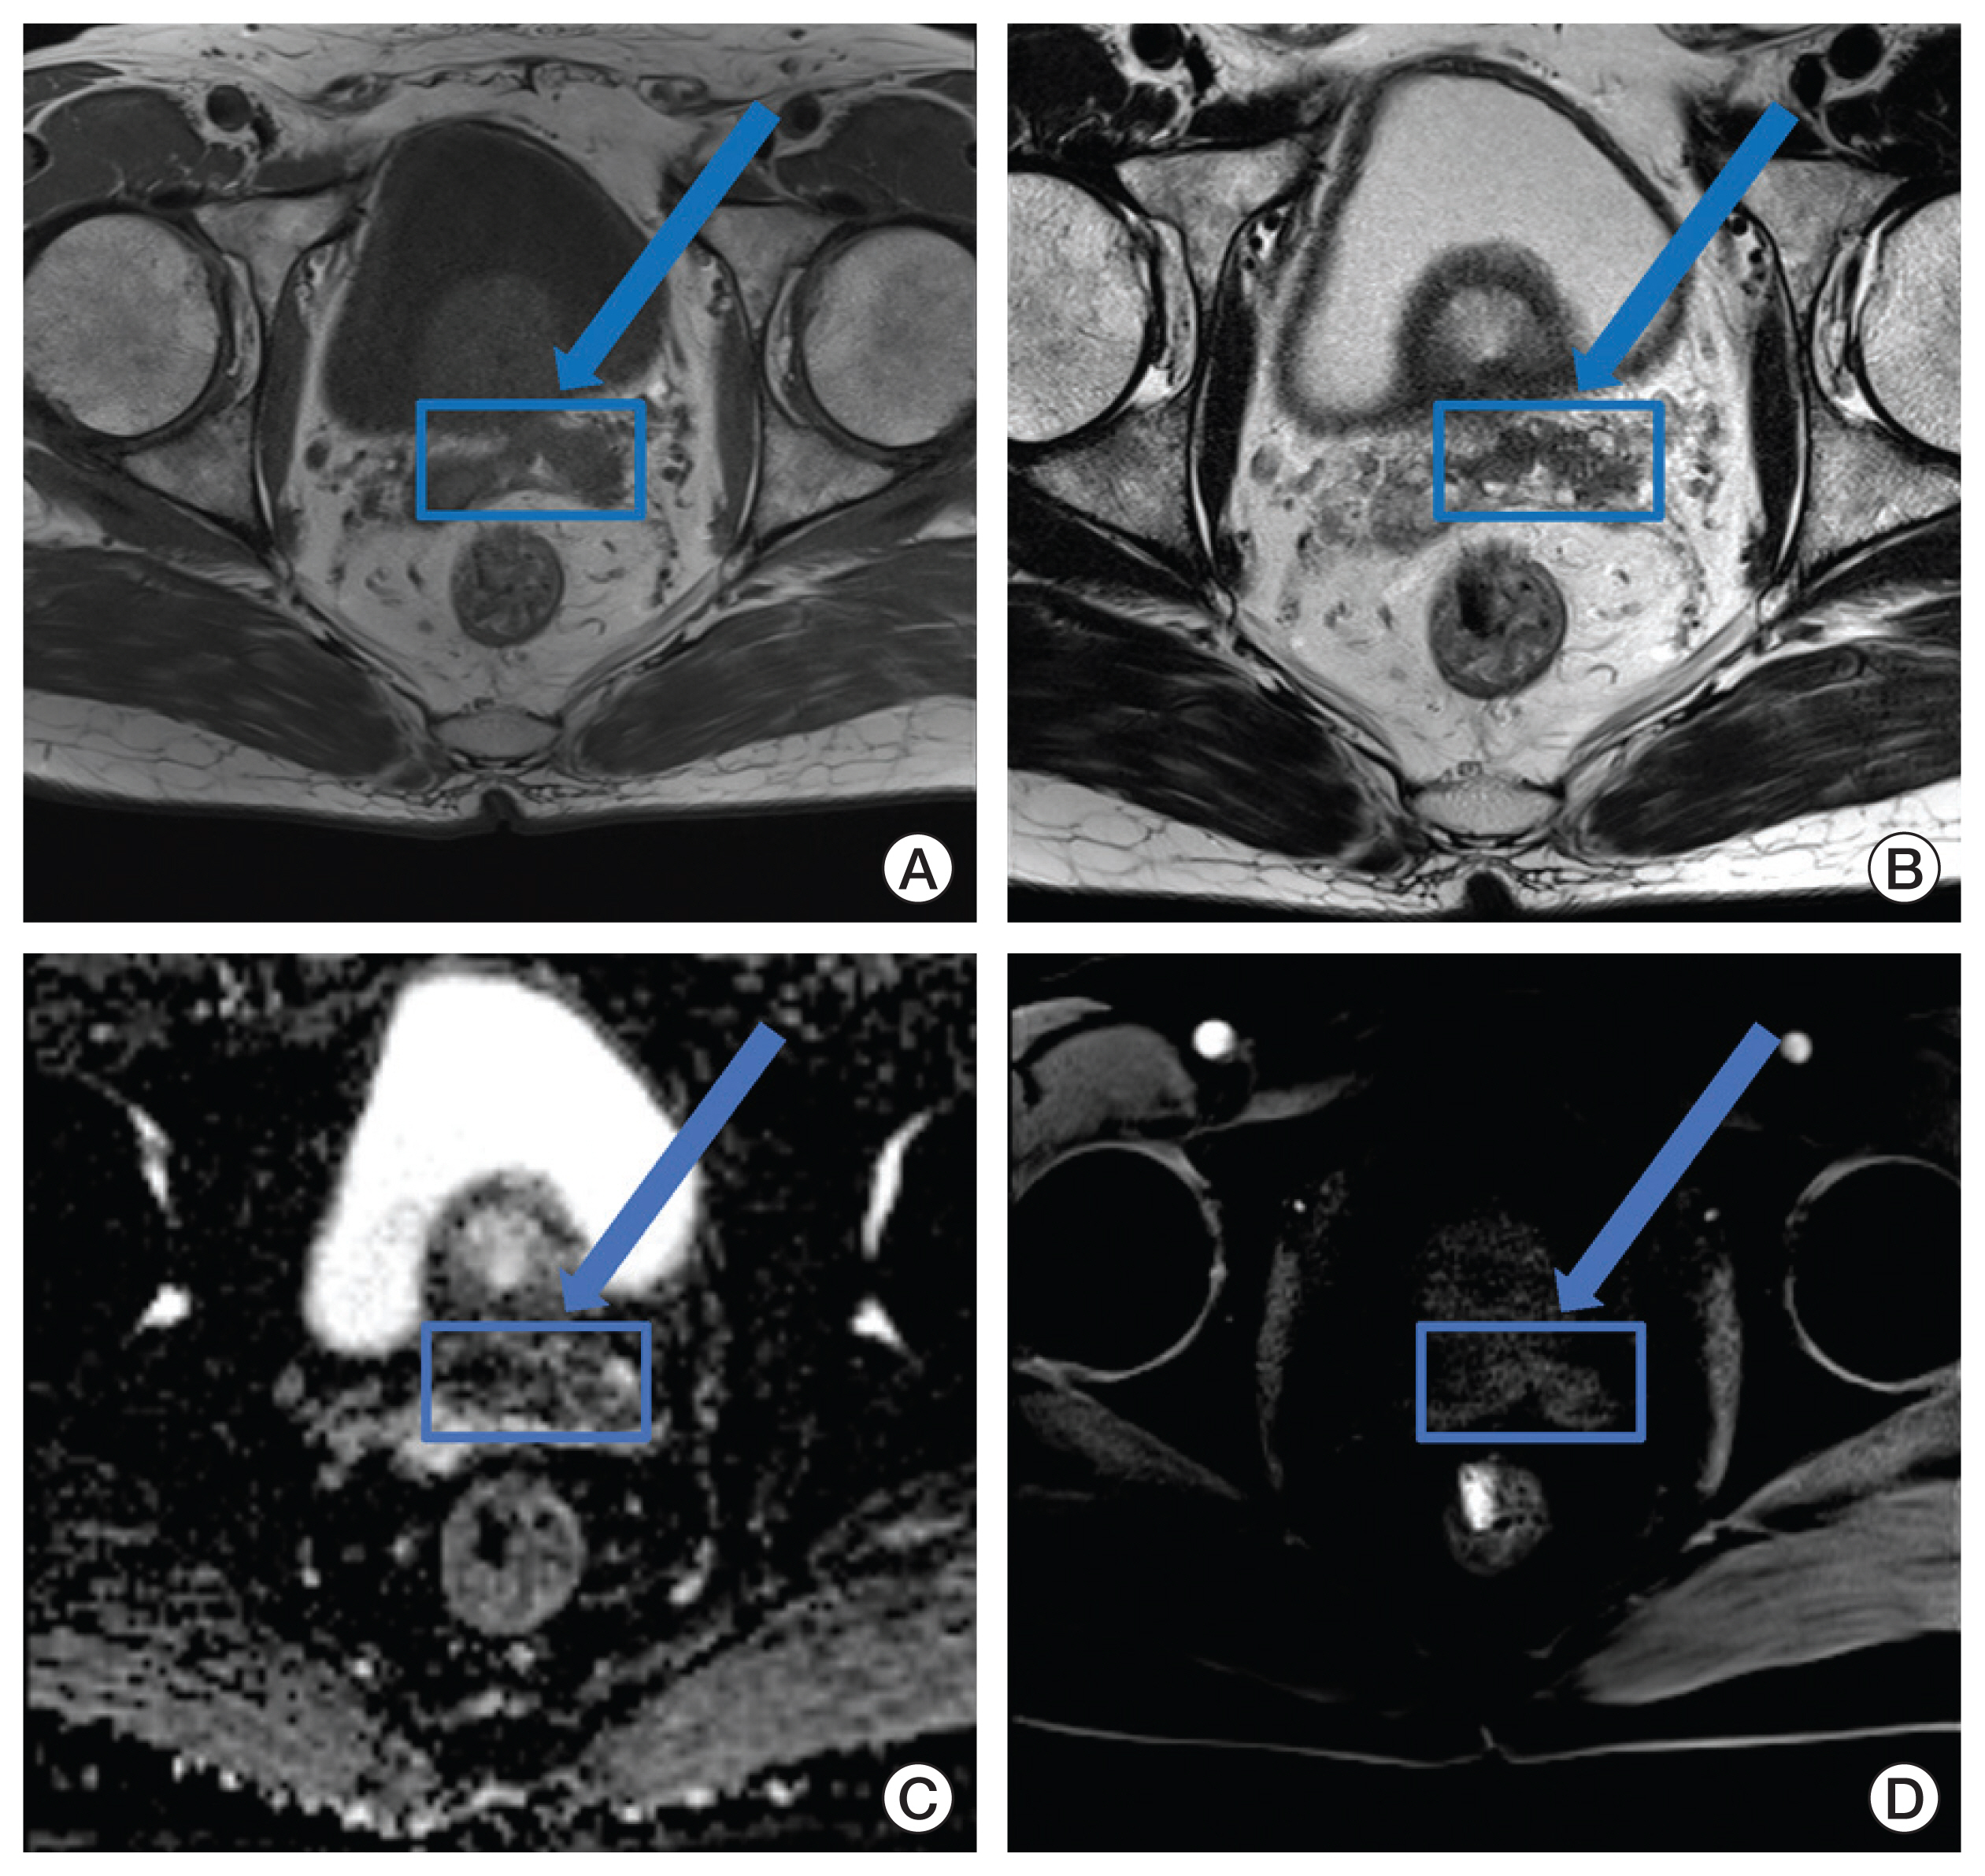
All patients were preoperatively evaluated with at least T2-weighted and T1-weighted images. Diffusion-weighted and dynamic contrast-enhanced imaging were optional. MRIs were reviewed by 1 of 3 genitourinary imaging-specialized radiologists (S.H.K., J.Y.C., or S.Y.K.). Definite low signal abnormality on T2-weighted imaging was regarded as a clinically overt disease (Fig. 1). These findings were integrated for MRI-based clinical T-staging (cTMRI).
2. Multivariate logistic regression model
Multivariate logistic regression analysis (backward step-wise) was performed using SPSS ver. 22.0 (IBM Corp., Armonk, NY). The iPSA, percentage of positive biopsy cores (PPC), both lobe involvement on biopsy (BLI-Bx), GS, and cTMRI stage were considered as risk factors for predicting ECE, SVI, and RM+ve. All factors were regarded as continuous variables, except BLI on biopsy. GS of 7(4+3) was coded as 7.5 to distinguish from the GS of 7(3+4). The level of statistical significance was set at p < 0.05.
3. Establishing and validation of BN models
Three aforementioned pathologic findings were defined as class variables: ECE, SVI, and RM+ve. For each class variable, three different BN models were generated [15]. We adopted the naïve Bayes classifier algorithm to establish each BN model and all variables were conditionally independent of the class variable. Therefore, we first selected the variables to be incorporated into the BN model from the multivariate logistic regression model. Afterwards, they were categorized into two to four states. Discretization of continuous variables was applied mostly based on the NCCN risk-grouping system.
For each BN model, we validated the model performance by 5-fold validation. The mean area under the receiver operating characteristic curve (AUC), calibration index, and accuracy were measured. We visualized the impact of each node on the mean value of the class variable while holding the probability distributions of other variables fixed. Additionally, mutual information (MI) was calculated between each node and the class variable to estimate the probabilistic dependence. MI between two random variables X and Y is defined as the difference between the marginal entropy H(X) and its conditional entropy H(X|Y) [16]. H(X) is the entropy for X and H(X|Y) is the conditional entropy for X given Y. MI is intended for measuring the mutual dependence between two random variables. Normalized and relative MIs were computed. In each BN, a clinically interpretable decision tree was generated to estimate the probabilities of risk factors. Finally, each BN model was uploaded to a public Bayesian license server, providing public access to our models. A G-test of independence was performed for MI between two random variables. BN analysis was performed using the BayesiaLab 9.1 (Bayesian Limited Company, France).
4. Internal comparison between the BN model and the Roach formula
The risk of pathological ECE and SVI were calculated in all patients based on the Roach formula as the following: ECE risk (%)=1.5×iPSA+(10×(GS-3)); SVI risk (%)=iPSA+(10×(GS-6)) [17]. Values exceeding 100% were considered as 100%. The DeLong’s comparison method was used to compare the performance of BN and Roach models [18].
Results
1. Concordance between cTMRI and pathological T-stage
When cTMRI and pathological T-stage were classified in three groups (T1c-T2c, organ-confined; T3a, ECE; T3b, SVI), the concordance rate between cTMRI and pathological T-stage was 66.0% (1,293/1,915). Pathological T-stage was down-staged in only 4.8% (92/1,915). However, up-staging was frequently observed with 29.2% of patients (560/1,915) demonstrating higher pathological T-stage compared to cTMRI. Among 110 patients with cTMRI3a, 14 (12.7%) and 36 (32.7%) patients were up-staged to pT3b and down-staged to pT2, respectively. In 150 patients with cTMRI3b, 32 (21.3%) and 24 (16.0%) patients were down-stage to pT2 and pT3a, respectively.
2. Multivariate logistic regression model
In the multivariate logistic regression model, an increase in iPSA, PPC, GS, and cTMRI were significant risk factors for ECE, SVI, and RM+ve. BLI-Bx was only significant for ECE. Table 2 summarizes the multivariate logistic regression model.
3. Prediction of ECE with BN
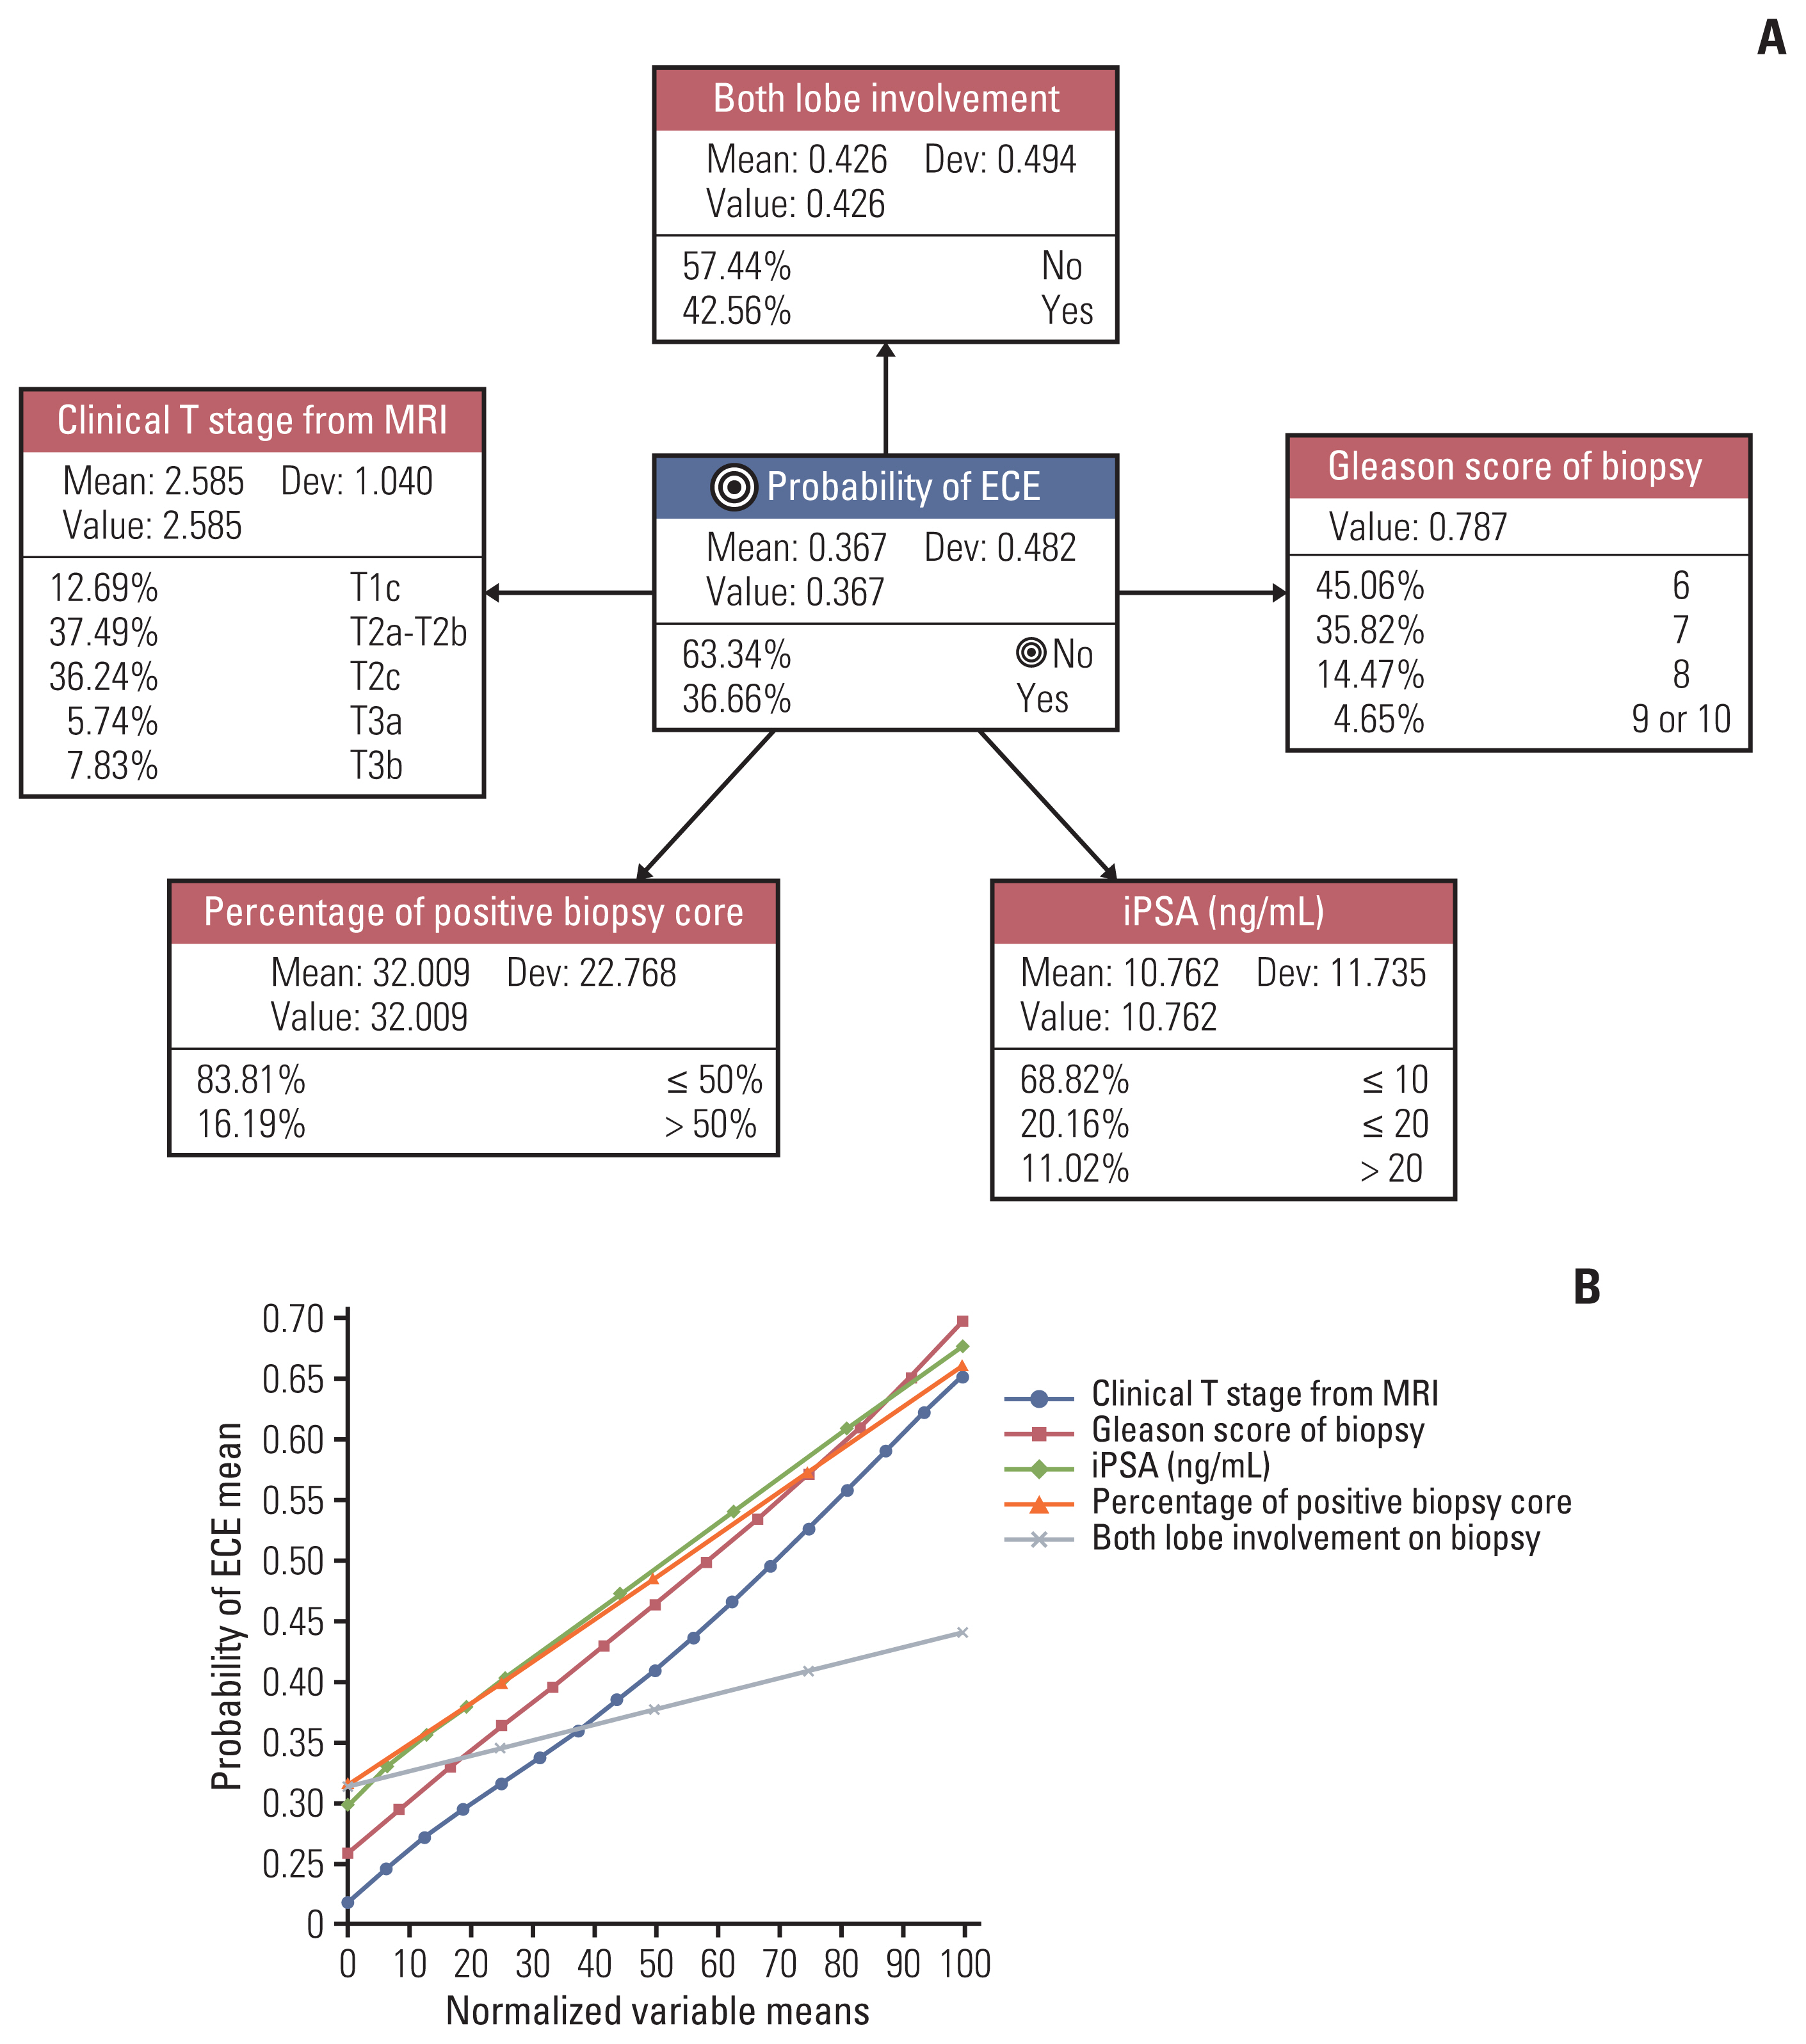
The BN structure predicting the probability of ECE is demonstrated in Fig. 2A. Each node of the BN structure had a baseline probability distribution. Five-fold validation revealed that this network had an AUC of 0.76 and an overall accuracy of 73.0% (Table 3). In addition, the most well-calibrated BN model was the ECE model (calibration index=79.7%). The nodes of the BN model were PPC, iPSA, GS, cTMRI, and BLI-Bx. These nodes all had a linear relationship with the probability of ECE (Fig. 2B). Of these, PPC had a normalized MI of 8.22% (G-test, p < 0.001) as the most important factor. On the other hand, BLI-Bx had the lowest normalized MI of 2.62% (G-test, p < 0.001) (Table 4). Based on this BN model, the individualized scenarios with the highest risk of ECE are summarized in S1 Fig. It is important to note that the tree does not represent every possible clinical scenario, which can be found in a separate web-user interface.
4. Prediction of SVI with BN
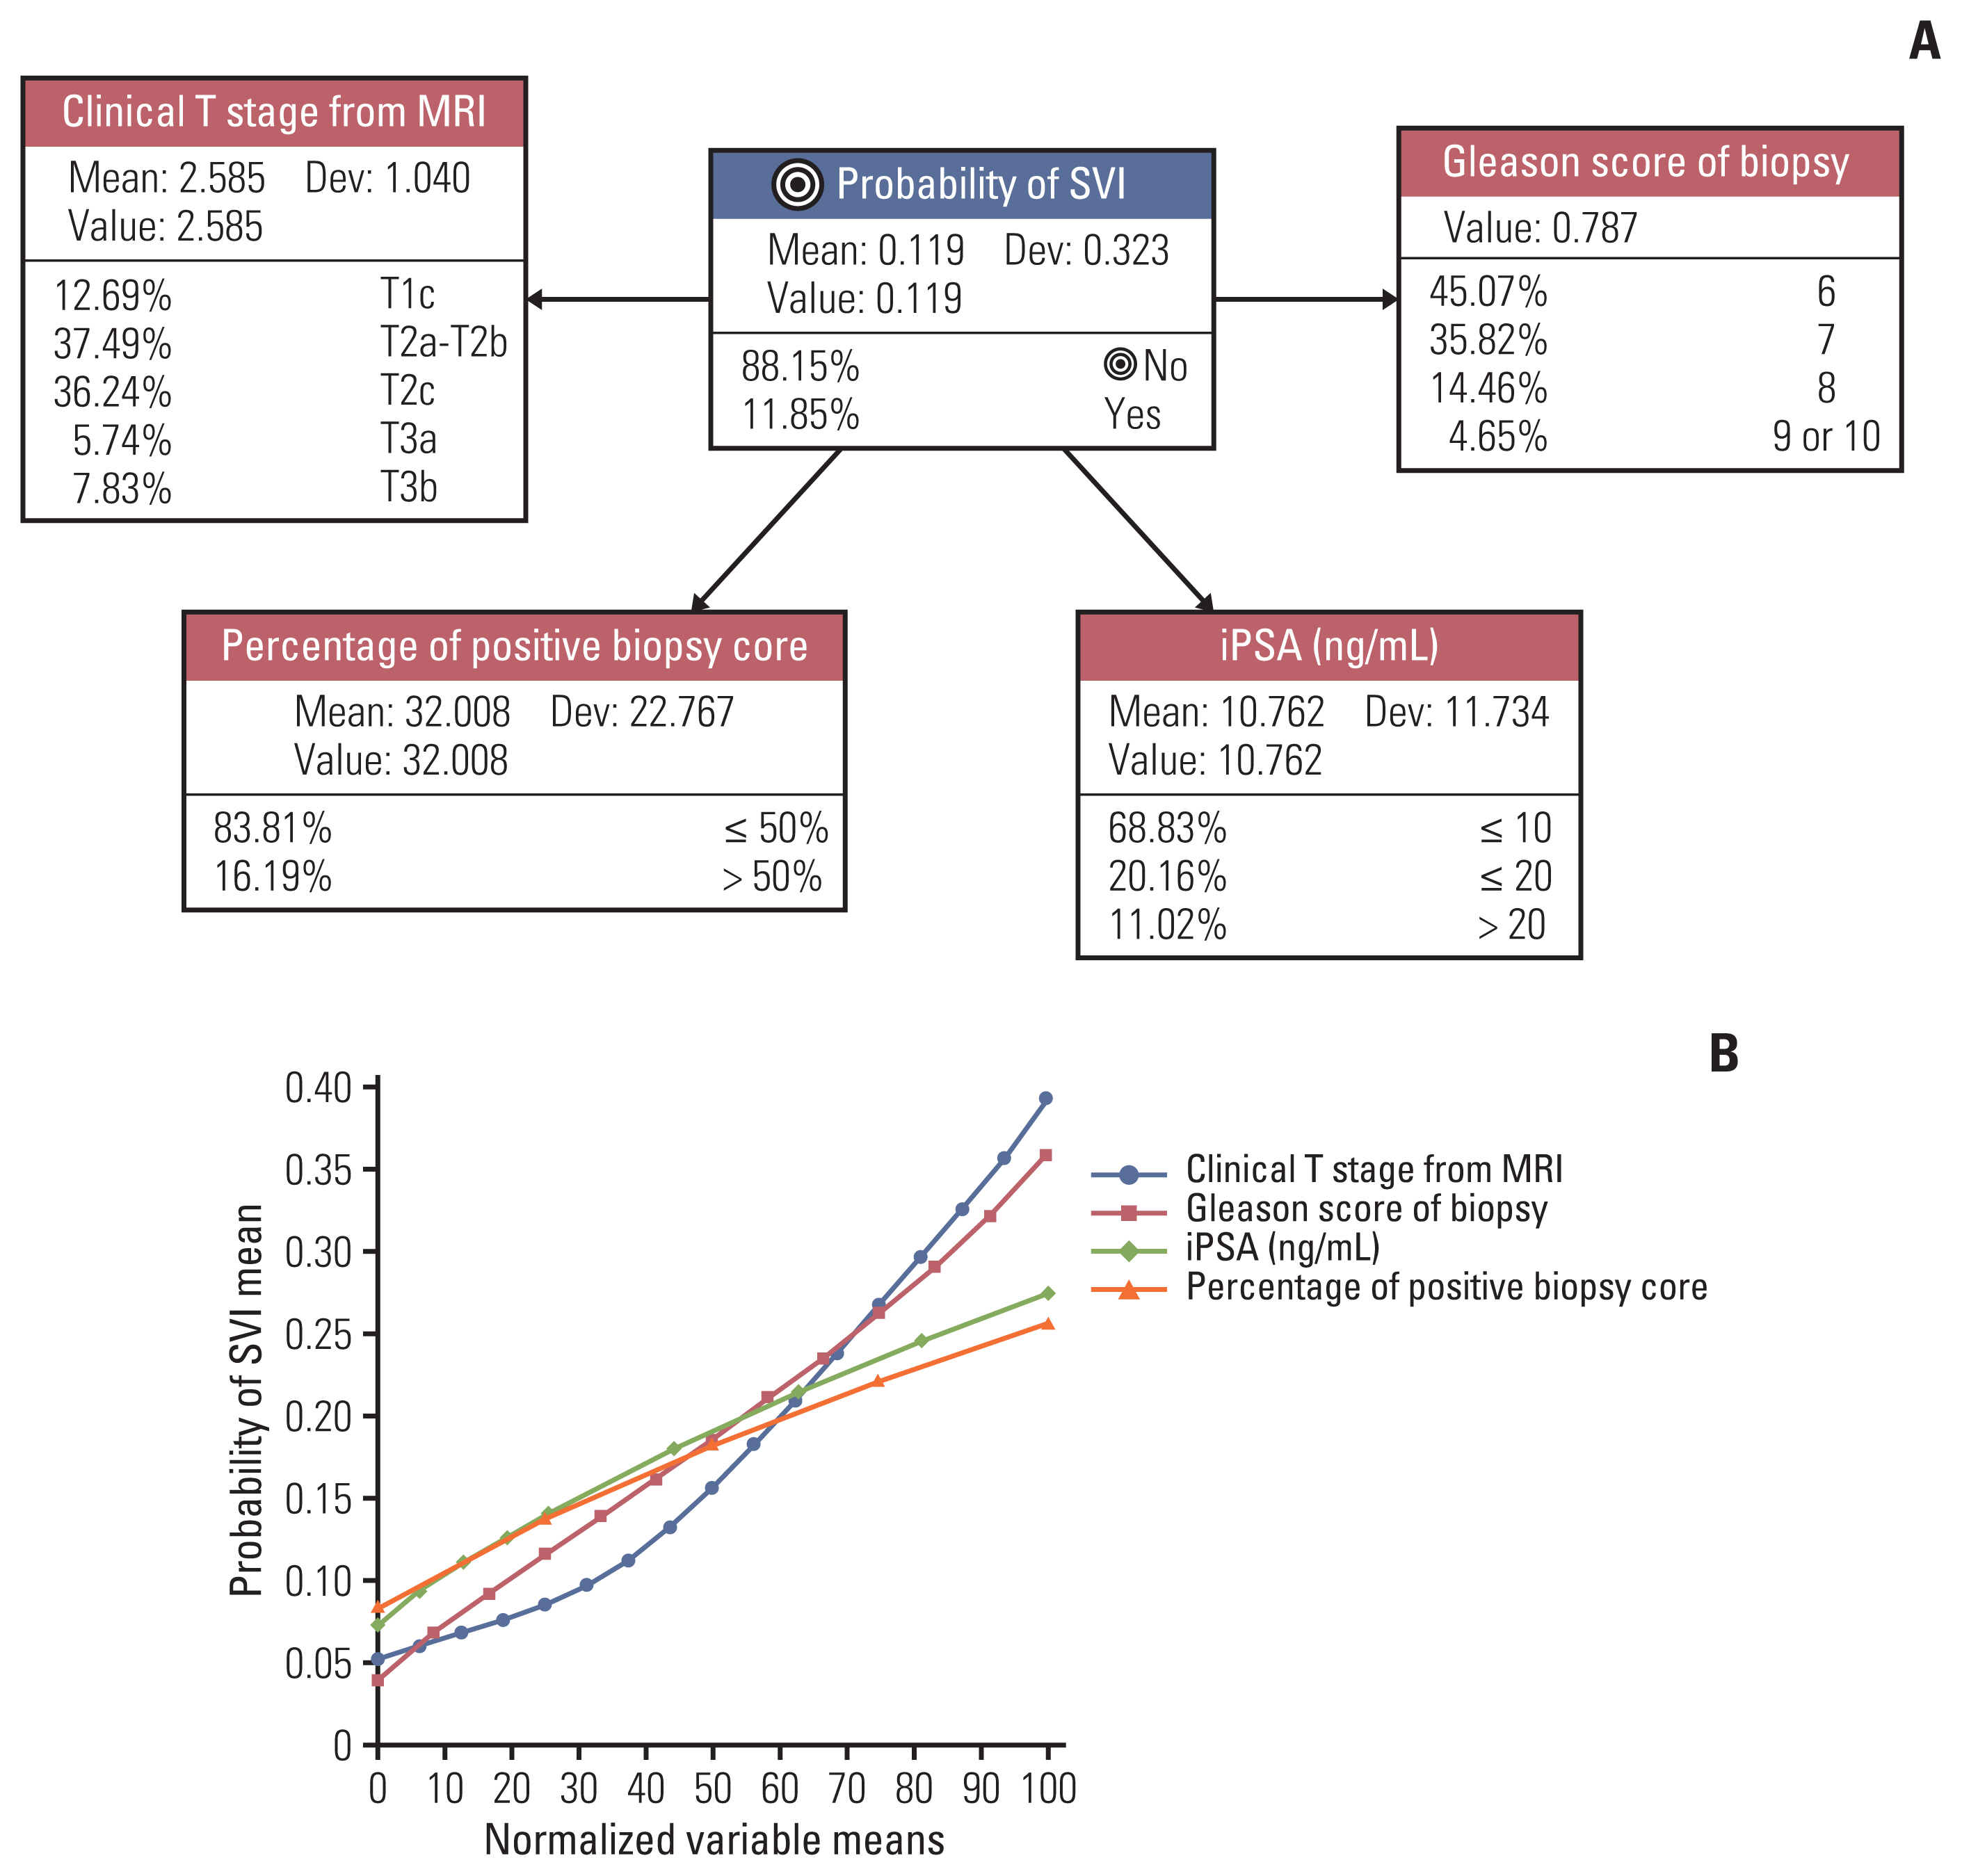
The BN model to predict the probability of SVI included cTMRI, GS, iPSA, and PPC (Fig. 3A). Among the three BN models, SVI prediction model showed the best performance with AUC of 0.88 and overall accuracy of 89.6%. However, its calibration index (62.6%) was the lowest among the BN models (Table 3). The cTMRI and GS of biopsy exponentially increased the probability of SVI (Fig. 3B), with cTMRI being the most important factor for the risk of SVI (normalized MI, 9.85%; p < 0.001) (Table 4). Similarly, GS also had significant relative importance (normalized MI, 9.02%; p < 0.001). By contrast, both iPSA and PPC showed low relative significance in terms of the risk of SVI. The clinical scenarios with the highest probability of pathological SVI are schematized in S2 Fig.
5. Prediction of RM+ve with BN
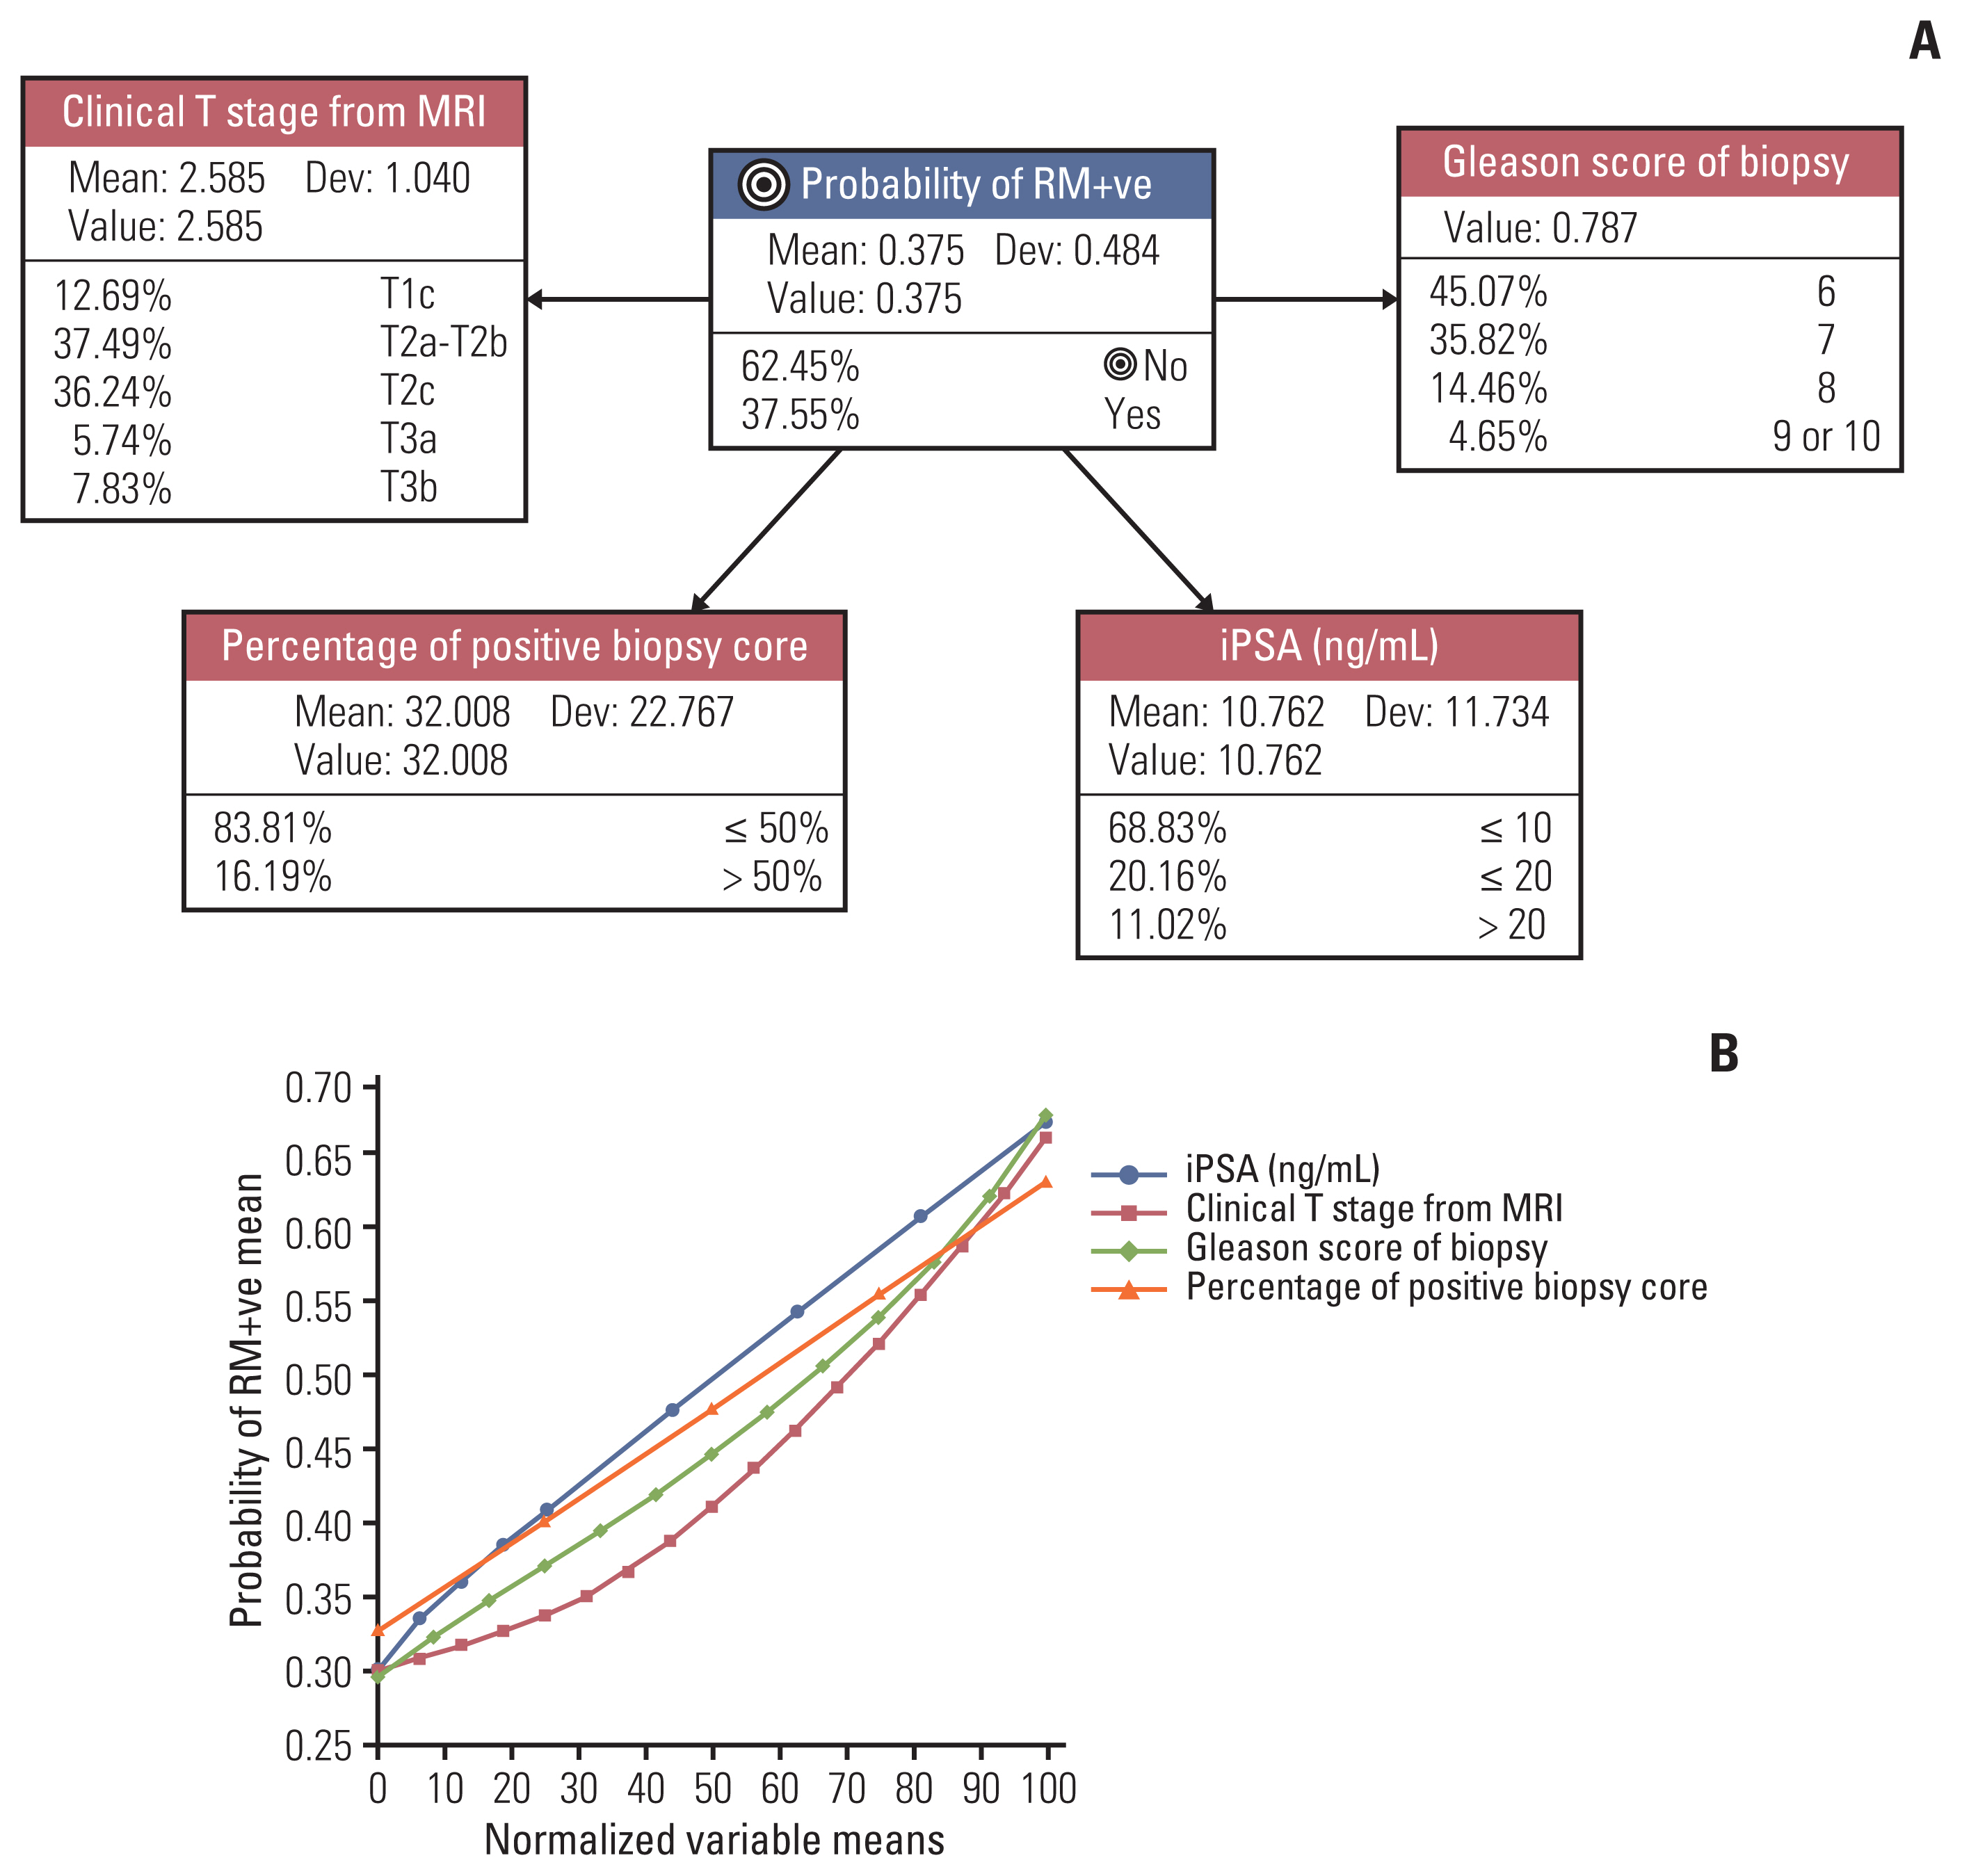
To predict the probability of RM+ve, we established a BN network model that contained iPSA, PPC, cTMRI, and GS of biopsy (Fig. 4A). The AUC, calibration index, and overall accuracy of this model were 0.70, 75.1%, and 69.1%, respectively (Table 3). The impact of each node on the probability of RM+ve is illustrated in Fig. 3B. Increasing iPSA and PPC were linearly associated with an increased risk of RM+ve. On the other hand, cTMRI and GS exponentially increased the chance of RM+ve (Fig. 4B). The most influential factor was iPSA (normalized MI, 6.40%; p < 0.001) followed by PPC (normalized MI, 5.51%, p < 0.001) (Table 4). Similar MI and relative importance were observed between cTMRI and GS with regard to the risk of RM+ve. We then generated an interpretation tree of several clinical scenarios with the highest risk of RM+ve (S3 Fig.).
6. Implementation of web-user interface
We implemented each BN model in the web-user interface for convenient use by physicians to estimate the risk of pathological local findings. The web addresses of each model can be found at https://github.com/bigwiz83/SNUHRO_ProstateCancer. Furthermore, individuals accessing the website can test the BN models in private desktop using the uploaded files. An example of the web interface is demonstrated in S4 Fig.
7. AUC values: BN model vs. the Roach formula
In terms of ECE prediction, BN model showed improved performance with marginal significance compared to the Roach formula (AUC, 0.76 vs. 0.74; DeLong’s method p=0.060) (Fig. 5A). The BN model for prediction of SVI showed significantly improved performance compared to the Roach model (AUC, 0.88 vs. 0.84; DeLong’s method p < 0.001) (Fig. 5B).
Discussion
External beam RT with or without brachytherapy or androgen deprivation therapy is a standard treatment option for PCa throughout all risk groups [3,4]. With the routine utilization of intensity-modulated and image-guided RT for PCa, the proportion of PCa patients treated with moderate- to ultra-hypofractionated RT has steeply increased, as supported by biological interpretation of past studies [5]. In this context, precise target delineation can never be emphasized too much.
The current international RT-target delineation guidelines for PCa suggest that ECE and SVI are based on a somewhat simplified risk grouping. The recently published EORTC guidelines suggest adding a 3-mm margin around the prostate for the clinical target volume in order to sufficiently cover possible ECE in intermediate-/high-risk patients [6]. Considering SVI, the guideline recommends including the proximal 1.4-cm and 2.2-cm of the SV in intermediate- and high-risk patients, respectively, when the target is delineated on a planning computed tomography scan [6]. However, there is a small but noted discrepancy in the risk grouping between the EORTC and NCCN guidelines. Clinical T2c disease is regarded as a high-risk factor in the EORTC guidelines, whereas it is an intermediate-risk factor in the NCCN guideline [4,6]. Therefore, it might be more reasonable to individually estimate the probability of ECE or SVI in patients based on each risk factor that significantly predicts the risk of ECE or SVI and implicate the prediction to RT-target volume delineation. For example, in the PROFIT trial, experimenting with a hypofractionated schedule of 60 Gy in 20 fractions in intermediate-risk PCa, the proximal 1.0-cm SV was included in the clinical target volume only when the predicted risk of SVI exceeded 15% based on Partin’s nomogram [20,21]. Similarly, in the CHHiP trial, patients with localized PCa were individualized for inclusion of SV in the clinical target volume based on the findings from Roach [17], not the overall risk grouping [22,23].
Partin’s nomogram as well as Roach’s formula predict the risk of ECE or SVI with respect to possible individual risk factors, such as clinical T-stage, iPSA, and GS [17,21]. In this context, we developed two separate models using multivariate logistic regression analysis and BN to provide convenient prediction of ECE, SVI, and RM+ve risk to physicians, and to guide RT-target delineation considering all individual factors such as cTMRI, iPSA, GS, PPC, and BLI-Bx. Although pretreatment MRI is an accurate modality when discriminating organ-confined vs. ECE/SVI in PCa [9–11], and those findings are an indicator of relapse or metastases [23,24], MRI is discouraged from being used as a staging modality in the 8th edition of the AJCC staging system [8] as well as in the models from Partin et al. [21] and Roach [17]. Furthermore, detecting SVI with digital rectal exams is prone to error, and the correlation between pathological SVI and clinical staging with digital rectal exam might be poor compared to other risk factors such as iPSA levels, tumor differentiation, or PPC on biopsy [25]. To add the value of MRI in predicting ECE and SVI, we integrated the MRI findings to clinical staging, referred to cTMRI staging in the current study. The cTMRI had the highest correlation with pathological SVI in the BN model (normalized MI, 9.85%; p < 0.001). It was also a significant indicator for pathological ECE. The additional value of our models is the integration of PPC, which is also known to increase the risk of ECE, SVI, and RM+ve [25–27]. Indeed, it significantly correlated with all three endpoints in both models (all p < 0.001). Due to the wide use of pretreatment MRI, a major portion of radiation oncologists and urologists might already be using the concept of cTMRI in daily practice, although not stipulated in any publication.
A major limitation of using the cTMRI concept is that no standardized criteria for local staging with MRI currently exist, which is a major limitation of our study as well. Although we used a simple criterion of definite low signal intensity on T2-weighted imaging as an abnormal finding, multiparametric MRI (mpMRI) including diffusion-weighted and dynamic contrast-enhanced imaging is the recommended modality currently [3,4,28]. Consecutive efforts are being made to introduce mpMRI findings in clinical practice. For instance, Mehralivand et al. [29] suggested a grading system for extraprostatic extension with mpMRIs based on findings such as the length of contact with the prostatic capsule, capsular bulging, or obliteration of the rectoprostatic angle, which were highly correlated with the presence of actual extraprostatic invasion in their prostatectomy specimen. A report from Giannarini et al. [30] showed that the combination of only two sequences, diffusion-weighted and T2-weighted axial imaging, has comparable performance to mpMRI in predicting pT3 or higher disease. Grivas et al. [31] have also demonstrated a superior accuracy in predicting pathological SVI when mpMRI is added to the Partin model compared to relying on the Partin table alone. It is overt that the more advanced the MRI findings, the higher the risk of pathological ECE, SVI, and RM+ve [9–11]. However, standardization of criterion and quantification of MRI findings in order to be used as a standard staging modality are yet to be done, as well as the integration into the AJCC T-staging of PCa for guiding clinical practice. At this point, cTMRI should be determined mostly by genitourinary expert radiologists.
BN is a probabilistic graphical model for decision support. In the current study, we could infer important associations between variables and class variables such as ECE, SVI, and RM+ve by using BN models. These BN models can practically support risk adapted-treatment of patients because they can instantly respond to the clinician’s request or questions with a visual and interpretable representation. In addition, the BN approach can decompose the prediction model and demonstrate how clinical factors affect the predicted class variables. The current study revealed non-linear as well as linear relationships between risk factors, which are not often captured by the logistic regression model. Moreover, MI was calculated to measure the relative importance among variables. The performance of the BN models in the current study were acceptable for predicting ECE and SVI (Table 3), especially SVI. Furthermore, in the internal comparison between the BN model and Roach formula [3], our BN model showed improved AUC values compared to the Roach model for ECE (p=0.060) and SVI (p < 0.001) prediction, although the difference for ECE was marginally significant and the absolute difference were modest. This might reflect the necessity of integrating MRI findings such as the ‘cTMRI’ as used in our study to accurately predict pathological findings. However, our BN model warrants external validation in future studies.
In summary, we have successfully developed two models based on the multivariate logistic regression analysis and BN to estimate the risk of pathologic ECE, SVI, and RM+ve based on several clinical factors in PCa. These models are expected to be applied in patients with PCa to predict the risk of pathological ECE, SVI, and RM+ve, and eventually guide radiation oncologists throughout the target-delineating process and urologists in deciding treatment modality.