Introduction
Solitary fibrous tumor/hemangiopericytoma (SFT/HPC) is a rare mesenchymal tumor that originates in the pericytes throughout the body, first recognized by Stout and Murray in 1942 [1]. Intracranial SFT/HPC is a rare entity comprising only about 0.4% of all the primary brain tumors [2]. SFT/HPC is characterized by high rates of local and extracranial metastasis, unlike typical primary brain tumors [3–5]. Among long-term survivors, long-term observation showed a persistent risk of recurrence even 10 years after initial resection [6–8]. Therefore, this rare and aggressive tumor with unique behaviors might require aggressive treatment and long-term follow-up.
However, a low incidence and unique disease course have led to a meagre number of comprehensive studies to establish evidence-based treatment according to the disease status. Previous small-sized retrospective studies consistently reported that gross total resection (GTR) provided better disease control than subtotal resection (STR) [4,9,10]. Postoperative radiotherapy (PORT) delivered in patients undergoing STR for SFT/HPC has shown effective local control (LC) [11–13]. However, it remains unclear whether PORT affects disease control in terms of the pattern of failures and clinical outcomes in patients with GTR or low-grade SFT/HPC based on the heterogeneous small-sized retrospective studies. Meta-analysis and population-based studies have attempted to elucidate the clinical benefit of PORT [6,9,14]. However, they reported only overall survival (OS) results due to a lack of detailed clinical information and inconsistent survival results regarding the survival benefit of PORT, making the findings inconclusive. The large cohort, the multicenter, retrospective study will provide novel insights to guide treatment decisions for optimizing PORT in patients with SFT/HPC.
In this multi-institutional study by the Korean Radiation Oncology Group (KROG 18-01), we aimed to evaluate the role of PORT and prognostic factors in intracranial SFT/HPC.
Materials and Methods
1. Eligibility
This study was registered at http://www.KROG.or.kr (protocol number 18-11). Institutional review board approval was obtained from KROG, and each of the participating institutions. This study recruited pathologically confirmed SFT/HPC patients diagnosed between 1995 and 2016 from eight tertiary referral institutions in Korea. The inclusion criteria for accrual were as follows: (1) patients who underwent primary surgery; (2) histologically confirmed; and (3) evaluation of the extent of surgery with operation record and postoperative magnetic resonance imaging. We excluded patients who underwent surgery or radiotherapy for other brain tumors in the past, received preoperative chemo- or radiotherapy for SFT/HPC, or diagnosed with any cancer other than differentiated thyroid cancer within the previous five years. Radiotherapy for salvage aim at recurrence was not considered as PORT. A total of 133 patients met the inclusion criteria.
2. Patients and treatment
Patient characteristics are shown in Table 1. All patients underwent surgical resection as the primary treatment. For SFT/HPC, 86 (65%) and 47 (35%) patients underwent GTR and STR, respectively. Histological evaluation suggested grade II and III in 67 (52%) and 63 (49%) patients, respectively. Following the procedure, PORT was delivered to patients as per the physician’s decision or institutional policies. Of all the patients, 64% (85 of 133) received PORT. Of these, 98% (83 of 85) received PORT within three months of surgery as a planned adjuvant therapy. The delayed PORT was performed in only two patients at six months postoperatively, and these two patients had no evidence of recurrence at the time of PORT. After GTR and STR, PORT was delivered in 63% (54 of 86) and 66% (31 of 47) of patients, respectively. In patients with grade II and III, PORT was delivered in 58% (39 of 67) and 70% (44 of 63) of patients, respectively. There was no statistical difference in the value of follow-up duration, age, sex, performance, tumor location, tumor diameter, World Health Organization (WHO) grade, Ki-67, and extent of surgery according to PORT. Fractionated radiotherapy was administered in 77 out of 85 patients. The median number of fractions was 30, and the median dose was 60 Gy (interquartile range [IQR], 55 to 61.2). In patients undergoing GTR and STR, the median dose of radiotherapy was 60 Gy (IQR, 55 to 60) and 60 Gy (IQR, 54 to 61.2), respectively. In the patients with grades II and III, the median dose of radiotherapy was 59.4 Gy (IQR, 54 to 60) and 60 Gy (IQR, 59.4 to 61.2), respectively (p=0.001). PORT modality included 2-dimensional conventional radiotherapy (4%, 3 of 85), 3-dimensional conformal radiotherapy (55%, 47 of 85), and intensity-modulated radiotherapy (32%, 27 of 85). The details of planning for fractionated radiotherapy were available in 97% (75 of 77) of patients. The median margin for clinical target volume (CTV) was 1.5 cm from gross tumor volume (range, 0.5 to 2 cm). Single-fraction radiosurgery (SRS) with 18 Gy was performed in eight patients who underwent STR. All fields of PORT encompassed only involved sites without whole-brain or craniospinal irradiation. Small margin < 0.5 cm was applied in 16 patients, including the eight patients receiving SRS, while a large margin of 1.0–2.0 cm was applied in 66 patients. Adjuvant chemotherapy was administered after PORT in four patients. Etoposide, ifosfamide, and cisplatin were used in two of four. Doxorubicin and ifosfamide were used in one of four patients, and cyclophosphamide was used in one patient.
3. Statistical analysis
Tumor recurrence was categorized as local, regional, or distant recurrence. Local recurrence was defined as an event within the target volume of radiotherapy and within 2 cm from the surgical bed and residual tumor in patients without PORT, because the maximal margin for radiotherapy was 2 cm. Regional recurrence was defined as a remote intracranial event beyond the local area. The endpoints of the study were OS, progression-free survival (PFS), LC and regional control (RC) rates, and distant metastasis-free survival (DMFS). OS was defined as the time from the first date of treatment to the date of death from any cause, with survivors being censored at the time of last follow-up. PFS was calculated as the interval from the first date of treatment to the detection of any recurrent/progressive disease or death, whichever occurred first. LC and RC were defined as the time from the first date of treatment to the date of local and regional recurrence. DMFS was calculated as the interval from the first date of treatment to the detection of extracranial metastasis or death, whichever occurred first. Patients who were alive and disease-free at the time of last follow-up were censored. Univariate and multivariate analyses for endpoints were performed using the log-rank test and the Cox proportional hazard model. The subgroup analysis regarded the significant factors of the analysis in the whole group as confounders in the multivariate analysis. Time-dependent Cox proportional hazards models were used to evaluate the correlations between patterns of failure and survival. OS after the first failure was calculated as the interval from the first date of recurrence detection to the date of death from any cause, with survivors being censored at the time of the last follow-up. LC after the first local recurrence was calculated as the interval from the date of detection of the first local recurrence to the date of detection of the second local recurrence.
Results
1. Survival
The median follow-up duration was 76.9 months. The 5-year OS, PFS, LC, RC, and DMFS were 97%, 60%, 69%, 98%, and 87%, respectively. The 10-year OS, PFS, LC, RC, and DMFS were 80%, 34%, 51%, 87%, and 63%, respectively.
2. Patterns of failures
Recurrence during follow-up was detected in 68 patients (51%). The patterns of the first failure were local in 51 patients (75% of recurrences), regional in five patients (7%), and distant in 16 patients (24%). The main patterns of all failures were both local (42% of recurrences) and distant (40%) in the patients with PORT, but predominantly local (68%) in those without PORT (Table 1). In the subgroup of patients without PORT, local recurrence was the main pattern of failure, with 50% after GTR and 88% after STR, respectively (Table 2). In the STR subgroup with PORT, the local and distant recurrences were observed in 37% and 23% of patients, respectively. In contrast, in the subgroup of GTR with PORT, distant failure was the main pattern of failure in 26% of the cases. Median intervals from primary treatment to recurrences were 29.7 months for local recurrences (range, 1 to 232 months), 67.0 months for regional recurrences (range, 60.0 to 128.8 months), and 85.0 months for distant recurrences (range, 20.3 to 159.4 months). The intervals for regional and distant recurrences were significantly longer than intervals for local recurrence (p < 0.001). The main pattern of delayed failures after the 5-year disease-free interval was local in 45% of the patients (14 of 31) and distant in 39% (12 of 31). However, early failures during the initial 5-year period were predominantly local in 90% of the patients (37 of 41). PORT significantly delayed the time to recurrence from 25.0 months to 53.6 months (median value) (p=0.048).
3. Treatment outcomes in all patients
The univariate analysis of the prognostic factors is shown in Table 3; here, age was the only significant factor associated with OS (p=0.010). Additionally, the extent of surgery was marginally significant (p=0.058). PORT was not significantly associated with OS (p=0.762), RC (p=0.439), or DMFS (p=0.191). However, patients who received PORT showed significantly favorable PFS (p < 0.001) and LC (p < 0.001) (Fig. 1A and B). GTR showed a statistically significant improvement in PFS (p < 0.001) and LC (p < 0.001). For DMFS, supratentorial location and WHO grade III were significantly related to unfavorable outcomes (p=0.047 and p=0.020, respectively). The analysis for RC failed to identify any significant prognostic factors.
In the multivariate analysis (Table 3), age (p=0.031; hazard ratio [HR], 3.265; 95% confidence interval [CI], 1.113 to 9.571) was an independent prognostic factor for the prediction of OS. PORT significantly improved PFS (p < 0.001; HR, 0.247; 95% CI, 0.138 to 0.440) and LC (p < 0.001; HR, 0.339; 95% CI, 0.214 to 0.536). STR significantly decreased the rates of PFS (p=0.014) and LC (p=0.001). For DMFS, the independent prognostic factor was only WHO grade III vs. II (p=0.029; HR, 2.010; 95% CI, 1.073 to 3.764).
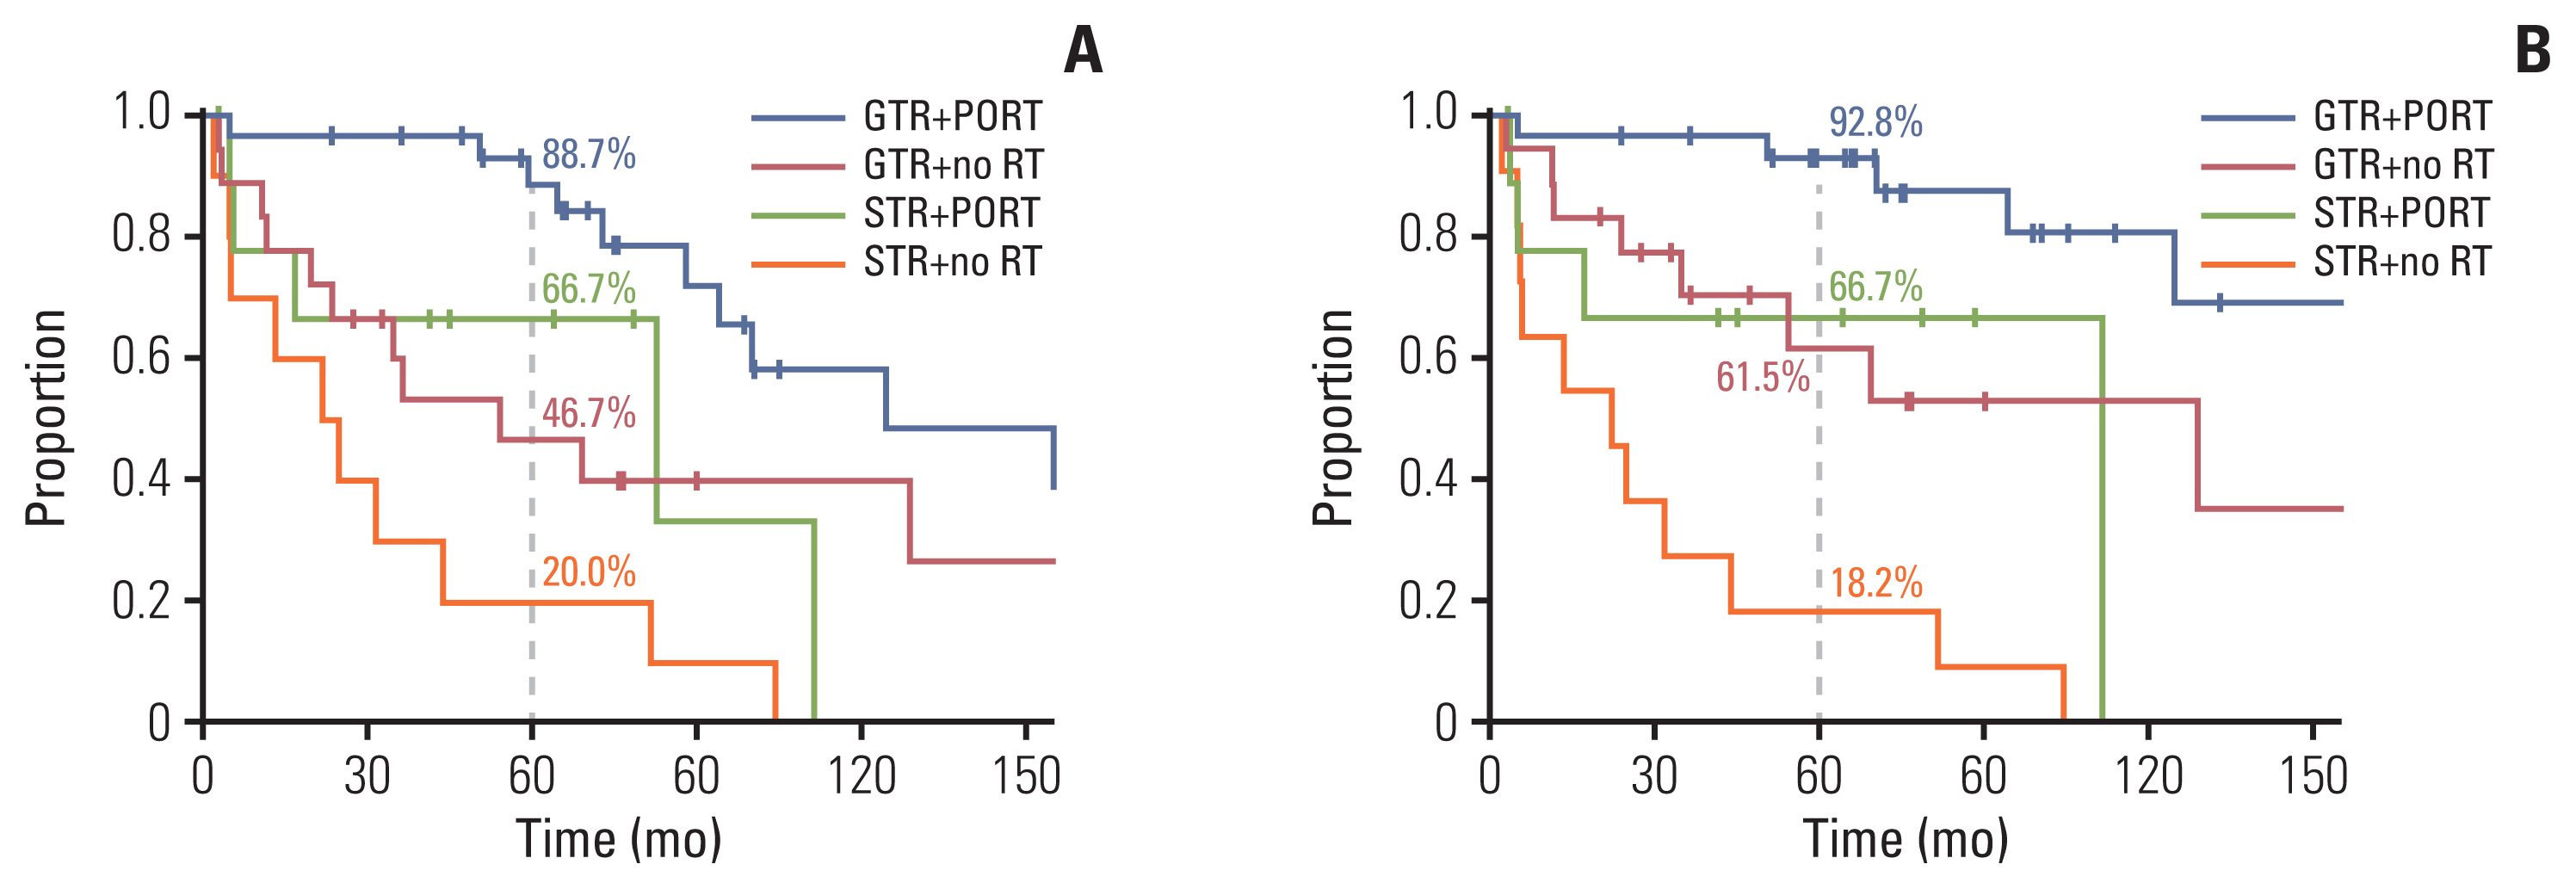
4. Impact of PORT according to the extent of surgery and histologic grade
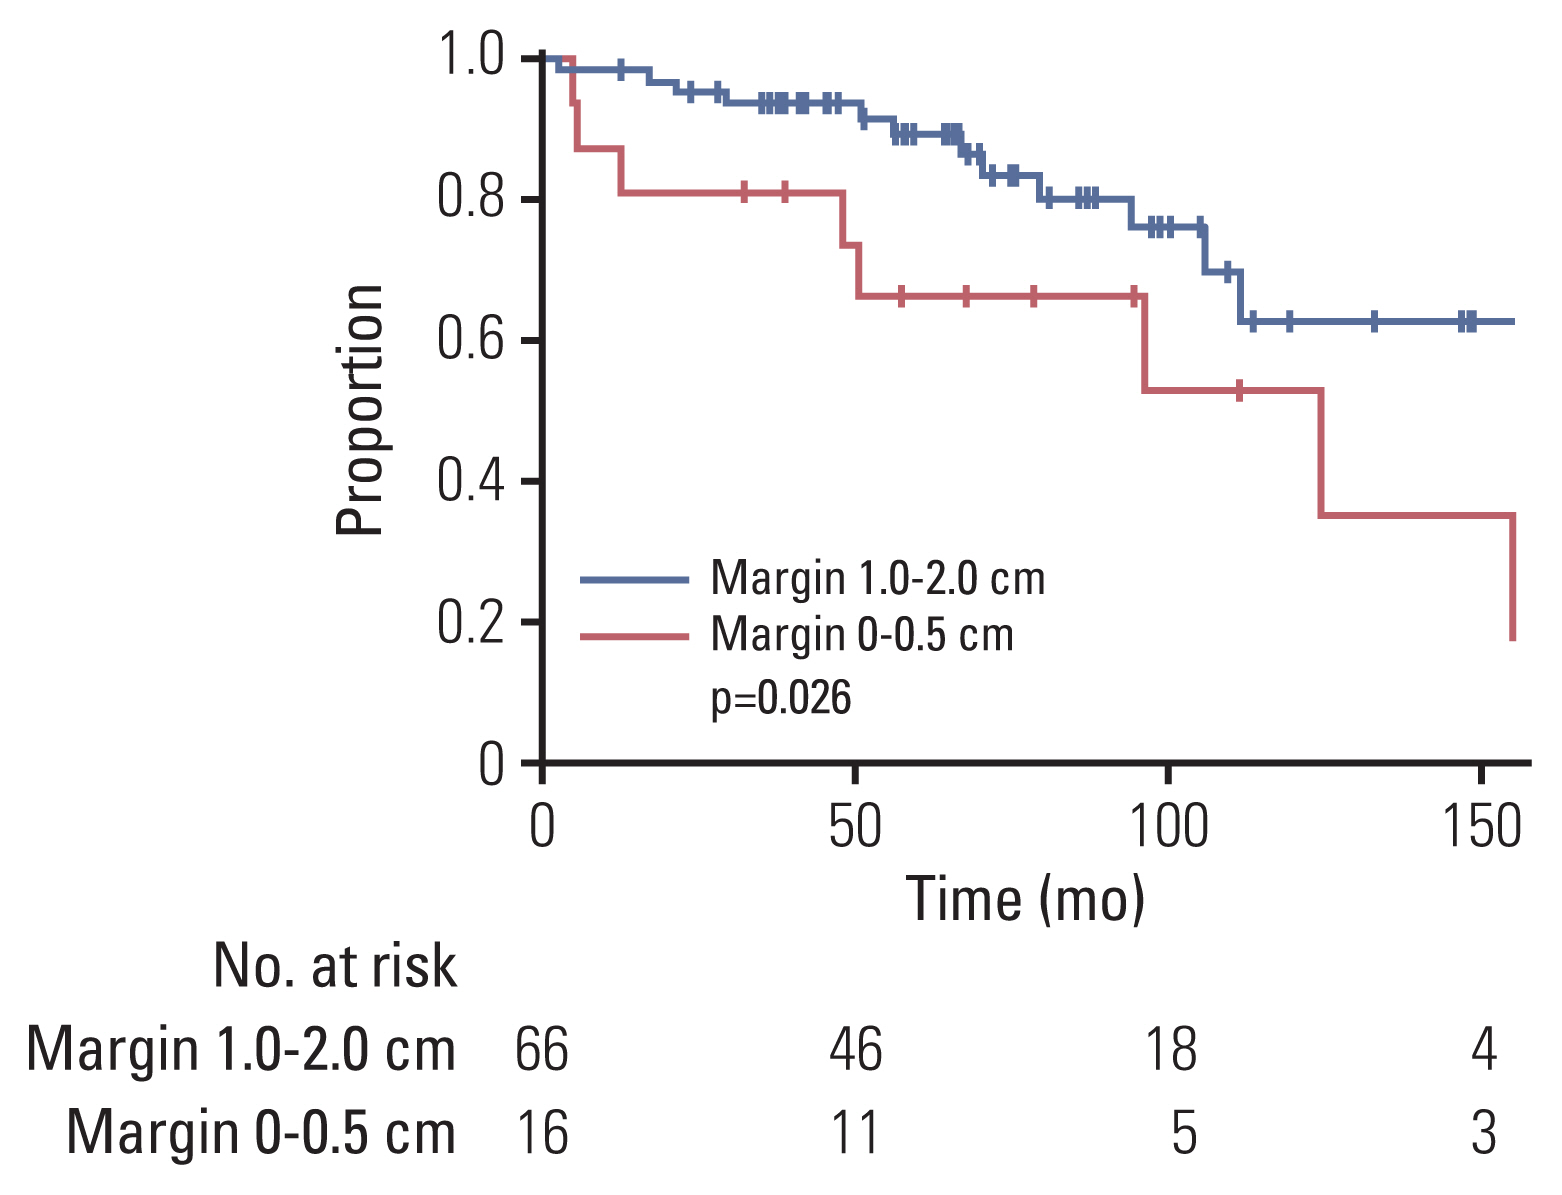
We examined the effect of PORT in a subgroup of patients with GTR (n=86). As for the entire cohort, in univariate analysis, PORT showed a significant improvement in PFS (p=0.001) and LC (p < 0.001), but not in OS, RC, or DMFS (Table 4, S1 Table). In the subgroup analysis of WHO grade II (n=68), PORT also significantly correlated with PFS (p=0.028) and LC (p=0.003), but not with OS, RC, or DMFS (S2 Table). In the multivariate analysis (Table 4), PORT was an independent significant factor related to favorable PFS (p=0.001; HR, 0.128; 95% CI, 0.039 to 0.420) and LC (p < 0.001; HR, 0.242; 95% CI, 0.067 to 0.874). Furthermore, in the subgroup of GTR and WHO grade II (n=48), PORT conferred a significant benefit in PFS compared with radiotherapy (10-year, 58% vs. 40%; p=0.028, log-rank test) and LC (10-year, 81% vs. 49%; p=0.003, log-rank test) (Fig. 1C and D). In the STR subgroup, PORT was also an independent significant factor related to favorable PFS (p < 0.001; HR, 0.214; 95% CI, 0.091 to 0.504) and LC (p=0.005; HR, 0.289; 95% CI, 0.122 to 0.688) (S3 and S4 Tables). Overall, four subgroups, according to the surgical extent and PORT, depicted distinct outcomes in PFS and LC (log-rank p < 0.001 and p < 0.001) (Fig. 2). The GTR and PORT subgroups presented the most favorable outcomes in 5-year PFS (89%) and LC (93%). In contrast, the STR and without PORT subgroups presented the most inferior outcomes in 5-year PFS (20%) and LC (18%). However, PORT was not related to OS, RC, or DMFS in the STR subgroup. In the subgroup of PORT, 0–0.5 cm margin of CTV showed inferior LC rate to large margin with 1.0–2.0 cm (10-year, 53% vs. 63%; p=0.026, log-rank test) (Fig. 3). After adjusting the local effect of surgical extent (p=0.037; HR, 2.757; 95% CI, 0.135 to 0.851), the prognostic value of the larger CTV margin maintained statistical significance in favor of LC (p=0.021; HR, 0.339; 95% CI, 0.135 to 0.851).
5. Survival and salvage treatment after recurrence
The 5-year OS after local, regional, and distant failures was 89.2%, 59.6%, and 63.6%, respectively. Time-dependent Cox analysis showed that regional and distant failures were significantly related to OS (p=0.044; HR, 1.037; 95% CI, 1.037 to 14.069 and p=0.003; HR, 5.107; 95% CI, 1.733 to 15.050), while local recurrences were not (p=0.170). At the first local recurrence in 51 patients, surgery-alone, surgery followed by PORT, and radiotherapy-alone were performed in 10% (5 of 51), 18% (9 of 51), and 73% (37 of 51) of the patients for the salvage aim, respectively. LC after the first local recurrence was 56.2% in 5 years. The salvage treatment types for local recurrences showed no significant difference in LC after the first local recurrence (p=0.996). Of the 51 patients who underwent salvage treatment for the first local recurrence, 45% (n=23) experienced second recurrence, 78% (n=18) received repeated radiotherapy, and 22% (n=5) underwent surgery for second local recurrence.
Discussion
This study dissected the patterns of failures based on the field of PORT to analyze the effect of PORT. Here, PORT conferred a beneficial effect on in-field control at the local sites, which led to a change in the pattern of failures from local failures to distant failures. The impact of LC should be emphasized in SFT/HPC, because the main pattern of first failures in SFT/HPC was local (75%) rather than distant failure (24%), and 90% of the early failures comprised local failures in this study. Thus, the improvement in LC by PORT led to better PFS in the PORT group in this study. Consistent with these findings, previous studies also reported the benefits of local control and disease control [4,10,13,15,16]. In the STR subgroup, PORT also showed the benefit of local control and disease control in this study. However, in patients with GTR, the role of PORT has been unclear with heterogeneous reports [5,11–13]. In this study, in the subgroup with GTR, PORT maintained a significant beneficial effect on LC and PFS. Even after GTR, SFT/HPC tended to recur mainly at the local sites (51%), rather than regional (15%) and distant (34%) sites. These findings suggest that PORT needs to be recommended to achieve a high chance of disease control irrespective of the extent of surgery.
Another favorable subgroup of SFT/HPC is the WHO grade II. Previous studies reported that WHO grade III correlated with recurrence rates [15–17], while Lee et al. [13] showed only non-significant trends for recurrence and death. This discordance may be due to the limited size of the subgroups. The present study revealed that WHO grade II is a prognostic factor that predicts lower extracranial metastasis even after adjusting for other confounders. Furthermore, even in the grade II and grade II plus GTR subgroups, PORT maintained a positive effect on the LC and disease control. To the best of our knowledge, this is the largest retrospective study till date demonstrating LC, PFS improvement of PORT even after adjusting for other potential prognostic factors in both the whole group, and the favorable and unfavorable subgroups according to the surgical extent and grade.
Regarding the target volume, PORT should enclose the residual tumor or surgical cavity with a sufficient margin of > 1 cm to account for possible microscopic invasion of the tumor. Fractionated radiotherapy with 0–0.5 cm margin or SRS without CTV margin showed inferior local control in the current study, even after adjusting for the surgical extent. The role of SRS in SFT/HPC has been studied in small cohort retrospective studies. Several studies have reported comparable disease control rates with radiosurgery [18–21]. Interestingly, Kano et al. [22] and Cohen-Inbar et al. [23] reported that a high marginal dose of > 15 Gy correlated with local failures in SRS. SRS cannot occupy an additional CTV margin for the residual tumor, but the intermediate dose spillage over the target volume may affect tumor control at the local sites. The comparison between SRS without margin and fractionated radiotherapy with margin was not addressed due to the small number of patients undergoing adjuvant SRS in this cohort. However, the current study is the first to show that a sufficient margin of > 1 cm for CTV may be required to encompass the microscopic residual tumor volume after surgery.
Furthermore, this study could not elucidate the survival benefit of PORT. Some single institutional studies have reported that PORT improves [13,15] or does not [4,11,17] improve patients’ survival. Martin-Broto et al. [24], using the Surveillance, Epidemiology, and End Results (SEER), reported that survival gain was observed only in the GTR followed by PORT subgroup, as compared to biopsy-alone subgroup. In contrast, a meta-analysis by Rutkowski et al. [14] reported the detrimental effects of radiation > 50 Gy on survival. However, the findings from SEER and meta-analysis should be interpreted with caution. For instance, Martin-Broto et al. [24] did not analyze the survival gain of PORT compared to surgery-alone; and Rutkowski et al. [14] could not adjust the confounders to analyze the survival effect of PORT, as the information on the radiation dose was absent in patients receiving STR. Moreover, as mentioned above, a lack of clinical information may skew the survival analysis. In the present study, patients experiencing the first local recurrence could achieve long-term survival (5-year OS, 89%). Of 51 patients showing the first local recurrence, all patients received salvage treatment with surgery, radiotherapy, or combination therapy. Thus, the second local treatment for salvage aim achieved 5-year LC in 56% and rescued 55% of the patients to disease-free status at local sites during the follow-up period. Therefore, the survival effect on local recurrence was not significant, in contrast to regional and distant recurrences. These survival effects may be due to mitigation of the detrimental effects of local recurrence with aggressive salvage in this cohort. Analogous to PORT, the survival gain of GTR, which has been robust in previous studies [3,5,11,14,17,25,26], was also diminished in this cohort. These data suggest that aggressive local re-treatment may be recommended for salvage aim in locally recurrent SFT/HPC.
Even with a high success rate of local salvage, regional and distant recurrences occurred mostly in the delayed period after the 5-year disease-free status. Both GTR and PORT, showing efficacy in in-field control, failed to prevent out-field recurrences at the regional and distant sites in this study, consistent with previous studies [4,10,12]. Moreover, regional and distant recurrences were significantly related to poor survival, in contrast to local recurrences. Thus, long-term surveillance for out-field recurrences will be necessary, especially in patients with WHO grade III SFT/HPC. Furthermore, to improve the survival outcomes, a novel strategy to deal with systemic metastasis is required. Anti-angiogenic drugs have been tested in metastatic SFT/HPC, which expresses high levels of the vascular endothelial growth factor receptor (VEGFR) and platelet-derived growth factor receptor [24,27]. The combination treatment with temozolomide and bevacizumab showed partial response in 79% of patients (n=14) with metastatic SFT/HPC [27]. Recently, gene fusion of the NAB2 and STAT6 proteins was identified as a potent driver mutation in SFT/HPC [28,29]. The NAB2-STAT6 fusion induces a wide activation of the early growth response downstream targets, including NAB2, IGF2, and receptor tyrosine kinases, such as fibroblast growth factor receptor 1 (FGFR1) and NTRK1, which are also overexpressed in SFT/HPC [29]. Pazopanib, a broad-spectrum tyrosine kinase inhibitor against VEGFR1, VEGFR2, VEGFR3, PDGFR, KIT, and FGFR1, showed promising results, with 58% of patients showing partial response in the recurrent/metastatic solitary fibrous tumor in the phase 2 trial [24]. Thus, inhibition of the VEGF/VEGFR pathway may be a promising strategy for recurrent/metastatic SFT/HPC, and further prospective trials are warranted.
Nevertheless, despite metastatic recurrence, more than half of the patients achieved a 5-year survival duration in this study. Schiariti et al. [15] also reported a mean survival of 39 months after metastasis in a long-term observation. Regarding the long-term survival without optimal systemic treatment, long-term surveillance and palliation will be appropriate to deal with the metastatic potency of SFT/HPC [30].
This retrospective nature may affect the interpretation of results of our study. For instance, including both fractionated radiotherapy and radiosurgery, which was decided by clinicians’ preferences, may preclude drawing a robust conclusion. Repetitive local treatment for salvage in this cohort needs to be evaluated in terms of toxicities as well. Additionally, the RT plan might be heterogeneous and was individually designed in multiple centers. Therefore, an adequate margin for SFT/HPC could not be specified in the current study, and hence, should be assessed through a robust protocol in a prospective study.
In summary, we have demonstrated the disease control efficacy of PORT in SFT/HPC regardless of the extent of surgery and grade. These findings of this multicenter study, comprising a large number of patients compared to other retrospective studies, support the use of PORT in all SFT/HPC patients after surgery. For local control, PORT needs to enclose the residual tumor or surgical cavity with sufficient margin for the target volume.