Introduction
Capecitabine, a widely used chemotherapeutic agent, is approved for the treatment of various malignancies, especially for colorectal cancer (CRC) [1]. In recent years, maintenance treatment with capecitabine monotherapy or in combination with other chemotherapy has demonstrated favorable clinical benefit [2–4]. Although capecitabine is considered as a targeted intratumoral release of 5-fluorouracil which can reduce systemic toxicity in healthy tissues [5], the incidence of the cutaneous side effect, hand-foot syndrome (HFS), is exceptionally high (42% to 73.4%) in patients who treated with capecitabine-based chemotherapy [6,7]. The occurrence of HFS is a serious drawback that limits the long-term clinical use of capecitabine. HFS is characterized by erythema, edema, blisters, and peeling of the palms and soles. Most of the patients with moderate to severe (grade 2–3) HFS not only have skin damage but also suffer from pains that limit their daily activities, which leads to treatment interruptions and dosage reductions and consequentially hinders treatment compliance and adversely impacts survival outcomes. Additionally, it also reduces the quality of life of the patients and increases the risks of infections.
The main intracellular target enzyme for capecitabine is thymidylate synthase (TYMS) [8]. TYMS is an essential enzyme to provide the sole intracellular source of de novo dTMP and maintain the in vivo dTMP pool for DNA replication. Capecitabine, after in vivo metabolic conversion to 5-FdUMP, inhibits the TYMS catalytic activity of conversion dUMP to dTMP by competing with dUMP and forming stable ternary complexes with TYMS and 5,10-methyl-enetetrahydrofolate (5,10-CH2THF), leads to the imbalance of intracellular deoxynucleotide (dNTP) pools, resulting in the disruption of DNA replication and cell death [9]. TYMS affects the cytotoxicity of capecitabine not only in tumors but also in healthy tissues. So, TYMS is considered to be a key gene that could influence capecitabine-induced toxicity. Indeed, recent randomized clinical trial found that higher folate level, which enhanced TYMS inhibition, was associated with increased risk of capecitabine-induced HFS (CAP-HFS) in Asian populations [10]. These findings evince that TYMS may play a pivotal role in the development of CAP-HFS. TYMS has been investigated to assess its potential role as the biomarkers for CAP-HFS by previous pharmacogenetics studies. Of particular interests are TYMS 5′-untranslated region (UTR) tandem 28bp-repeat 2R or 3R (rs34743033) and 3′-UTR ins6 or del6 (rs11280056), two variants known to influence TYMS expression [11,12], while the associations between these variants and CAP-HFS have been inconsistent. A handful of studies have examined other single-nucleotide polymorphisms (SNPs) in TYMS as candidates [13–15] but few of which have been identified to be associated with HFS. And most of the previous studies were conducted in Caucasian populations. Up till now, there is only limited evidence about genetic predictors in TYMS of CAP-HFS, especially in East Asian population.
We therefore performed a retrospective case-control study and sequenced the entire gene regions of TYMS in 288 Chinese CRC patients with HFS extreme phenotype to identify susceptibility loci associated with CAP-HFS which may provide hints to clinical prediction and preventive of HFS, and further elucidate the underlying mechanism of HFS.
Materials and Methods
1. Patients
All patients for the study of HFS were enrolled at the Sun Yat-sen University Cancer Center (SYSUCC) from January 2003 to September 2017. The inclusion criteria are as follows: (1) pathologically confirmed diagnosis of CRC; (2) treated by capecitabine-based chemotherapy, (3) had complete medical records information, (4) aged ≥ 18 years old. Before receiving the capecitabine-based chemotherapy, patients who have hands and/or feet with pain, paresthesia, needles, impaired skin, or any other symptoms interfered with the diagnosis of HFS were excluded. Capecitabine was orally at 800 mg/m2 to 1,250 mg/m2 twice daily (rounded to the nearest dose comprising 150 mg and 500 mg tablets) for the first 2 weeks followed by a 1-week rest in a three-weekly cycle. Dose modifications of capecitabine was as follows. The dose of capecitabine reduced to 75% of the starting dose for any grade 3 adverse event. The chemotherapy was discontinued when any grade 4 or higher adverse event was observed.
2. Phenotype assessment
HFS were graded according to the National Cancer Institute’s (NCI’s) Common Terminology Criteria for Adverse Events v3.0. HFS extreme cases (Ex-cases) and extreme controls (Ex-controls) were selected using an extreme phenotype design to compare severe or early-onset HFS patients to those with no reported HFS. Ex-cases were defined as those having grade 3 HFS or having grade 2 HFS event during the first two treatment cycles (early-onset). According to these criteria 144 Ex-cases were enrolled. Ex-controls were defined as the patients who (1) had no HFS, (2) had completed at least six cycles of the capecitabine-based chemotherapy treatment, (3) received capecitabine-based chemotherapy without interruptions by other adverse events, (4) did not have dose change of capecitabine by other reasons during the treatment. Finally, 144 Ex-cases were enrolled, and 144 from the total 583 Ex-controls were randomly selected and matched to the Ex-cases by gender and the age at capecitabine-based chemotherapy (within 5 years).
3. Sequencing of TYMS
Genomic DNA was extracted from the peripheral blood mononuclear cells using a commercial DNA extraction kit (Qiagen, Valencia, CA) and quantified with PicoGreen reagent (Invitrogen, Carlsbad, CA).
Sanger sequencing of the coding regions (7 exons) of TYMS and the 5’- and 3’-UTR was performed in this study. We used primer3 v. 4.0 [16] to design polymerase chain reaction (PCR) primers for seven exons and 5’-, 3’-UTR of TYMS (7 amplicons). The sequences of PCR primers are shown in S1 Table. PCR was used to amplify the fragments. The genotypes were confirmed using Sanger sequencing. DNAStar software were used to manually examined for variants. The reference of TYMS sequence was obtained from the GenBank database (NG_028255.1).
4. Statistical analyses
The demographics and clinical characteristics were collected and statistical analyses were performed in R 3.2.0 (R Foundation for Statistical Computing, Vienna, Austria). Wilcoxon-Mann-Whitney test and logistic regression model were used in statistical analysis. Variables that reached statistical significance (p < 0.05) by univariate analysis were included for backward stepwise multivariate logistic regression. Those with p < 0.05 were adjusted as covariates. Associations between genotypes and HFS risk were performed by PLINK v1.9 [17] using logistic regression under an additive model adjusted for independently associated covariates (capecitabine-based chemotherapy regimen, primary tumor surgery, and previous fluorouracil-based chemotherapy). Odds ratios (ORs) and 95% confidence intervals (CIs) of the variants were estimated using PLINK v1.9. Haploview v. 4.1 [18] was used to calculate the linkage disequilibrium (LD) between the variants. Multivariable logistic regression was used to predict a risk model for CAP-HFS including the variants in TYMS that were significantly associated with CAP-HFS. According to predicted values of the risk model, patients were classified by quintiles. Logistic regression was used to estimate the ORs with the first quintile risk score group as reference. p < 0.05 was considered significant and all statistical tests were two-sided.
5. In silico analysis
Genotype-Tissue Expression project (GTEx) database release V8 (http://www.broadinstitute.org/gtex/), RegulomeDB v1.1 [19] and HaploReg v4.1 [20] were used to characterize the potential functions of the SNPs.
6. Data availability
The sequencing data of the coding regions (7 exons) of TYMS of the patients in this study can be accessed at National Genomics Data Center database (accession number: HRA-000140; https://bigd.big.ac.cn/gsa-human/s/KFyTE-MhE). The raw data of this article have been uploaded to the Research Data Deposit (RDD) with an RDD number of RDDA2020001731.
Results
1. Demographics and clinical characteristics
A total of 288 CRC patients are included in the study, consisting of 144 HFS Ex-cases and 144 HFS Ex-controls. Their clinical characteristics are shown in Table 1. The median age at capecitabine-based chemotherapy was 59 years (range, 27 to 83 years), and 108 patients (37.5%) were female. The HFS Ex-cases included 73 (50.7%) patients with grade 3 HFS and 71 (49.3%) early-onset (first 2 cycles) patients with grade 2 HFS. The average cycles of capecitabine-based chemotherapy to the HFS Ex-controls was 7.1. Median starting dose of capecitabine in Ex-cases and Ex-controls was 978.3 mg/m2 twice daily and 949.4 mg/m2 twice daily, separately. The variable of chemotherapy regimens was dichotomized to capecitabine monotherapy and capecitabine plus oxaliplatin (XELOX). In total, 26.0% (n=75) of the patients were treated with capecitabine monotherapy and 74.0% (n=213) of the patients received XELOX chemotherapy regimen. In this case-control study, we found that CRC patients treated with XELOX or had received primary tumor surgery before capecitabine-based treatment showed a lower risk to develop HFS (OR, 0.12; 95% CI, 0.06 to 0.22; p < 0.001 and OR, 0.20; 95% CI, 0.07 to 0.50; p=0.002). Additionally, patients who had previously received fluorouracil-based chemotherapy treatment were more likely to develop HFS (OR, 2.68; 95% CI, 1.45 to 5.12; p=0.002). Multivariate logistic regression showed that XELOX regimen, previously received fluorouracil-based chemotherapy treatment and received primary tumor surgery before capecitabine-based treatment were independent influencing factors for HFS. So in the subsequent genetic association analysis, they were adjusted for as covariates. To further explore the potential non-genetic factors, cigarette smoking, regular alcohol drinking and chronic diseases such as cardiovascular disease and diabetes were also concluded, none of them showed an association with CAP-HFS (S2 Table).
2. Associations of new variants in TYMS with CAP-HFS
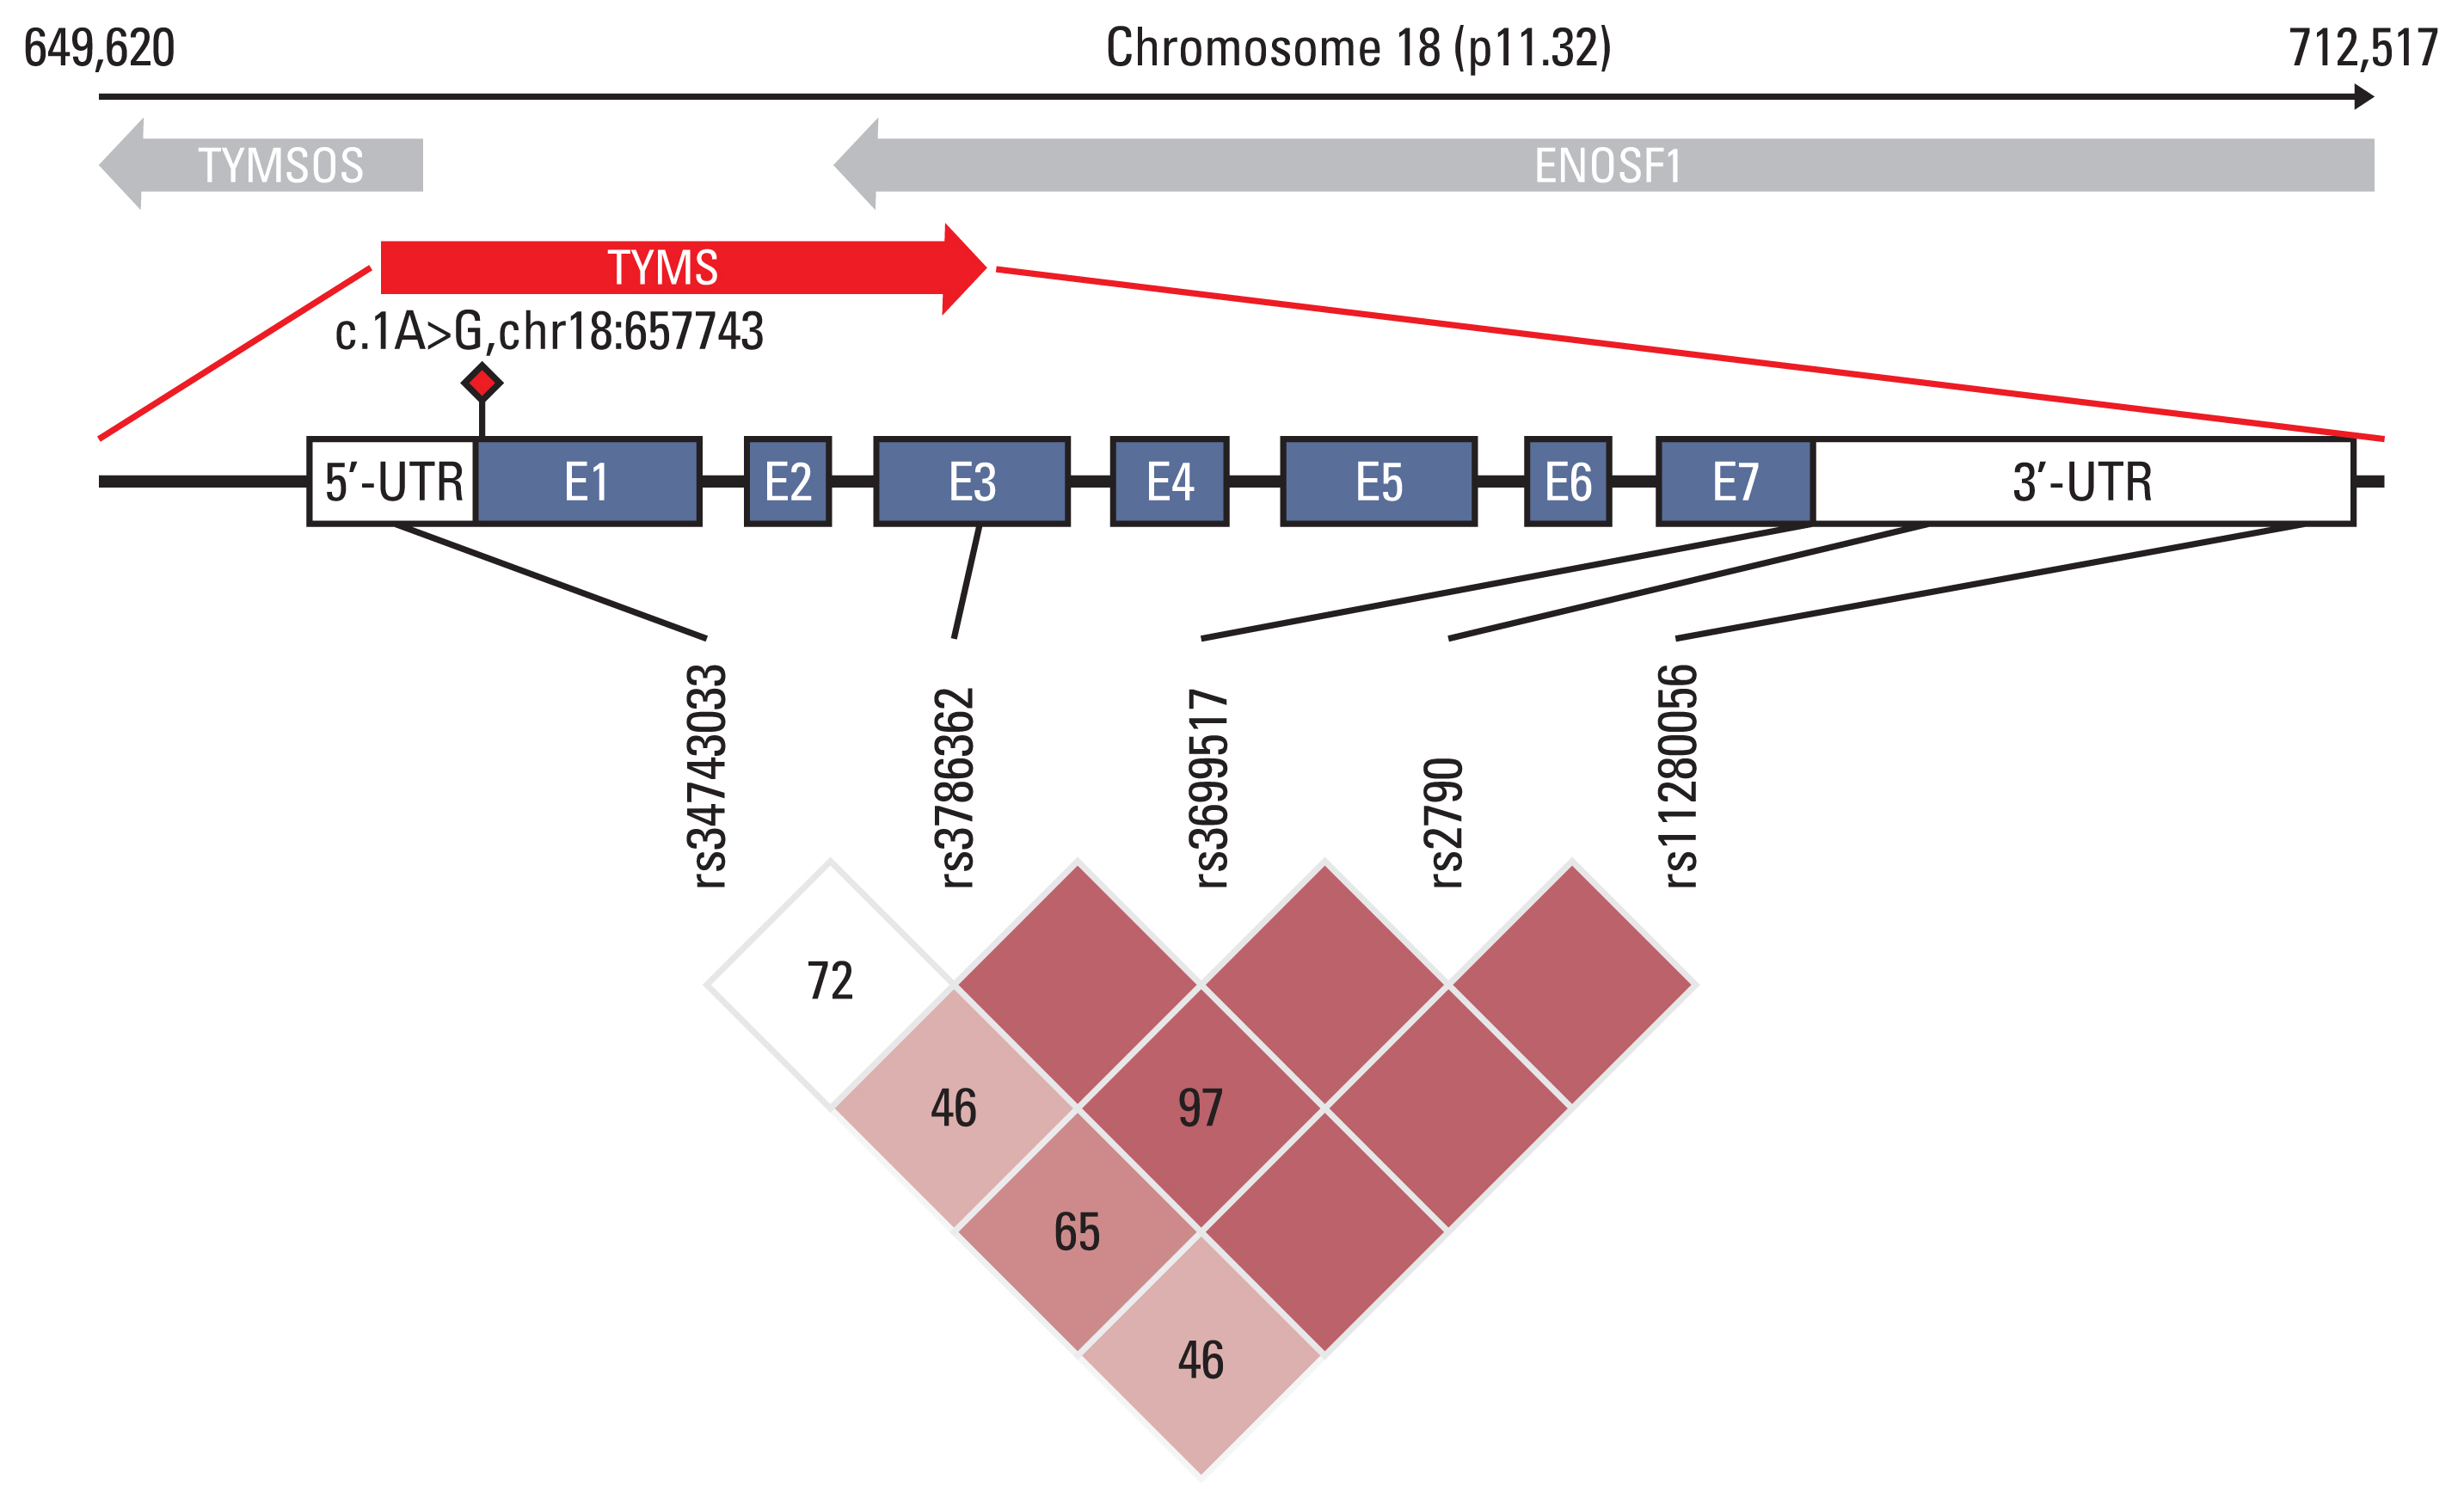
Genetic variants identified by sequencing the coding regions of TYMS in 144 Ex-cases and 144 Ex-controls were tested for the association with severe or early-onset HFS. A novel mutation (c.1A>G, chr18:657743) at the start codon in exon1 of TYMS was detected in an Ex-case who experienced grade 3 HFS during the first cycle of treatment (S3 Fig). The only carrier of this mutation was a 68-year-old male, who was diagnosed with rectal adenocarcinoma moderately differentiated. The disease stage reported was T3N2M0; World Health Organization (WHO) stage III. The patient received capecitabine monotherapy as adjuvant chemotherapy with a body surface area of 1.76 m2, the dosage was 2,000 mg (about 1,136 mg/m2) twice a day. He had to receive interruption of chemotherapy because of developing grade 3 HFS until resolved to grade 1 or below, and then received a 25% dosage reduction of capecitabine to continue the chemotherapy.
By association analysis, we found five variants that were significantly associated with HFS (Table 2). rs3786362, a synonymous variant with Regulome DB score 2b in the third exon region of TYMS, was associated with HFS (OR, 0.38; 95% CI, 0.21 to 0.70; p=1.89×10⁻³). We also found that carriers with G allele of rs2790 had lower risk of developing grade 2–3 HFS (OR, 0.58; 95% CI, 0.39 to 0.87; p=8.80×10⁻³). In addition, the 28 bp repeat polymorphisms rs34743033 (OR, 1.91; 95% CI, 1.16 to 3.16; p=1.12×10⁻²) in the 5’-UTR region and the 6bp ins-del polymorphisms rs11280056 (OR, 2.12; 95% CI, 1.39 to 3.24; p=4.62×10⁻⁴) in the 3’-UTR of the TYMS were detected. rs699517 with Regulome DB score 1f is in complete LD with rs11280056 (r2=1) and has a similar result. Except for this pair of variants, the rest showed moderate LD (Fig. 1). We further found that the associations between rs699517, rs2790, and rs11280056 (3’-UTR 6-bp ins-del) with CAP-HFS were slightly stronger in the subgroup with grade 3 HFS Ex-cases (n=73) and all Ex-controls (S4 Table). The frequency distribution of carrying a number of these significant variants identified by association analysis are shown in S5 Fig.
3. The prediction model of CAP-HFS
According to the risk model predicted values, patients were classified into five risk groups by quintiles. It showed a linear trend in the odds of CAP-HFS risk groups across the quintiles (S6 Fig.). S7 Table showed the ORs for the risk prediction groups, comparing the risk predicted score of patients in the high quintiles (2nd to 5th) with that of patients in the lowest quintile (1st). The OR of the risk prediction groups of CAP-HFS increased with the predicted risk score increasing, ranging from an OR of 1.39 (95% CI, 0.66 to 3.00) at the second quintile to an OR of 5.01 (95% CI, 2.06 to 12.86) at the fifth quintile, compared with the reference group at the first quintile.
4. In silico analysis
Expression quantitative trait locus (eQTL) analysis of the identified SNPs was derived from the GTEx database (S8 Fig.). GTEx data show that the CC genotype of rs699517 exhibited a trend of a lower TYMS mRNA expression in sun-exposed skin tissue samples. And in both sun-exposed and not sun-exposed skin tissues, rs699517 C allele significantly increased expression of ENOSF1, a neighboring gene of TYMS (p=2.3×10⁻⁹ and p=9.9×10⁻¹⁰, respectively). rs2790 G allele exhibited significantly increased TYMS expression in sun-exposed skin tissue (p=3.6×10⁻⁹) and decreased ENOSF1 expression in both sun-exposed and not sun-exposed skin tissues (p=1.5×10⁻⁹ and p=3.7×10⁻¹⁵, respectively). We further found that with the increasing number of the 6bp insertion allele at rs11280056, ENOSF1 exhibited a lower mRNA expression level in sun-exposed and not sun-exposed skin tissues (p=1.5×10⁻⁹ and p=2.3×10⁻⁹, respectively) while TYMS exhibited no significant change in expression level. No data from GTEx could be retrieved for rs34743033 and rs3786362. By HaploReg database, the results showed that the alleles changes of rs3786362, rs699517, and rs11280056 may induce regulatory motifs altered, and then influence the transcription and expression of genes.
Discussion
To further explore the novel functional variants associated with CAP-HFS in TYMS, we sequenced the entire TYMS exons and 5’-, 3’-UTR in 288 capecitabine-treated CRC patients with extreme phenotype of HFS in our study. We detected a novel risk mutation (c.1A>G, chr18:657743), and five common variants, namely rs34743033 (5’VNTR 2R/3R), rs3786362, rs699517, rs2790 and rs11280056 (3’-UTR 6-bp ins-del) which were significantly associated with CAP-HFS (p < 0.05).
On the basis of sequencing result, we identified a novel high-risk mutation (c.1A>G, chr18:657743) located in the initiator codon of the first exon, leading to the primary start codon ATG for methionine to be replaced by GTG for valine (p.Met1Val). This mutation has not been reported in public database or scientific literatures. And we performed a further detection of it in an additional 800 CRC patients, while no carriers had been found (data not shown), which indicated that this novel mutation was a rare mutation. This start codon mutation may cause truncating mutation which can seriously influence the gene transcription and expression. Interestingly, this mutation carrier didn’t carry any other common variants we detected significantly associated with CAP-HFS in this study, which suggested that this mutation in TYMS might be an independent and powerful driver of CAP-HFS development. We observed that the patient who carried this mutation developed severe HFS within the first cycle of chemotherapy, indicating that carriers with this mutation cannot tolerate the capecitabine-based treatment long enough to get benefit from it and that preventive capecitabine reduction might be necessary for them.
The variants, 28-bp repeat polymorphisms rs34743033 (2R/3R) in the 5’VNTR and rs11280056 (6-bp ins-del) in the 3’-UTR of TYMS have been reported to be associated with global capecitabine toxicity in previous studies [21]. However, there are limited studies on the associations between these two variants and CAP-HFS [13,22–24]. Only a study including 239 capecitabine-based chemotherapy CRC patients reported that rs34743033 was significantly associated with increasing risk of HFS [22]. While no studies showed a positive result of the association between rs11280056 and CAP-HFS. Recently, an IPD meta-analysis combined four studies in Caucasian population reported that rs34743033 and rs11280056 were exclusively associated with severe HFS [25], which is consistent with respect to our results in Chinese population.
We also found three novel variants rs3786362, rs699517, and rs2790 significantly associated with CAP-HFS. The associations between rs3786362, rs699517, and rs2790 with CAP-HFS were slightly stronger in the subgroup with grade 3 HFS Ex-cases (n=73) and all Ex-controls, which may indicate that they have particular contributions to the severe HFS development. rs3786362 was a synonymous variant in the third exon region of TYMS, were reported associated with the efficacy of MTX by a genome-wide association study [26], while the association with capectabine-induced toxicity had not been reported. rs699517 and rs2790 were located in the 3’-UTR of TYMS. rs699517 was previously reported associated with capectabine-induced severe nausea/vomiting and anorexia in European population [27]. eQTL analysis in skin tissues showed that rs699517 C allele significantly increased expression of ENOSF1, a gene encoding RNAs antisense to TYMS, and a trend of a lower TYMS mRNA expression. Regulome DB score of rs699517 was 1f, indicating its potential regulatory function of TYMS/ENOSF1 through affecting transcription factor binding. rs2790 had never been analyzed for the association with capectabine-induced toxicity in previous studies. In our study, we first identified its significant association with the development of CAP-HFS. The A allele of rs2790 exhibited significantly decreased TYMS expression and increased ENOSF1 expression in skin tissues. These results may support a hypothetical model in skin tissues, in which the CAP-HFS risk alleles of rs699517 and rs2790 may associate with the decreased expression of TYMS and inhibit the TYMS catalytic activity through both direct action of TYMS and indirect action of ENOSF1. To be more specific about the indirect action, ENOSF1 (TYMSAS) was originally considered as the source of natural antisense RNAs of TYMS [28] and the increased expression of antisense RNAs to TYMS gene may downregulate TYMS expression [29], eventually lead to increase the toxicity of capecitabine. These above results suggested that the effect of these variants on the development of CAP-HFS were not solely restricted to TYMS but related to a combination of gene interactions, the underlying mechanisms of which should also be further investigated.
In total, five variants significantly associated with CAP-HFS in TYMS were detected in this study. Most of them were located in the regulatory regions (Fig. 1) which indicated that genetic polymorphisms associated with susceptibility to CAP-HFS in individuals may affect CAP-HFS development through the direct and indirect action of regulating the expression of TYMS. We also found that cases tended to carry more risk variants. And then, a risk predictive model of CAP-HFS including all identified variants in TYMS associated with CAP-HFS identified by association analysis were elementarily created in patients with extreme phenotype of HFS. It showed that the risk of CAP-HFS increased with higher risk score. In the analysis by quintiles, CAP-HFS risk was the lowest among individuals in the bottom quintile risk score (as reference) and highest among those in the top (OR, 5.01; 95% CI, 2.06 to 12.86).
All the above results indicated that these TYMS variants may be served as the genetic predictors of CAP-HFS and provide evidence for individualized treatment in clinical. Moreover, the functional annotations of the variants significantly associated with CAP-HFS in the TYMS region suggest that these variants might not only regulate TYMS but also ENOSF1 expression in skin tissues, which may hint a clue to further explain the development of CAP-HFS.
Different demographics and clinical characteristics were also concluded to find non-genetic factors associated with CAP-HFS. Previous studies showed a lower HFS incidence in the combination treatment [30], but the differences in dose of capecitabine may have also contributed to their finding. In our study, we found that significantly fewer patients who received XELOX regimen developed HFS. CAP-HFS is a dose-limiting toxicity, different doses and therapeutic strategies in combination treatment may affect the development of HFS, which make the analysis of CAP-HFS risk factors complicated. As we only included patients who had consistent dosage of the capecitabine during the treatment, the starting capecitabine dose was used as an adjustment factor. Multivariate logistic regression showed that XELOX regimen were independent protective factors for CAP-HFS. To further identify the associations between different therapeutic strategies and CAP-HFS development, prospective randomized dose-controlled trials are needed.
In the design of the present study, compared with previous studies, we used a strict filtering criteria in controls. We excluded patients who received less than four cycles of the capecitabine-based chemotherapy or had chemotherapy interruptions or capecitabine dose reductions due to other adverse events during the treatment. This filtering criterion is beneficial to minimize the risk of potential cases mixed and enhance the ability to detect significant genetic signals associated with CAP-HFS.
Our study identified new variants in the TYMS gene as susceptibility predictors of CAP-HFS in CRC patients. Further studies are desirable to confirm the findings and to illuminate the mechanistic of CAP-HFS.