Introduction
Both cardiovascular disease (CVD) and breast cancer are arguably the major threats to women’s health in Korea [1] as well as worldwide [2]. Sharing predisposing risk factors of age, diet, obesity, and sedentary lifestyle, they frequently intersect to influence the outcomes of affected individuals [3]. One of the evolving intersections between CVD and breast cancer addresses the impact of medications commonly used for CVD and its risk factors on cancer outcomes.
With a growing body of biological evidence for a potential role of insulin, metformin, and statin in the progression of breast cancer, several epidemiological studies have provided support for the effect of these drugs on breast cancer outcomes [4,5]. For instance, exogenous insulin use was associated with a worse survival, whereas use of metformin, a biguanide used as a first-line treatment for type II diabetes mellitus (DM), was associated with a better survival in patients with breast cancer and DM [4,6]. Use of statin, the most widely used cholesterol-lowering drug class for prevention of CVD, has also been correlated with decreased recurrence and mortality from breast cancer [5,7]. Interestingly enough, some of those studies reported association of metformin or statin use with improved clinical outcome in a certain subtype of breast cancer, such as human epidermal growth factor receptor 2 (HER2)–positive or estrogen receptor (ER)–positive tumors [7,8].
However, results from previous clinical studies have been inconsistent, and interpretation of these studies is often limited by their small sample sizes and the heterogeneity of the included patients [4,9,10]. In addition, some of them failed to adjust for stages and disease subtypes which are known to be highly relevant to the prognosis of patients with breast cancer. Furthermore, the majority of prior studies on this topic were from Western countries with only a few from Asia, and the findings from Western populations may not directly apply to Asian patients [11].
This study explored the association of insulin, metformin, and statin use with survival and whether the association is modified by the hormone receptor–positive status of the tumor in Korean breast cancer patients diagnosed and treated at a single institution. To capture exposures to each drug comprehensively, the institutional database was linked to the nationwide claims database, which covers nearly all prescription records in Korea.
Materials and Methods
1. Data sources
We obtained the required information for this retrospective cohort study from a large hospital-based database and the nationwide claims database of the Korean Health Insurance Review and Assessment Service (HIRA). In Korea, National Health Insurance is a government-controlled, public medical insurance program that provides coverage to about 97% of its people, with the remaining 3%, mostly those in the low-income bracket, covered by Medical Aid [12]. Hospitals and clinics submit claims to the HIRA for review to be reimbursed for costs of medical services provided within this system. These claims data include the relevant diagnostic codes from the Korean Classification of Disease (KCD), patient demographics, medical procedures used, and prescription records, with the KCD largely based on the 10th revision of the International Classification of Diseases (ICD-10). Although nearly all information on the use of medical services in Korea is indicated this way, they often lack details on the survival of the patients and the clinicopathological features of the tumor [13]. Data on tumor characteristics were thus separately reviewed from the institutional database of Seoul National University Hospital (SNUH) and linked with the information on the diagnosis and treatment of breast cancer as well as the prescription of drugs from the HIRA database using the social security numbers of the affected individuals. Information on death status and the date of death of the patients were retrieved from the national death statics which are collected once the death of a Korean citizen is registered within one month.
2. Patient selection
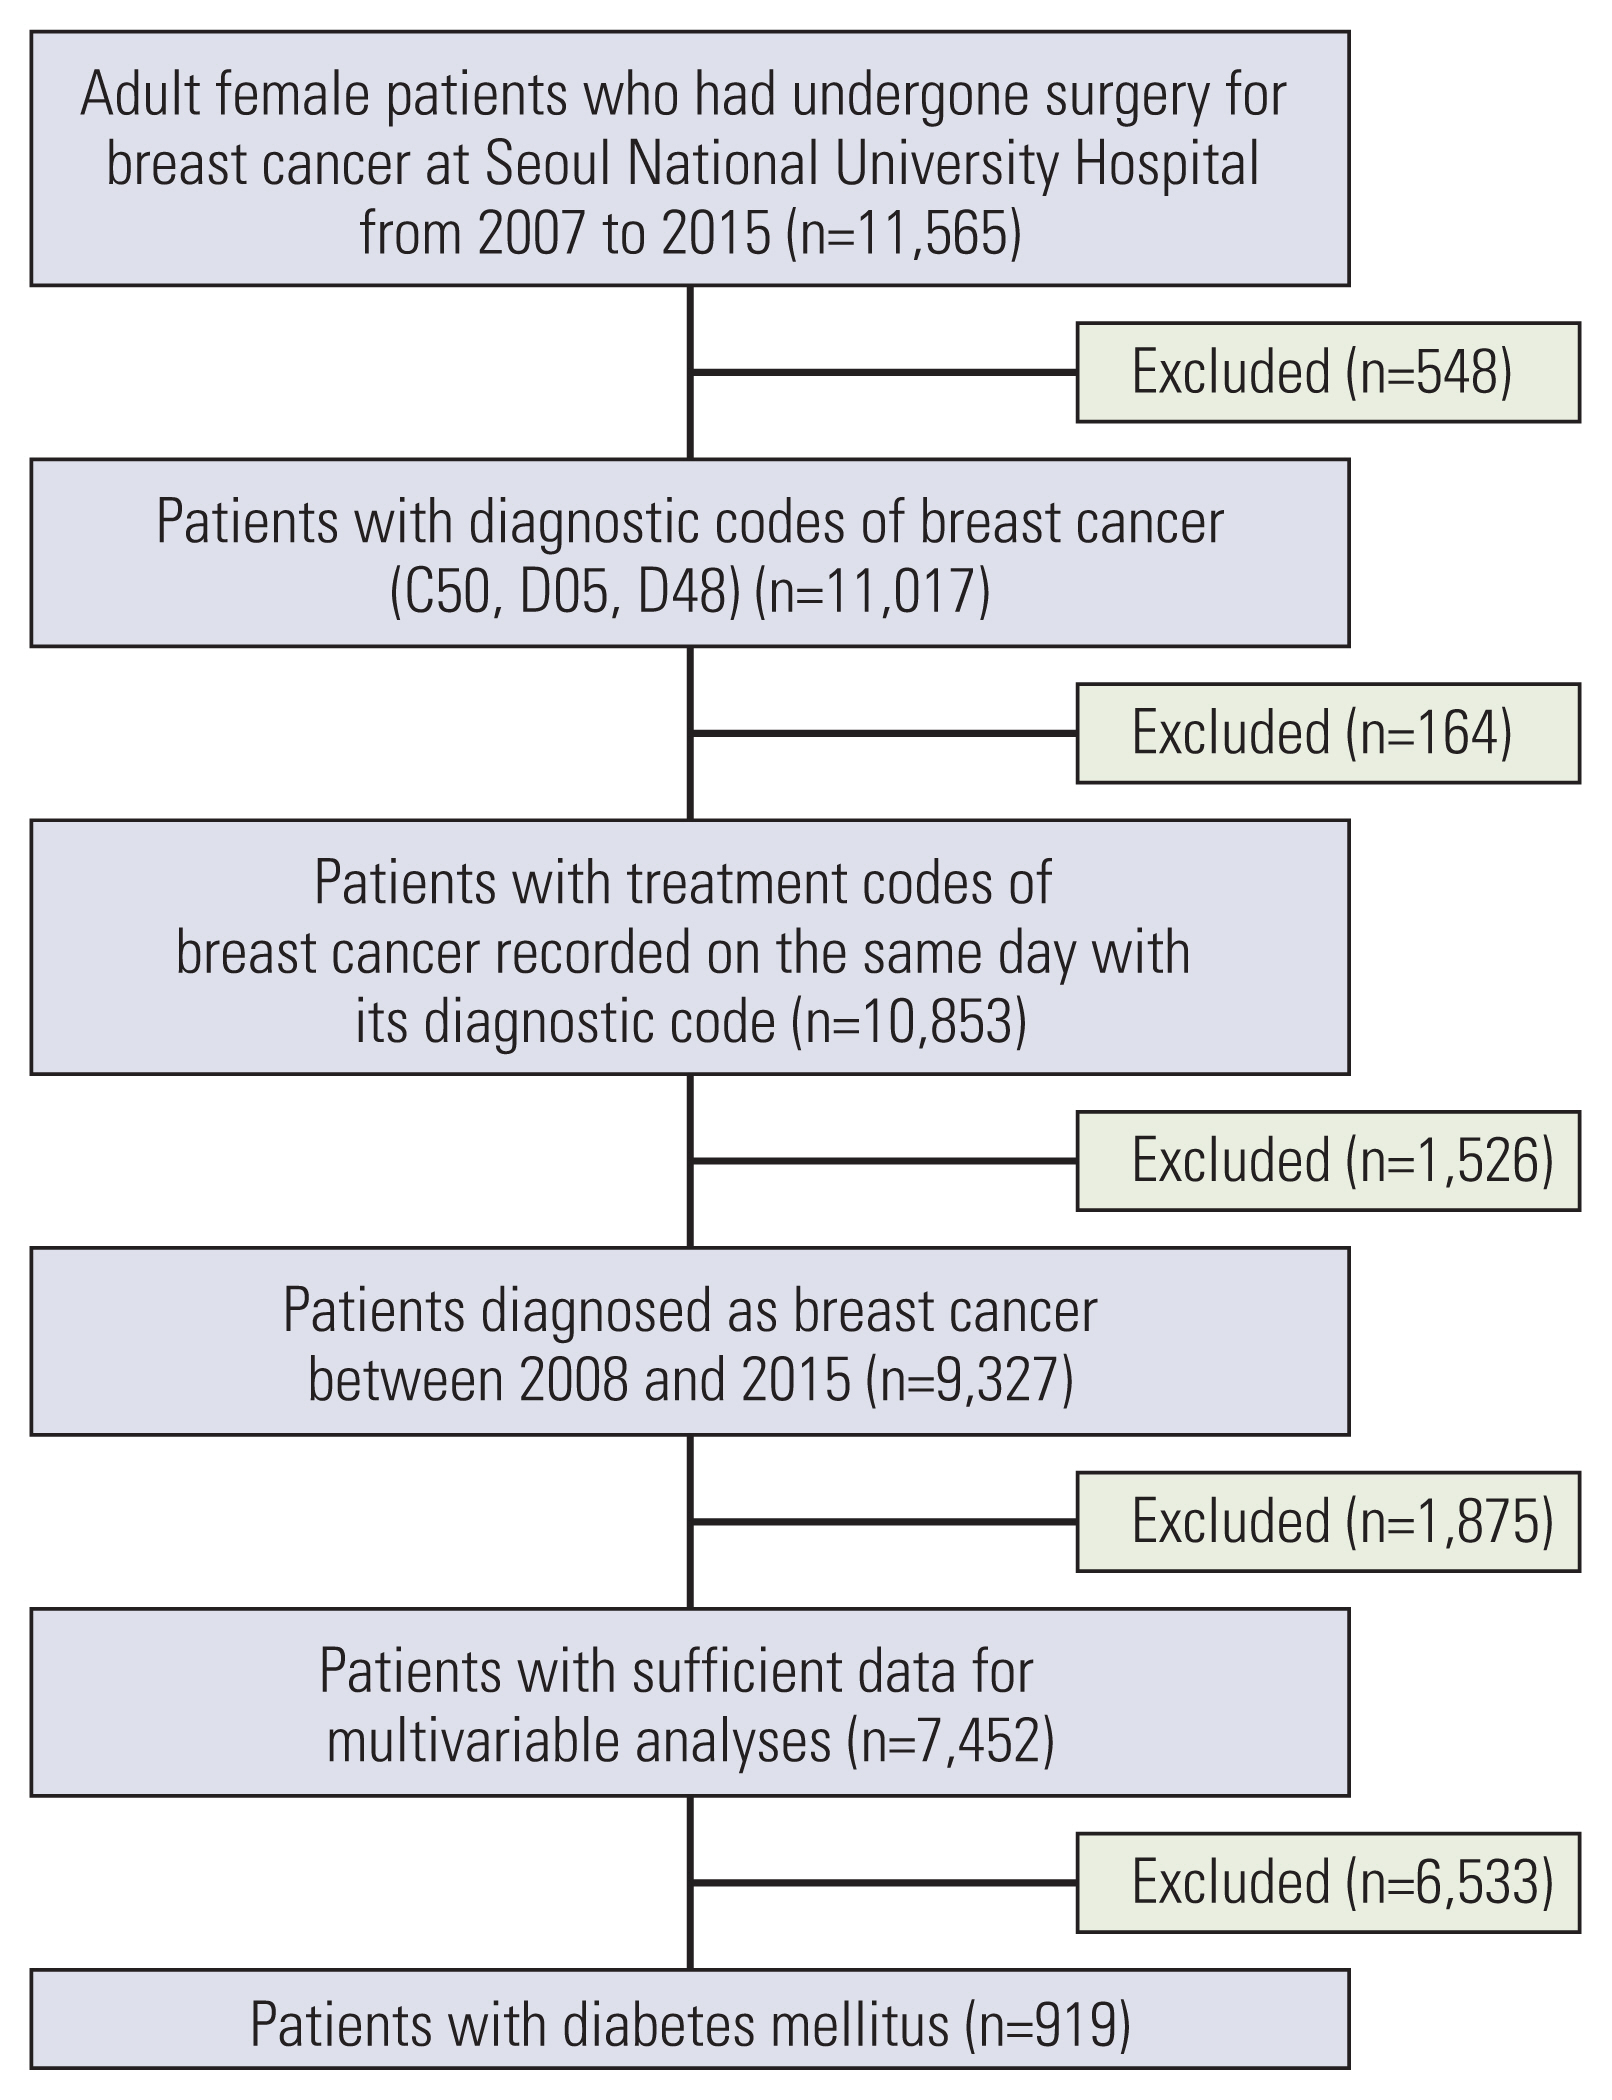
Among a cohort of 11,565 adult female patients who had undergone surgery for breast cancer at SNUH from 2007 to 2015, 10,853 patients were identified with both the diagnostic and treatment codes of breast cancer recorded on the same day from the HIRA data. We excluded 1,526 patients who were diagnosed with breast cancer before January 1, 2008 to examine the medical history of the study population for a minimum of one year before the diagnosis date. This process helped to include newly-diagnosed cases as the intended study population and to gather information on their exposure status. Among the 9,327 remaining cases, 7,452 patients had data sufficient for the present analyses and were deemed eligible for analysis of statin exposure. Analyses of insulin and metformin use were limited to 919 of them who had been diagnosed with DM (Fig. 1).
Analyses were done for overall population, for subgroups after stratifying patients according to the hormone receptor–positive status of the tumor, and for patients with a known HER2 status. Hormone receptor status was regarded positive when the tumor was recorded to be positive for ER expression.
3. Exposures and potential confounders
Exposure before breast cancer was defined as a recorded prescription of each drug within 12 months before the diagnosis of breast cancer. Metformin and statin were incorporated in our analyses regardless of whether they were the sole ingredient or one of the ingredients of relevant drugs. Diagnosis date was designated as the date of the earliest treatment for breast cancer, namely the first date of chemotherapy for patients who had received chemotherapy before surgery or the date of surgery for the remaining cases.
The collected variables included the following: sex, date of diagnosis, age at diagnosis, comorbidities, histologic type, presence or absence of tumor tissue expression of ER, progesterone receptor (PR), and HER2, and the extent of cancer spread at diagnosis classified by stages as tumor (T), lymph node (N), and metastasis (M). Comorbidities were graded using the Charlson comorbidity index (CCI) as proposed previously [14,15]. Histologic types were classified as invasive ductal carcinoma (IDC), invasive lobular carcinoma (ILC), and others, which included papillary carcinoma, mucinous carcinoma, Paget’s disease, tubular carcinoma, medullary carcinoma, and mixed histology with a presumed primary site of the breast. Disease stage was coded according to the American Joint Committee on Cancer staging, 6th edition for cases diagnosed from 2007 to 2009 and 7th edition for patients diagnosed between 2010 and 2015, respectively [16,17].
4. Statistical analysis
The baseline characteristics of the patients were compared between patients with different exposure statuses before breast cancer using chi-square or Fisher exact test for percentages from categorical variables and Kruskal-Wallis or Wilcoxon rank-sum test for distributions of continuous variables. The primary outcome was overall survival, which was defined as the time from the diagnosis date of breast cancer to the date of death of any cause or last follow-up. The cutoff point for exposure was June 30, 2017 and January 5, 2018 for death events. Unadjusted survival curves were plotted using the Kaplan-Meier method and compared between groups with different exposure statuses before breast cancer using log-rank tests. Cox proportional hazards models were applied to examine the impact of exposure of each drug before breast cancer on overall survival after adjusting for potential confounders. All p-values were two-sided, and values of < 0.05 were considered statistically significant. SAS Enterprise Guide 6.1 (SAS Institute Inc., Cary, NC) and R ver. 3.4.1 (R Foundation for Statistical Computing, Vienna, Austria) were used for all analyses.
Results
1. Baseline characteristics of the patients
Among the 919 patients with DM, 538 patients received neither insulin nor metformin; 27 patients received insulin, 255 patients received metformin, and 99 patients received both insulin and metformin before the diagnosis of breast cancer. Patients with previous exposure to insulin were significantly more likely to be older than 50 years and have a higher CCI than those without it at diagnosis of breast cancer (p < 0.001 for both) (Table 1).
Of 7,452 patients, 953 patients had an exposure to statin before the diagnosis of breast cancer and 6,499 did not. Patients with prior statin exposure were more likely to be older than 50 years and have a higher CCI than those without it at diagnosis of breast cancer (p < 0.001 for both). Although other clinical variables were generally comparable between the two groups, PR negativity was slightly more frequent with statin exposure than without it (48.48% vs. 42.18%; p < 0.001) (Table 2).
2. Survival curves
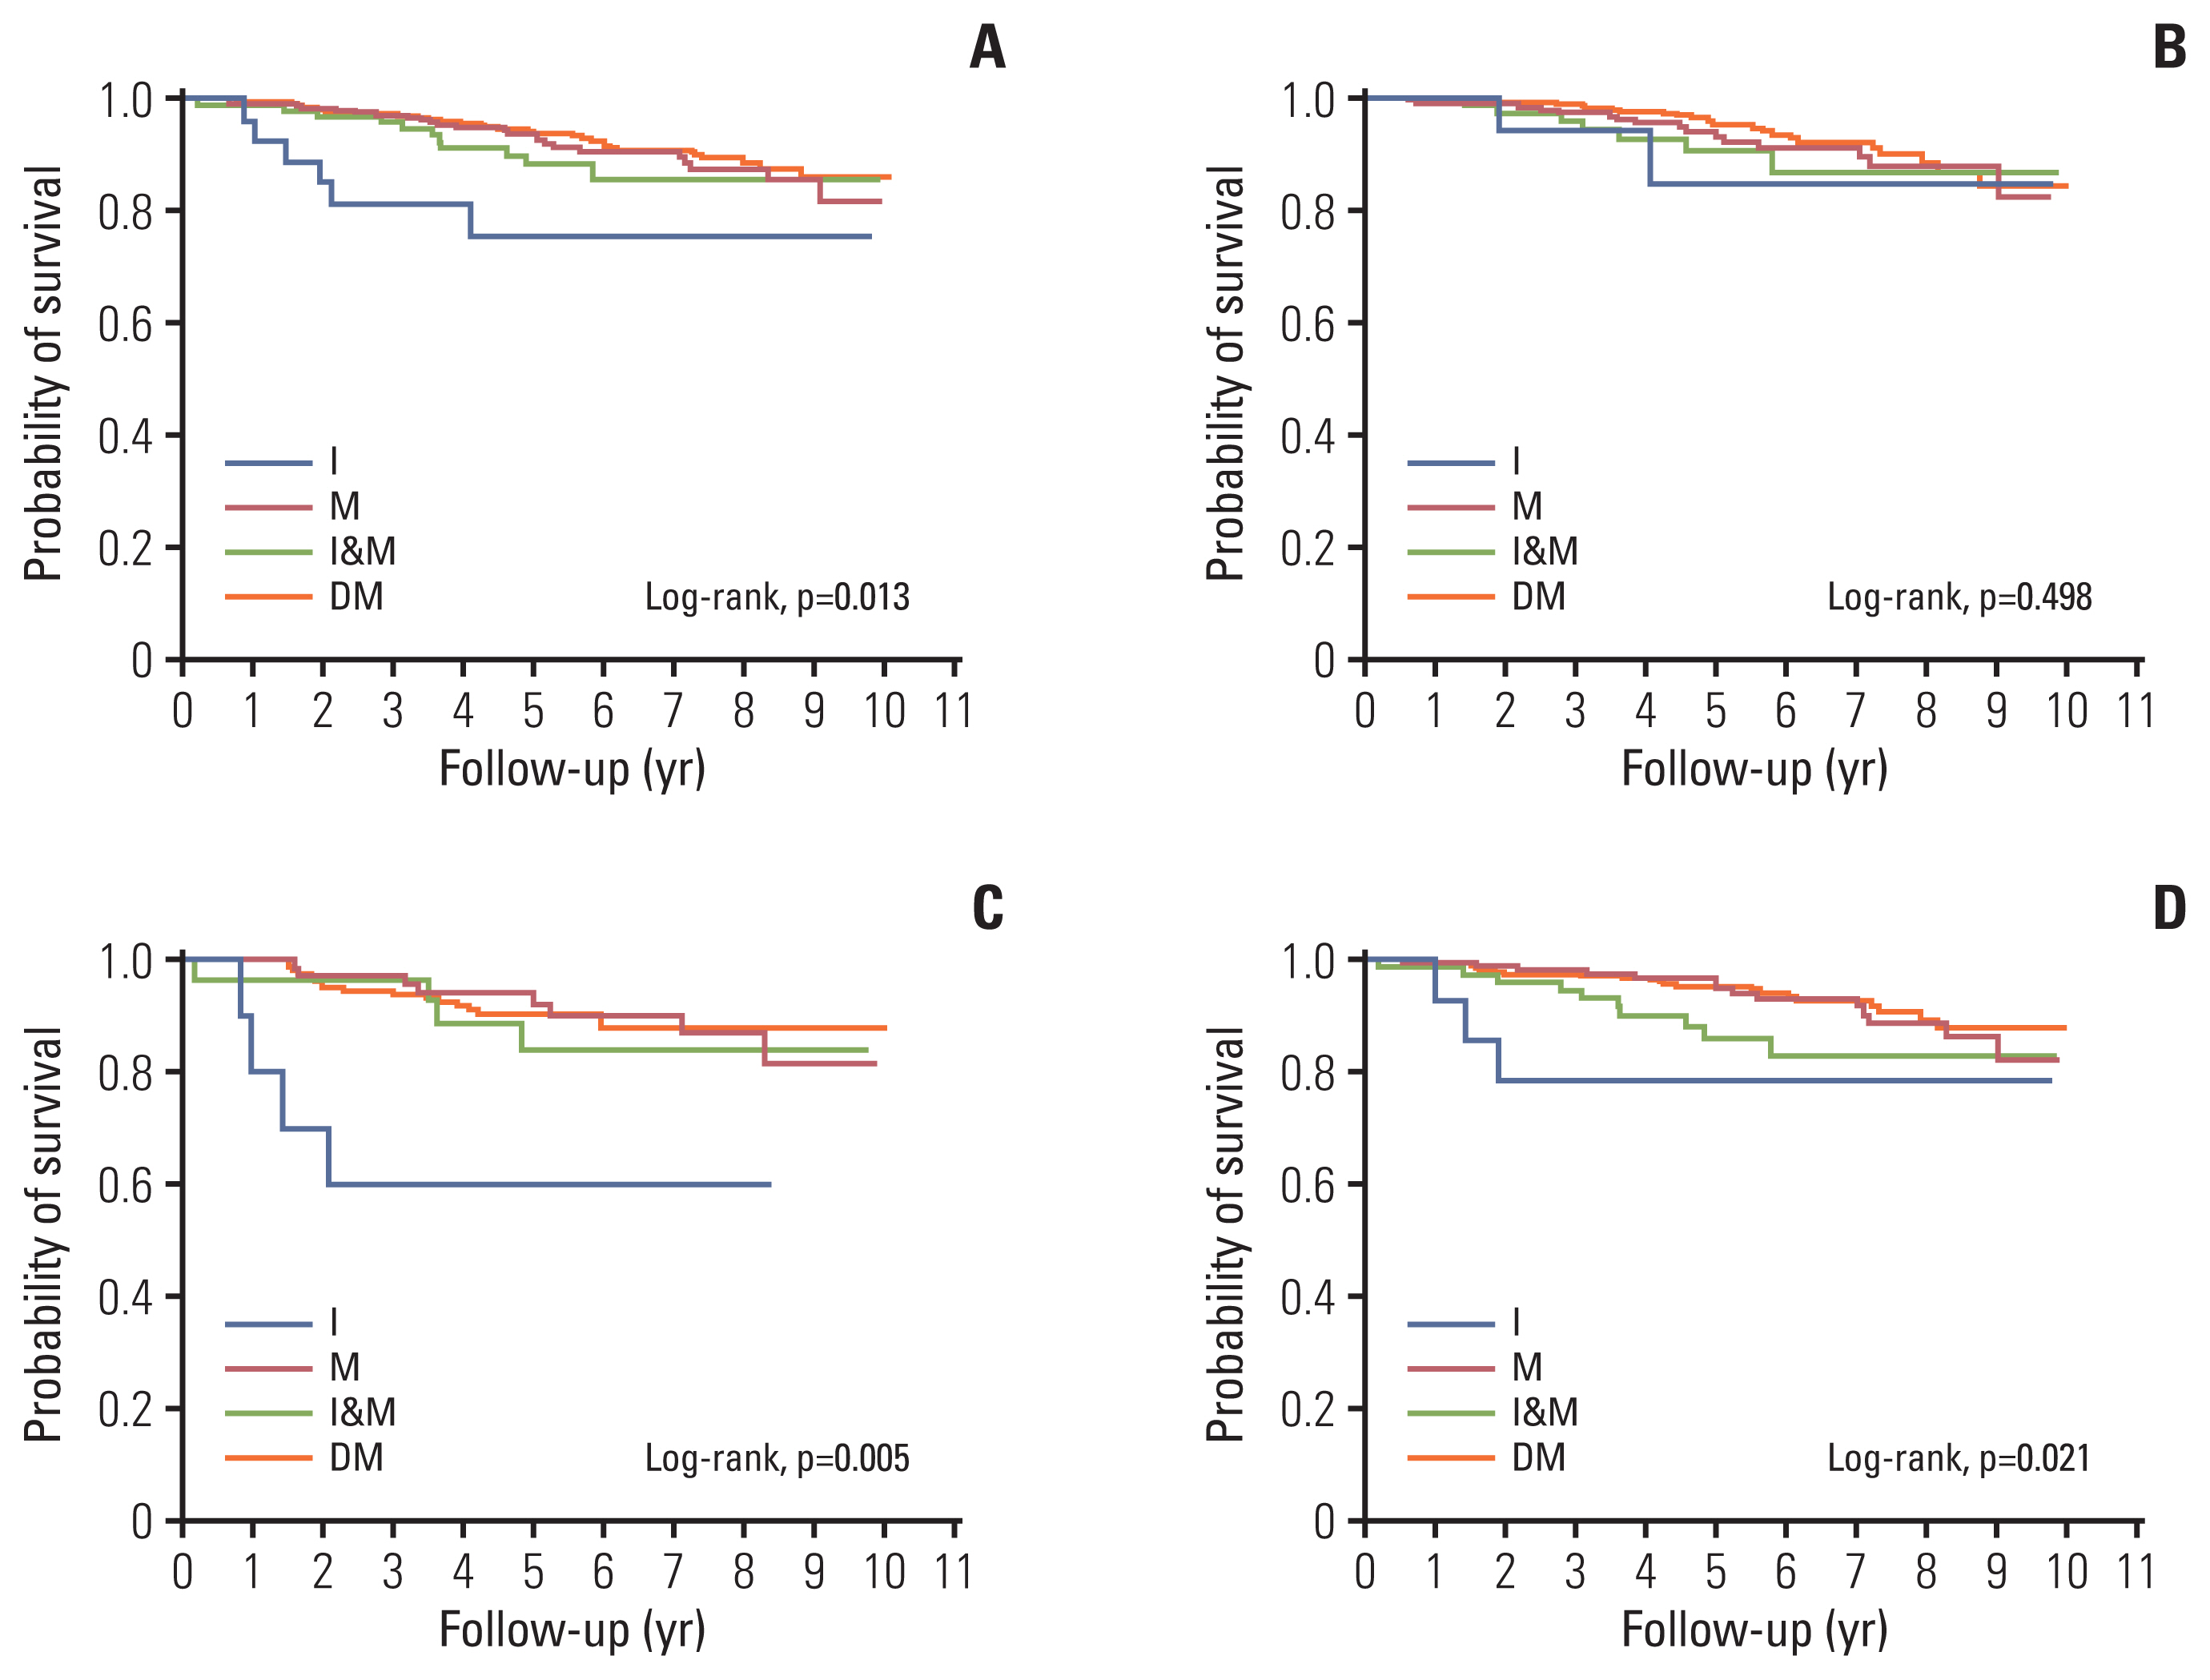
Fig. 2 shows the unadjusted survival curves of the patients with and without exposure to insulin and metformin before the diagnosis of breast cancer. In the diabetic population, survival was significantly shorter in the group with insulin use, followed by those with insulin and metformin use than the group with metformin use and those without insulin or metformin use with 5-year survival rates of 75.66% (95% confidence interval [CI], 52.79 to 88.54) and 88.44% (95% CI, 79.37 to 93.67) vs. 93.95% (95% CI, 89.95 to 96.39) and 93.91% (95% CI, 91.27 to 95.77), respectively (p=0.013) (Fig. 2A). These intergroup differences in survival were less apparent in the patients with ER-positive breast cancer, but prominent in the patients with ER-negative breast cancer. The 5-year survival rates were 84.71% (95% CI, 49.77 to 96.13) and 90.54% (95% CI, 79.90 to 95.70) vs. 93.89 % (95% CI, 88.86 to 96.69) and 95.35% (95% CI, 92.08 to 97.29) in the former (p=0.498) (Fig. 2B), whereas those in the latter were 60.00% (95% CI, 25.27 to 82.72) and 84.05% (95% CI, 62.61 to 93.75) vs. 94.12% (95% CI, 85.06 to 97.76) and 90.39% (95% CI, 84.55 to 94.10) (p=0.005) (Fig. 2C) for the insulin group, insulin and metformin group vs. metformin group, and without insulin or metformin group, respectively. The survival curve of the HER-2 available patients showed a similar pattern with that of the overall diabetic population with 5-year survival rates of 78.57% (95% CI, 47.25 to 92.54) and 86.06% (95% CI, 74.64 to 92.59) vs. 96.86% (95% CI, 92.58 to 98.68) and 95.35% (95% CI, 92.39 to 97.18), respectively (p=0.021) (Fig. 2D).
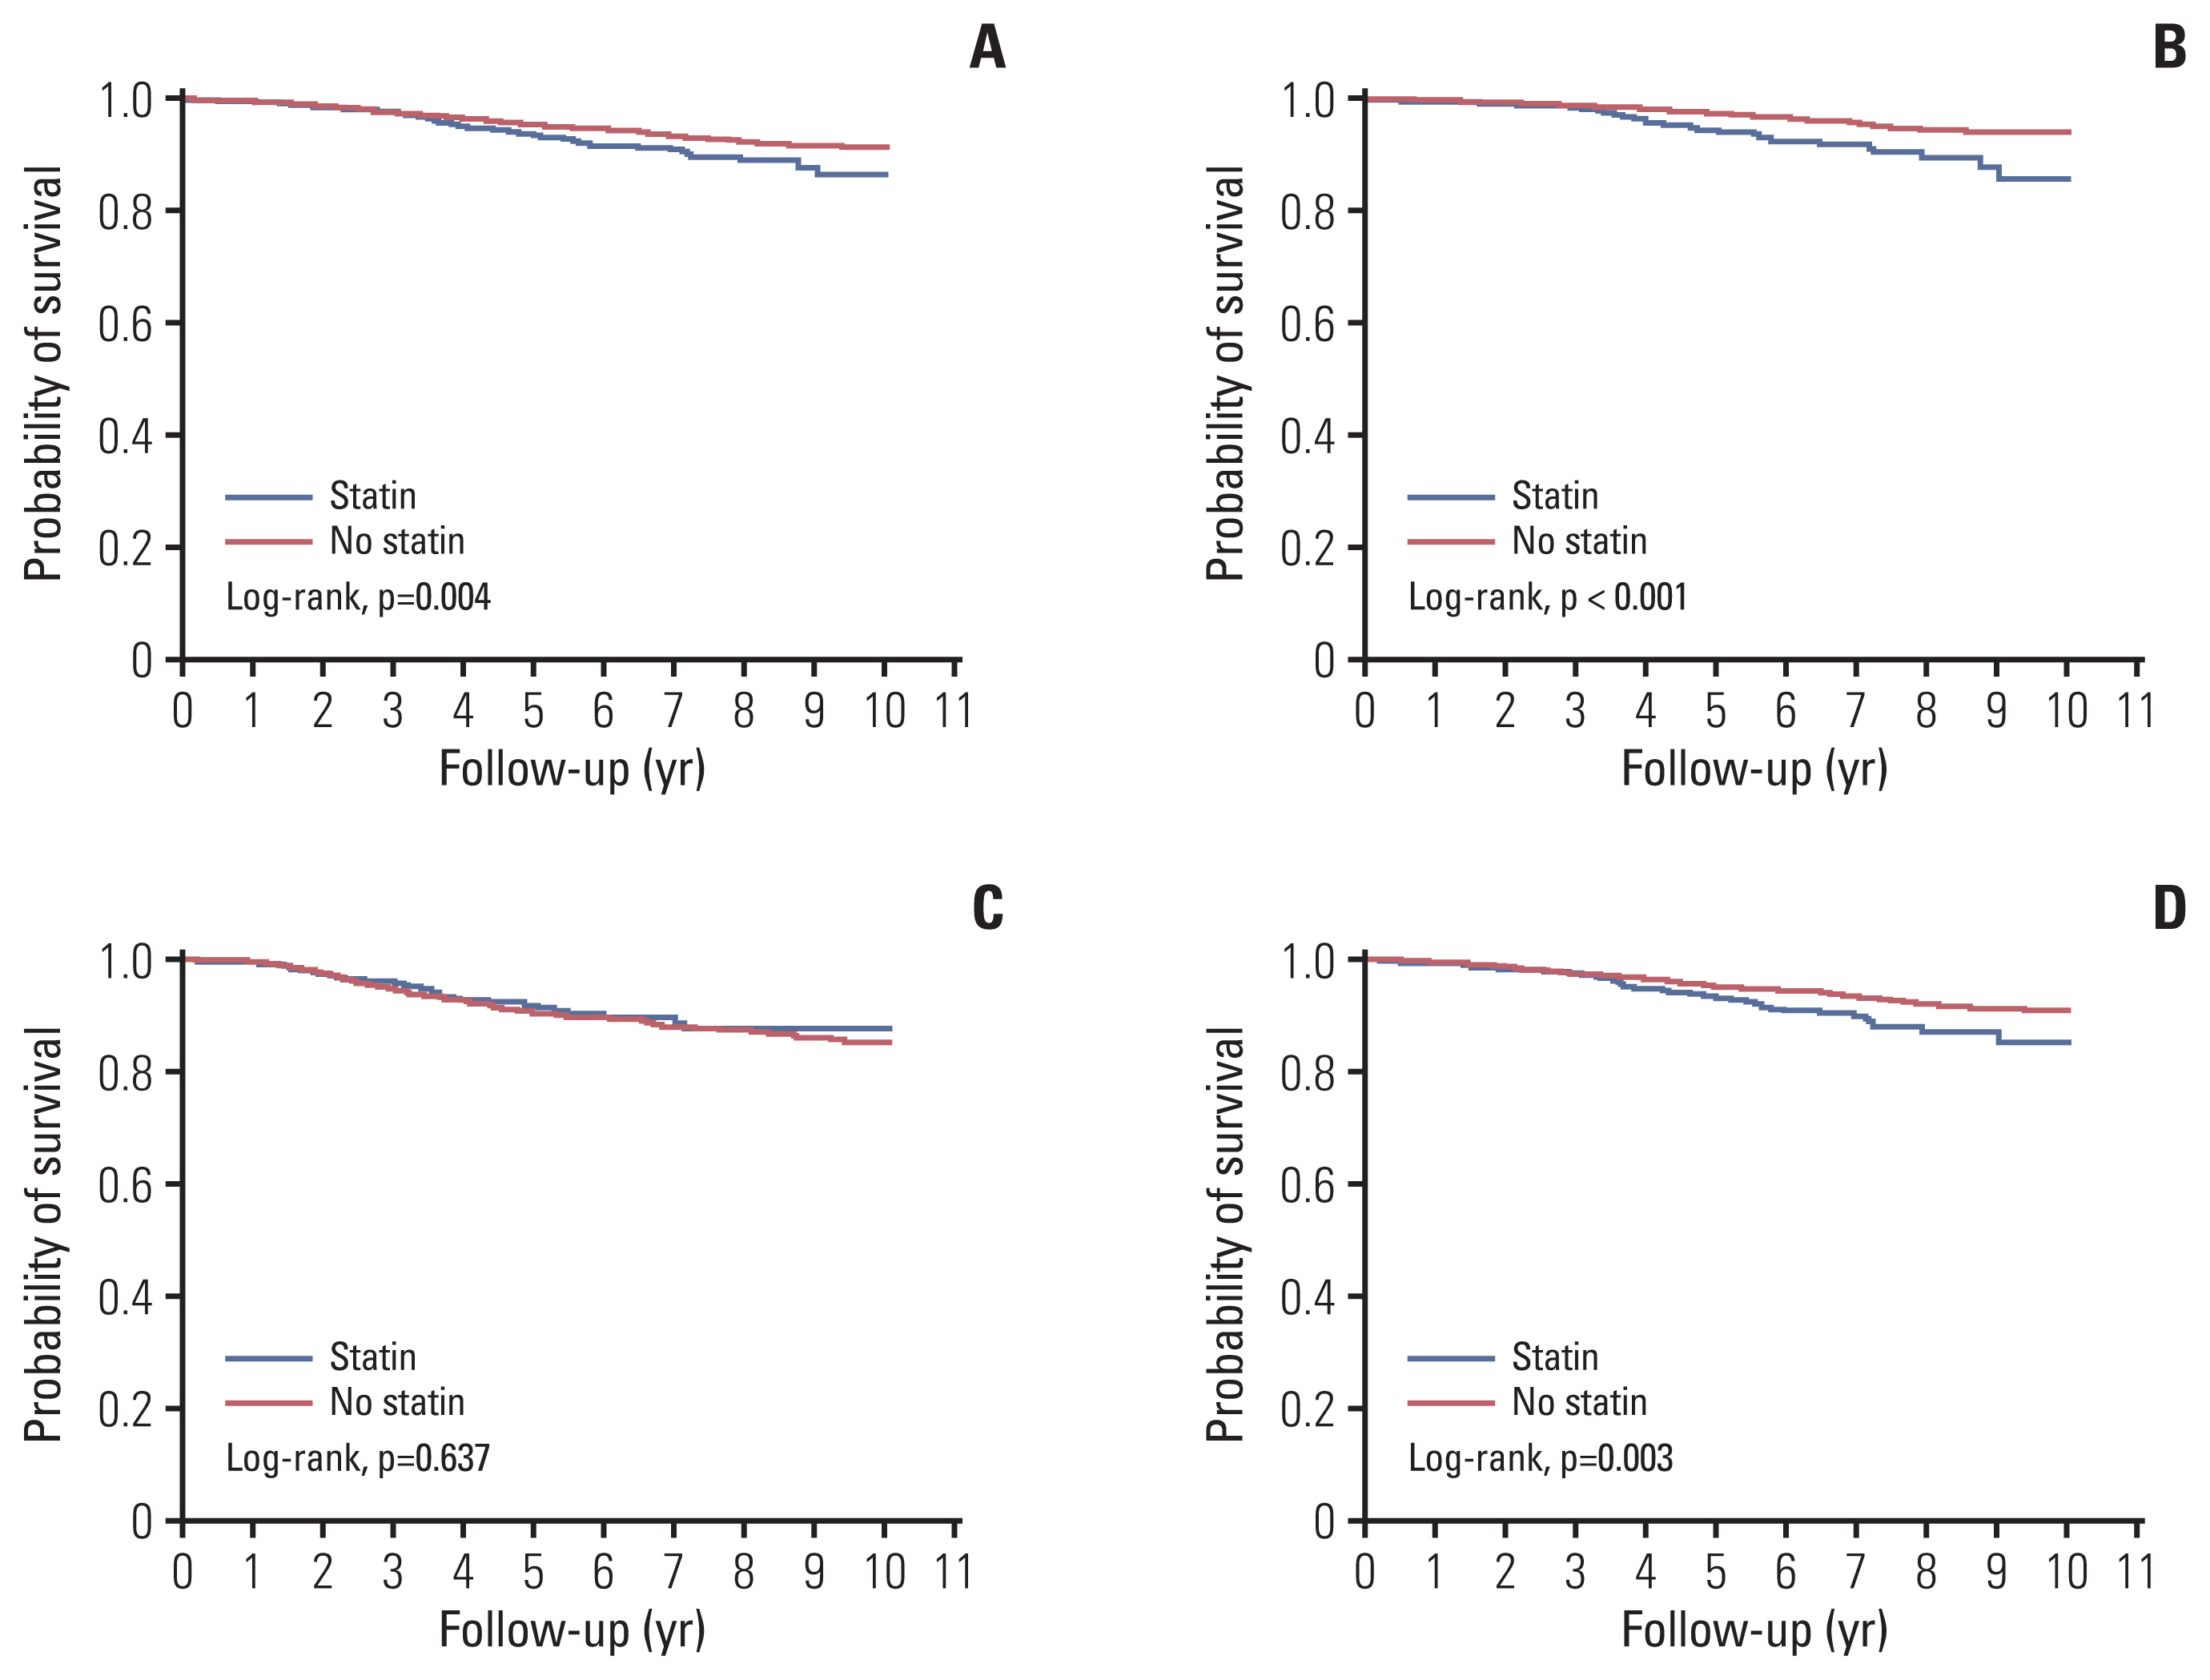
Fig. 3 compares survival curves of patients with and without an exposure to statin before the diagnosis of breast cancer. Among overall population of 7,452 patients, survival was significantly shorter in the statin group than in the no-statin group, with 5-year survival rates of 93.77% (95% CI, 91.87 to 95.23) vs. 95.49% (95% CI, 94.93 to 96.00), respectively (p=0.004) (Fig. 3A). These intergroup difference in survival was prominent in patients with ER-positive breast cancer, but less apparent in patients with ER-negative breast cancer, with 5-year survival rates of 94.58% (95% CI, 92.31 to 96.20) vs. 97.47% (95% CI, 96.94 to 97.91; p < 0.001) (Fig. 3B), 91.93% (95% CI, 87.96 to 94.63) vs. 90.55% (95% CI, 89.05 to 91.85; p=0.637) (Fig. 3C), respectively. The survival curve of the HER-2 available patients showed a similar pattern with that of the overall population with 5-year survival rates of 93.55% (95% CI, 91.09 to 95.35) vs. 95.35% (95% CI, 94.62 to 95.98; p=0.003) (Fig. 3D).
3. Multivariable analyses of survival
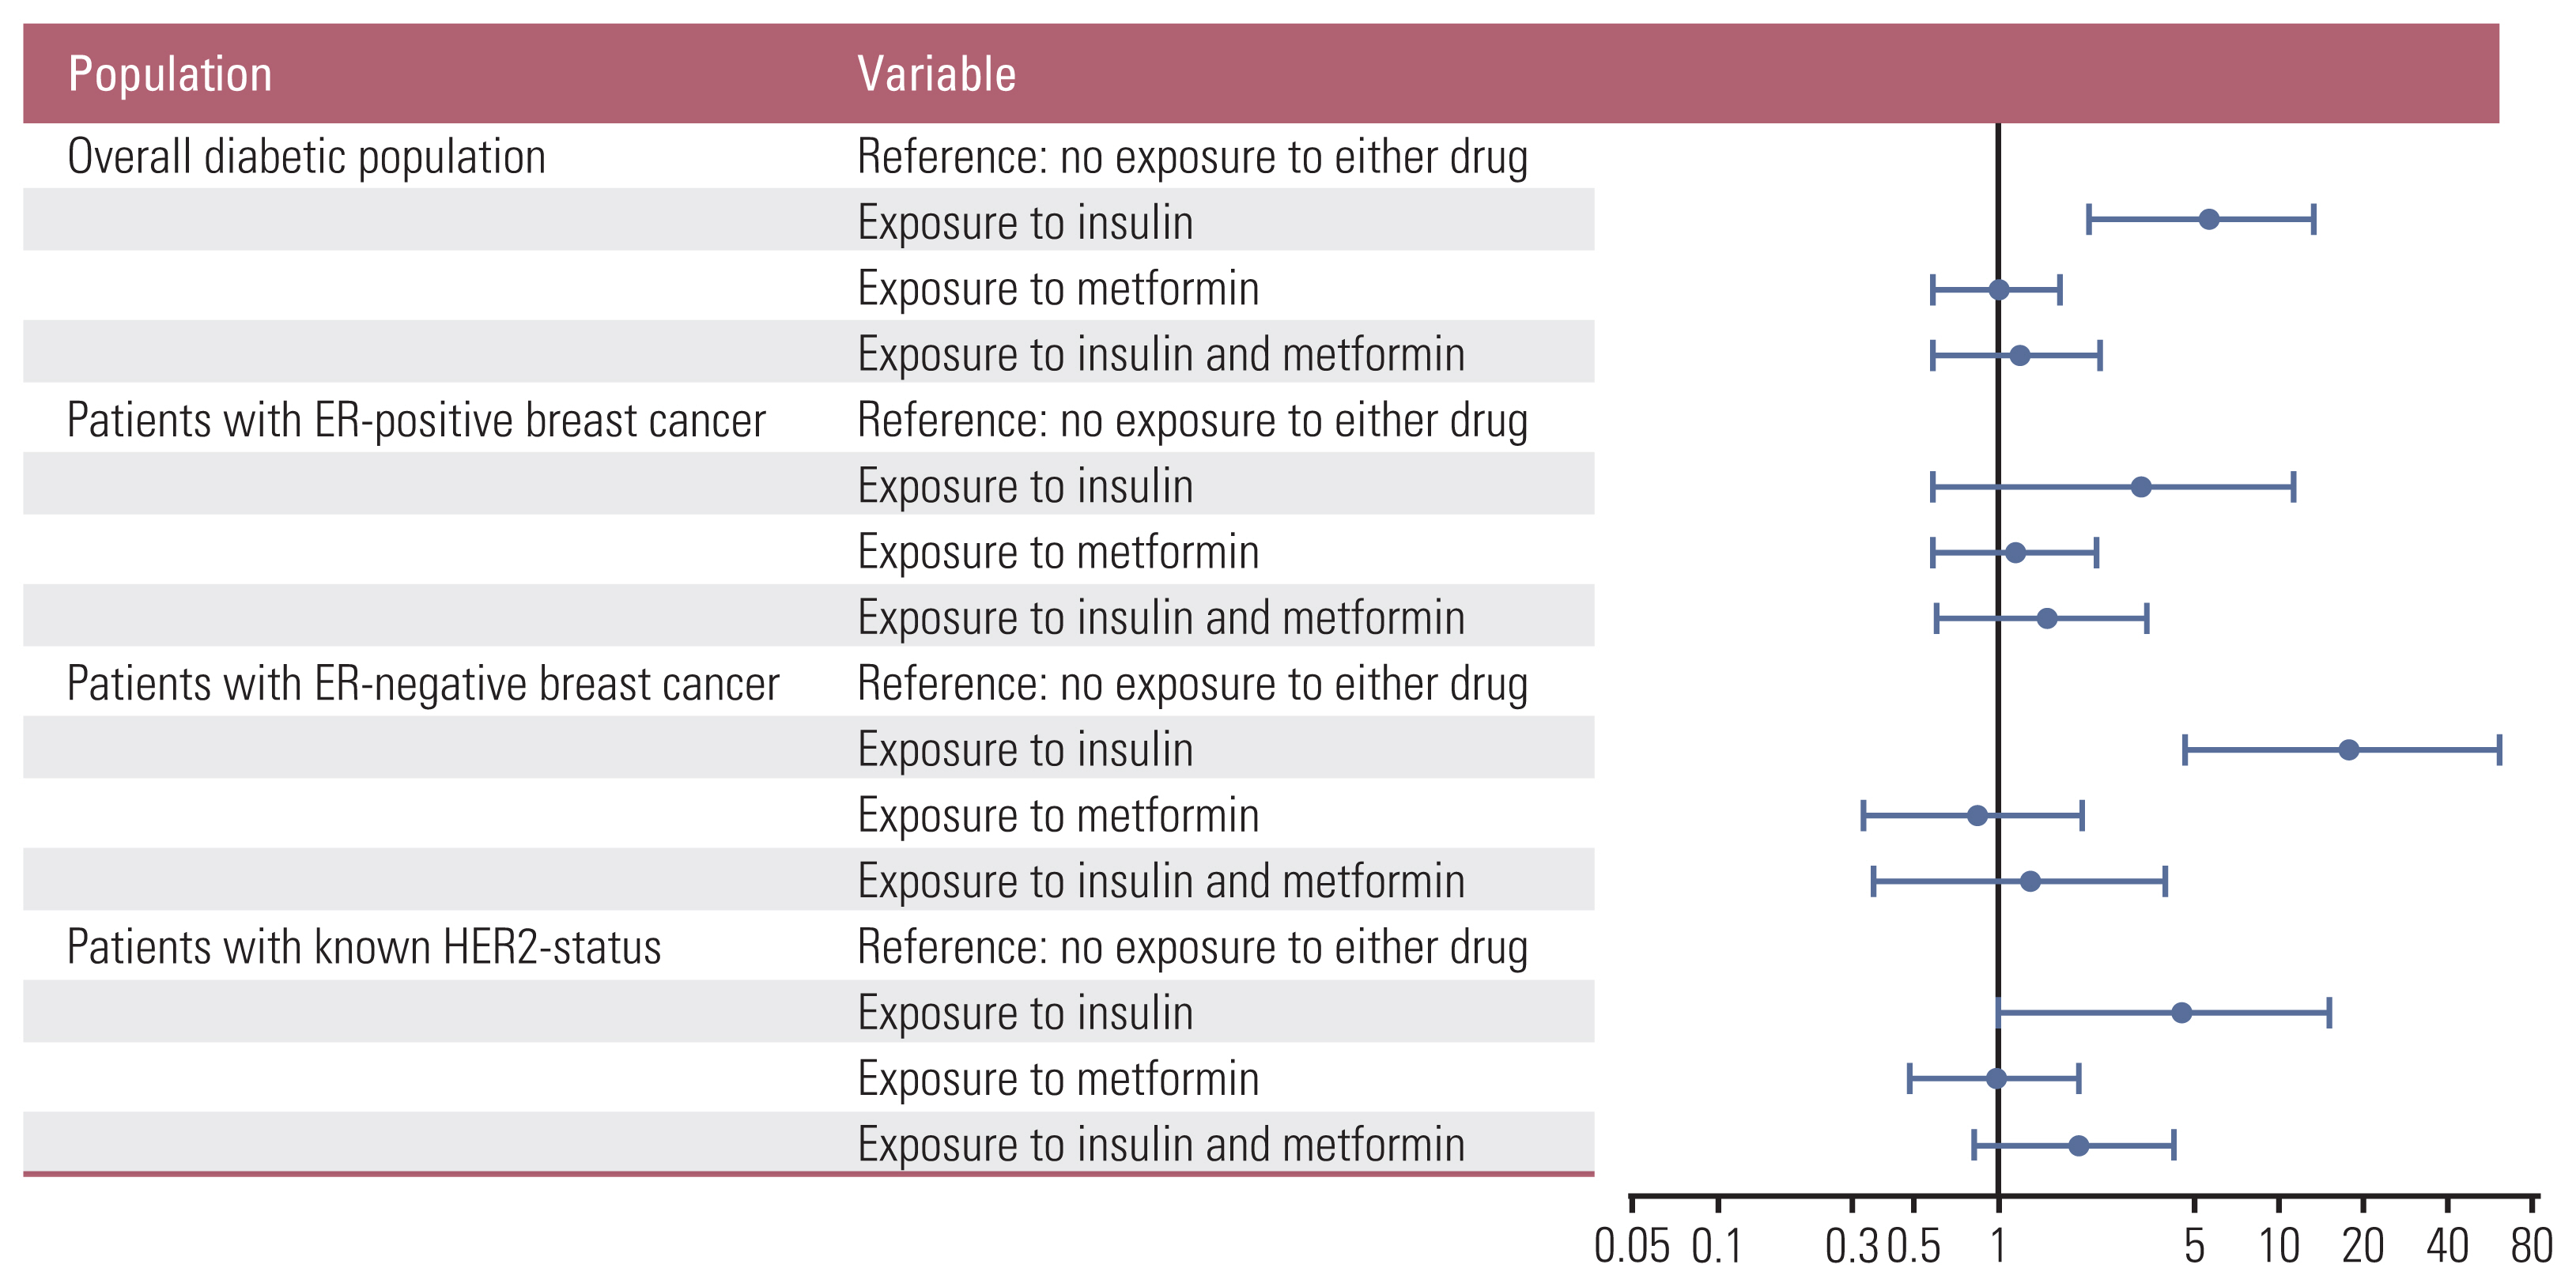
In the subsequent multivariable analyses of survival, the patient group without insulin or metformin use was the reference group. The hazard ratio (HR) of death for patients with insulin use before the diagnosis of breast cancer was 5.71 (95% CI, 2.11 to 13.42; p=0.001) in the overall diabetic population. This effect of prior insulin use was attenuated in patients with both insulin and metformin exposure with an HR of 1.21 (95% CI, 0.58 to 2.34; p=0.595). In a subsequent subgroup analysis in patients with ER-positive breast cancer, neither insulin nor metformin exhibited any significant effect on all-cause mortality with an HR of 3.26 (95% CI, 0.60 to 11.39; p=0.150) for the group with insulin use before the diagnosis of breast cancer. In contrast, the detrimental effect of prior insulin use was further prominent with an HR of 17.88 (95% CI, 4.66 to 61.17; p < 0.001) but was attenuated with co-administration of metformin with an HR of 1.29 (95% CI, 0.36 to 3.92; p=0.674) in patients with ER-negative breast cancer. A similar trend was also observed in patients with a known HER2 status with HRs of 4.48 (95% CI, 1.00 to 15.10; p=0.051) for the insulin group and 1.93 (95% CI, 0.83 to 4.20; p=0.124) for the insulin and metformin group (Table 3, Fig. 4).
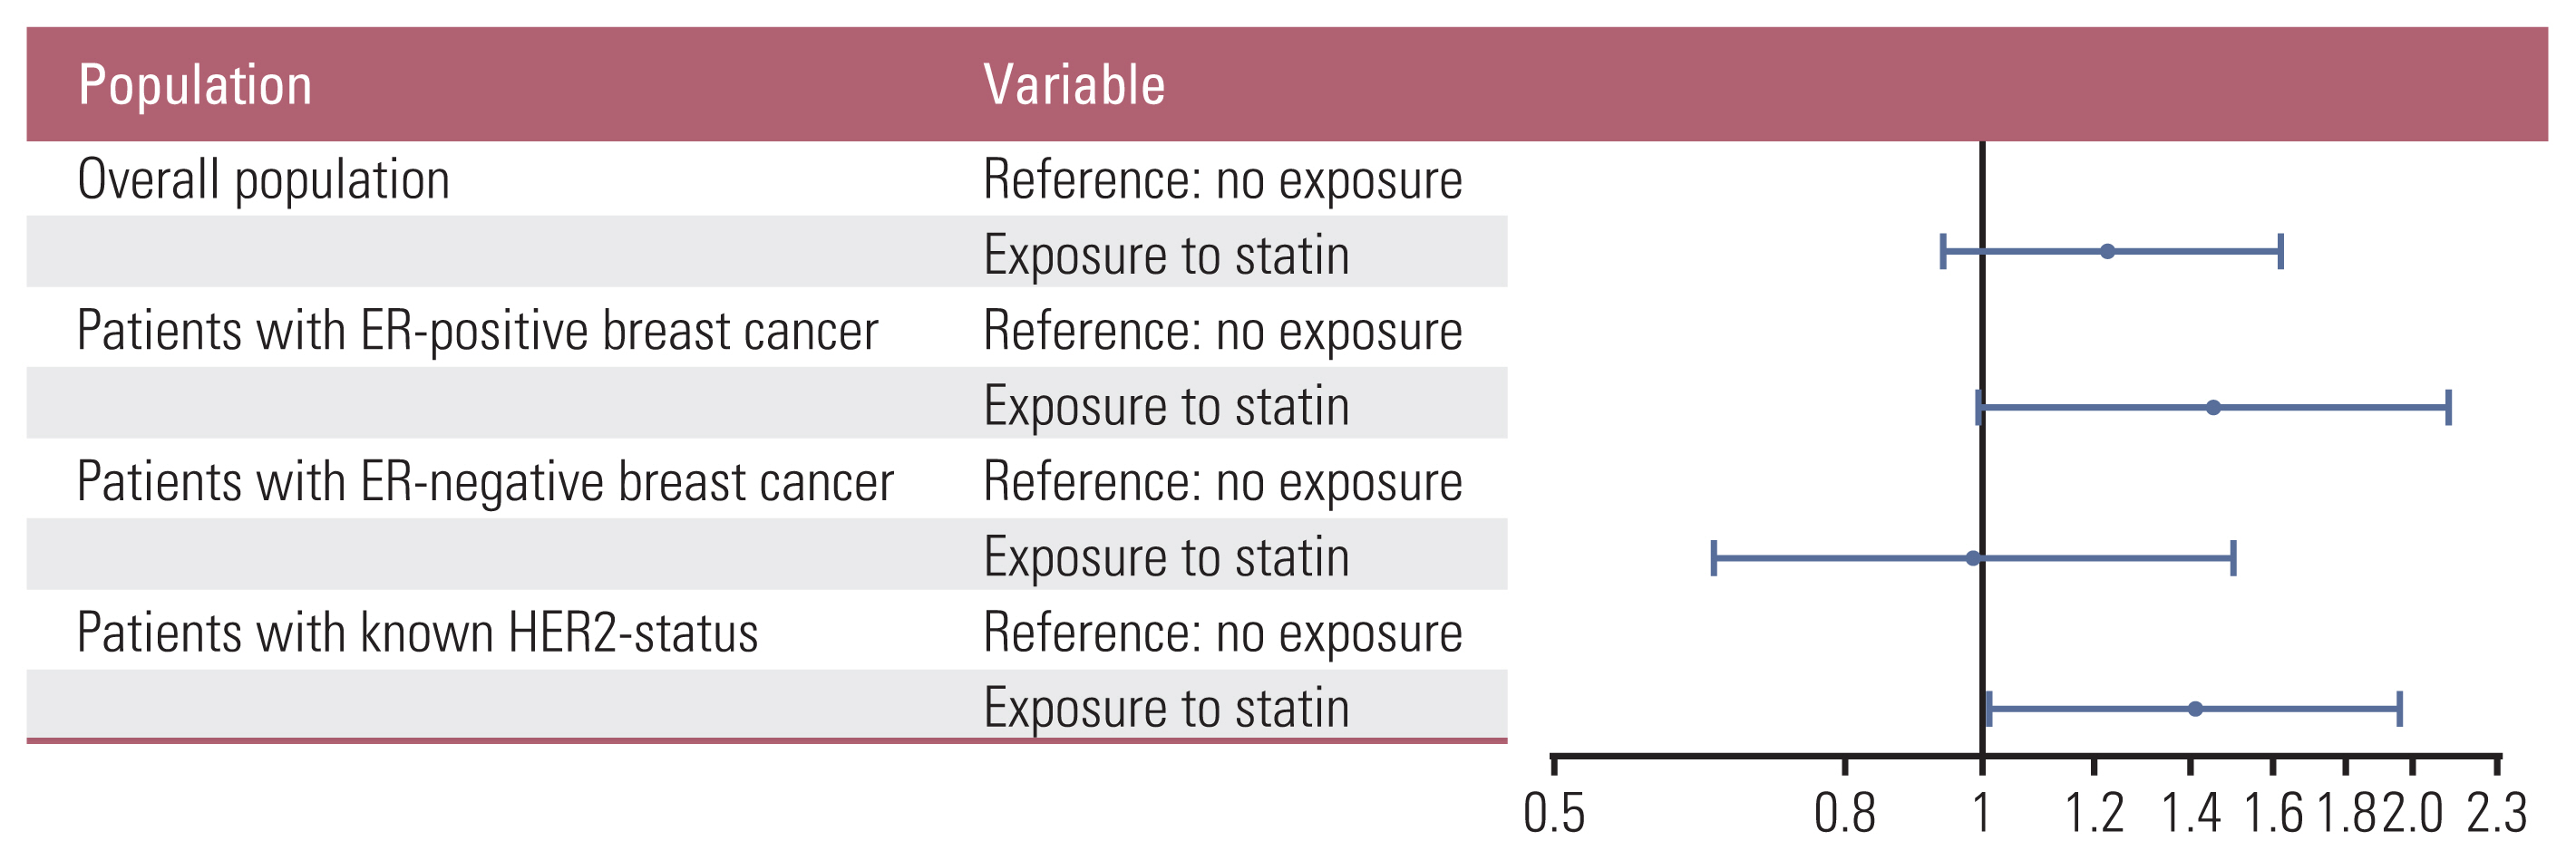
As for the statin exposure, statin use before the diagnosis of breast cancer was associated with HR for death of 1.23 (95% CI, 0.93 to 1.62; p=0.148) in the overall population. This effect of prior statin use became apparent in patients with ER-positive breast cancer with an HR of 1.45 (95% CI, 0.99 to 2.13), albeit with marginal statistical significance (p=0.055). In contrast, it was diluted in patients with ER-negative breast cancer with an HR of 0.99 (95% CI, 0.65 to 1.50; p=0.951). In patients with a known HER2 status, statin use was associated with increased risk of all-cause mortality with HR for death of 1.41 (95% CI, 1.01 to 1.97; p=0.040) (Table 4, Fig. 5).
In all the above-mentioned multivariable analyses, T2, T3, or T4 versus T1, N2 or N3 versus N0, and M1 versus M0 were associated with worse survival, whereas histology other than IDC or ILC versus IDC, PR positivity versus negativity, and HER2 positivity versus negativity were associated with a longer survival with varying degrees of statistical significance (S7–S14 Tables).
Discussion
This study suggests that insulin use before the diagnosis of breast cancer was associated with a worse survival in patients with breast cancer, but the co-administration of insulin and metformin attenuated this detrimental effect of insulin, both of which effects were more apparent in patients with ER-negative disease than with ER-positive disease. Statin use before the diagnosis of breast cancer tended to be associated with an increase in all-cause mortality, which was more prominent with ER-positive disease than with ER-negative disease, albeit with only marginal statistical significance.
The explanation behind the above observation is most likely multifactorial. First, cardiovascular mortality may have contributed to an increase in all-cause mortality with an exogenous insulin or statin use in the current analyses. Cardiovascular death has become a clinically important cause of mortality for patients with breast cancer as the survival of those with early stage and metastatic breast cancer has improved [18–20]. Recent studies on a Western population identified older age at diagnosis [18,19], history of CVD [19], and number of cardiovascular risk factors [20] as risk factors for cardiovascular mortality in patients with breast cancer. Indeed, insulin is mainly prescribed for patients with long-standing or poorly-controlled DM [21], while statin is generally for those with established CVD or at considerable risk for CVD [22]. These indications are more commonly present in older patients and often accompanied with a load of medical complications and a heightened risk of cardiovascular mortality. Reflecting this, in our study, patients with an insulin or statin exposure were more likely to be older than 50 years and have a higher CCI at the diagnosis of breast cancer than their counterparts without it.
In addition, breast cancer mortality could have been affected by an exposure to insulin, metformin, or statin mediated by the pharmacological effects of the studied drugs on breast cancer. Numerous preclinical studies have reported on potential mechanisms underlying these effects. With insulin resistance and hyperinsulinemia linked to an unfavorable prognosis in patients with breast cancer and DM [23], Chappell et al. [24] suggested that insulin has a direct mitogenic effect by signaling through its receptor. Insulin has also been shown to downregulate insulin growth factor- and sex hormone-binding proteins thereby increasing active mitogens in the blood [25]. Metformin, on the other hand, inhibits the mammalian target of rapamycin (mTOR) signaling by activation of AMP-activated protein kinase (AMPK) at the cellular level [26] and reduces circulating insulin, leptin, and inflammatory marker levels systemically [27] to exert its anticancer effects. Statin is believed to suppress tumor growth directly by inhibiting mevalonate pathway in the cancer cells and indirectly by lowering systemic cholesterol levels which can otherwise be utilized for tumor proliferation [5].
One may think patients with an exposure to metformin represent those with DM for a short-duration because metformin is often the first-line drug for newly-diagnosed diabetic patients in contrast to insulin [21]. However, several aspects of our findings cannot be fully attributed to confounding by such indications: the effect of insulin was partially offset by metformin use, and metformin had differential activities according to the hormone receptor positivity of the tumor. Indeed, there have been studies supporting the biological plausibility of this enhanced action of metformin against ER-negative breast cancer. Liu et al. [28] showed that metformin induced unique apoptotic effects against triple-negative breast cancer cell lines via poly(ADP-ribose) polymerase cleavage, the activation of the caspase signaling cascades, and the downregulation of epidermal growth factor receptor signaling beyond mTOR and AMPK.
It may seem counterintuitive that statin users exhibited increased risk of death compared to that of non-users in our study, given its putatively protective effect against breast cancer. But this likely has more to do with the indication of statin than the activity of it. Since statin is prescribed for patients with a greater risk of death from CVD, statin use can be indicative of an increased risk of cardiovascular mortality. Interestingly, this increase in all-cause mortality associated with statin use was more prominent with ER-positive disease than with ER-negative disease, suggesting anticancer effect of statin against ER-negative disease. Preclinical studies of statin on breast cancer have demonstrated that ER-negative tumor subtypes were more sensitive to the anti-proliferative effect of statin treatment [29,30].
Our study has several limitations. First of all, this is a retrospective study with unavoidable selection bias. Of note, the results may not be generalizable to patients who had not received surgery because only patients with surgically resected breast cancer were included in the current analyses. Second, subtle differences may have gone undetected due to the limited number of cases. Third, we are unable to answer whether the anticancer effect of the studied drugs is more potent in patients with triple-negative breast cancer among those with ER-negative disease, as they were not separately grouped in our study. Fourth, data on cause-specific mortality were unavailable, which might have enabled us to infer the relative contribution of different factors to the prognosis of our patient population. It should be noted that the analyses in the current study are not on breast cancer-specific survival but on overall survival. Subgroup analyses, such as the analyses according to the hormone receptor status, may have been more prone to bias due to this lack of data on cause of mortality. Finally, although we adjusted for various potential confounders, residual confounding by unrecorded variables cannot be ruled out completely as with all observational studies. For instance, co-administration of statin and antidiabetic agents was not taken into account in current analyses. In addition, body mass index, a surrogate for obesity, has been shown to be associated with the prognosis in patients with early breast cancer [31] and may have acted as a confounder in our study as well.
Despite these limitations, the present study is one of the few epidemiologic studies to examine the relationship of insulin, metformin, and statin use with breast cancer outcomes according to the hormone receptor status. Furthermore, we integrated an institutional database with nationwide claims data to completely capture the information on exposure and the tumor characteristics, which is often lacking in registry-based large-scale studies.
In conclusion, insulin or statin use before the diagnosis of breast cancer was associated with an increase in all-cause mortality. Subsequent analyses suggested potential protective effect of metformin or statin in patients with ER-negative disease. Further studies on the biological and pharmacological mechanism behind our observation are warranted.