Introduction
The tumor microenvironment plays an important role in tumorigenesis and tumor progression by fostering a crosstalk among tumor cells and several types of stromal cells via various signaling pathways [1]. Recent studies have shown that the tumor microenvironment is involved in regulating tumor dormancy and activation [2,3]. FOX genes, encoding transcription factors of a family characterized by the presence of a forkhead box (Fox) DNA-binding domain, play key roles in developmental processes during embryogenesis and tissue differentiation [4,5]. The gene encoding forkhead box C1 (FOXC1), located at 6p25, is involved in the pathogenesis of Hodgkin lymphoma, via the deregulation of B-cell differentiation [6]. FOXC1 expression has been studied in epithelial tumor cells, such as those of nasopharyngeal carcinoma, breast cancer, prostate cancer, and melanoma, and it plays a regulatory role in the biological behavior of these tumors [7,8]. A recent study revealed that FOXC1 is preferentially expressed in C-X-C motif chemokine 12 (CXCL12)–associated reticular cells (CAR cells), and might promote CAR cell development, upregulating CXCL12 and stem cell factor expression [9]. CAR cells play essential roles in the tumor microenvironment and are involved in the regulation of hematopoietic stem cells and disseminated tumor cells within the bone marrow, affecting retention in the bone marrow, quiescence, and repopulation [10,11]. This connection between CAR cells and FOXC1 indicates that FOXC1 expression in the tumor microenvironment is critical and specific for hematopoietic stem cell niche formation and maintenance [12]. Although FOXC1 has a potential role in stromal cells in regulating cell dormancy and activation within the tumor microenvironment, similar to CAR cells, studies on FOXC1 expression in stromal cells within tumor microenvironments of hematological malignancies are limited.
The imbalance in activation of the p38 mitogen-activated protein kinase (MAPK) pathways and extracellular signal regulated kinase (ERK) MAPK pathways plays a key role in the establishment of tumor dormancy and activation. In dormant tumors, phosphorylated p38 MAPK is generally more active than phosphorylated ERK MAPK, and vice versa with respect to tumor activation [2,3]. Studies also show that the p38 and ERK MAPK pathways are involved in normal immature T cell differentiation. Increased p38 MAPK activation blocks T cell differentiation, whereas increased ERK1/ERK2 activation is required for T cell differentiation [13,14].
Here, we hypothesized that FOXC1 might be involved in regulating tumor dormancy and activation within the tumor microenvironments of T cell and natural killer (NK) cell lymphomas, which occur frequently at various extramedullary sites, disseminate regularly into the bone marrow, and are clinically aggressive [15]. In the present study, we investigated the implications of FOXC1 expression in the tumor microenvironments of T and NK cell lymphomas, focusing on tumor dormancy and activation with respect to the p38 MAPK and ERK MAPK pathways.
Materials and Methods
1. Case selection and clinicopathological analysis
In total, 120 cases of T and NK cell lymphomas diagnosed at the Severance Hospital from 1999 to 2013 were selected. Consecutive patients with pathological diagnoses of T and NK cell lymphomas based on biopsied or excised specimens were included in this study. Patients with remaining tissue inadequate to construct tissue microarrays (TMAs) or perform immunohistochemical staining were excluded. The included subtypes were 35 cases of peripheral T cell lymphoma, not otherwise specified (PTCL, NOS), 39 cases of extranodal natural killer/T cell lymphoma (NKTL), 12 cases of angioimmunoblastic T cell lymphoma (AITL), 20 cases of anaplastic large-cell lymphoma (ALCL), anaplastic lymphoma kinase (ALK)-positive, or ALK-negative (ALCL, ALK+, n=10; ALCL, ALK−, n=10) disease, 11 cases of T lymphoblastic leukemia/lymphoma (T-LBL), and three cases of other types. The extramedullary sites were the primary epicenter of all cases. All cases were reviewed and reclassified based on the 2008 and 2017 World Health Organization classification [16,17].
Clinical data including age, sex, primary site, Ann-Arbor stage, International Prognostic Index (IPI) risk score, lactate dehydrogenase (LDH) level, bone marrow involvement, and follow-up data were obtained from electronic medical records, and prognostic implications were analyzed for 120 patients with available clinical data. The mean follow-up period after diagnosis was 14 months (range, 1 to 184 months). The clinicopathological features of the patients are summarized in S1 Table.
2. TMA construction and immunohistochemical evaluation
TMA construction and immunohistochemical staining of TMA blocks were performed following a standard protocol using a Ventana automatic immunostainer (Ventana, Benchmark, Tuscan, AZ) as previously described [18]. The following primary antibodies were used: FOXC1 (1:50, Abcam, Cambridge, UK), CXCL12 (1:50, CXCL12/SDF1, R&D Systems, Minneapolis, MN), phosphorylated p38 (p-p38; 1:100, phospho T180+Y182, Abcam), phosphorylated ERK1 and ERK2 (p-ERK1/2; 1:100, Erk1 [pT202/pY204]+Erk2 [pT185/pY187], Abcam), CD163 (1:100, clone MRQ-26, Cell Marque, Rocklin, CA), CD68 (1:150, clone PG-M1, Dako, Glostrup, Denmark), CD34 (1:50, clone QBEnd 10, Dako), S100 (1:2,000, Dako), and α-smooth muscle actin (1:500, clone 1A4, Dako).
To identify FOXC1+ and CXCL12+ stromal cells, the number of spindled reticular cells with positive immunoexpression in the cytoplasm was counted in at least five fields of the captured microscopic photographs at 400× magnification and the average cell number was obtained. The cutoff for high FOXC1+ stromal cell infiltration was defined as the number of FOXC1+ stromal cells that surpassed the median value of the 120 tested cases. To evaluate p-p38 and p-ERK1/2 immunoexpression in tumor cells, moderate to strongly stained nuclei of tumor cells were counted and divided by the total cell count of the same field. These markers were also counted in at least five high-power fields using photographs and the average proportion was obtained. Protein expression was divided into high and low using median values.
3. Genetic analyses using acute myeloid leukemia cases based on the Cancer Genome Atlas Network data
The mRNA expression levels of FOXC1, p38 MAPKs (MAPK11, MAPK14, MAPK12, and MAPK13), ERK MAPKs (MAPK1/ERK2 and MAPK3/ERK1), and DUSP1 (MAPK phosphatase 1, MKP-1; the regulator of MAPK phosphorylation) were compared using the data on acute myeloid leukemia (AML) in The Cancer Genome Atlas Network (TCGA; https://cancergenome.nih.gov). Comprehensive genetic analyses were performed using cBioPortal; mRNA expression z-scores were calculated relative to diploid samples as select genomic profiles and to FOXC1, MAPK14, MAPK11, MAPK12, MAPK13, MAPK1, MAPK3, and DUSP1 as enter genes (TCGA, PanCancer Atlas; n=165; http://www.cbioportal.org). These genes were selected based on the information in UniProtKB (https://www.uniprot.org).
4. Statistical analysis
Statistical analyses were performed using SPSS software, ver. 23.0 for Windows (IBM Corp., Armonk, NY). Pearson’s chi-square test or Fisher exact test was used to compare differences between variables, and the Spearman coefficient was used for correlation analysis. Patient survival with variables was analyzed using univariate and multivariate Cox proportional hazard models. Overall survival curves were plotted using the Kaplan-Meier method and compared using the log-rank test. All p-values < 0.05 were considered statistically significant.
Results
1. Association of FOXC1+ stromal cells in the tumor microenvironment with tumor dormancy and activation
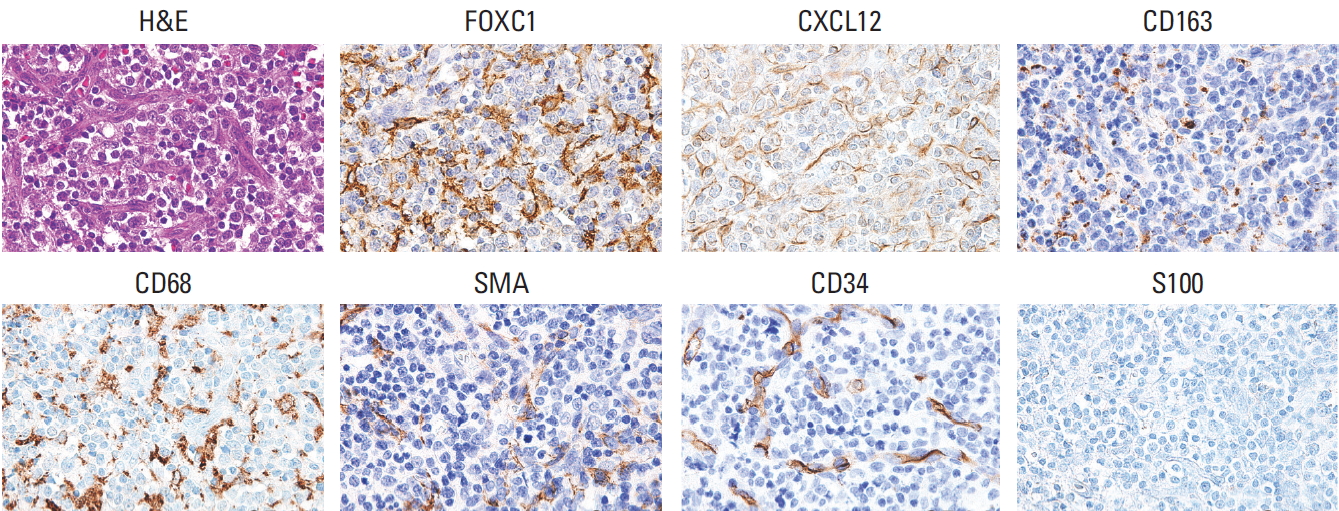
FOXC1+ stromal cells variably expressed CXCL12 (Fig. 1). FOXC1 and CXCL12 expression was not significantly concordant in reticular stromal cells within the microenvironments of T and NK cell lymphomas (r=−0.053, p=0.565) (S2 Fig.). FOXC1 was also expressed in other types of stromal cells, most of which were morphologically similar to reticular spindle cells, histiocytes, activated macrophages, (myo) fibroblasts, and endothelial cells, which express CD163, CD68, α-smooth muscle actin, and CD34. However, only a portion of each cell type expressed FOXC1, and some of these cells did not express FOXC1 (Fig. 1).
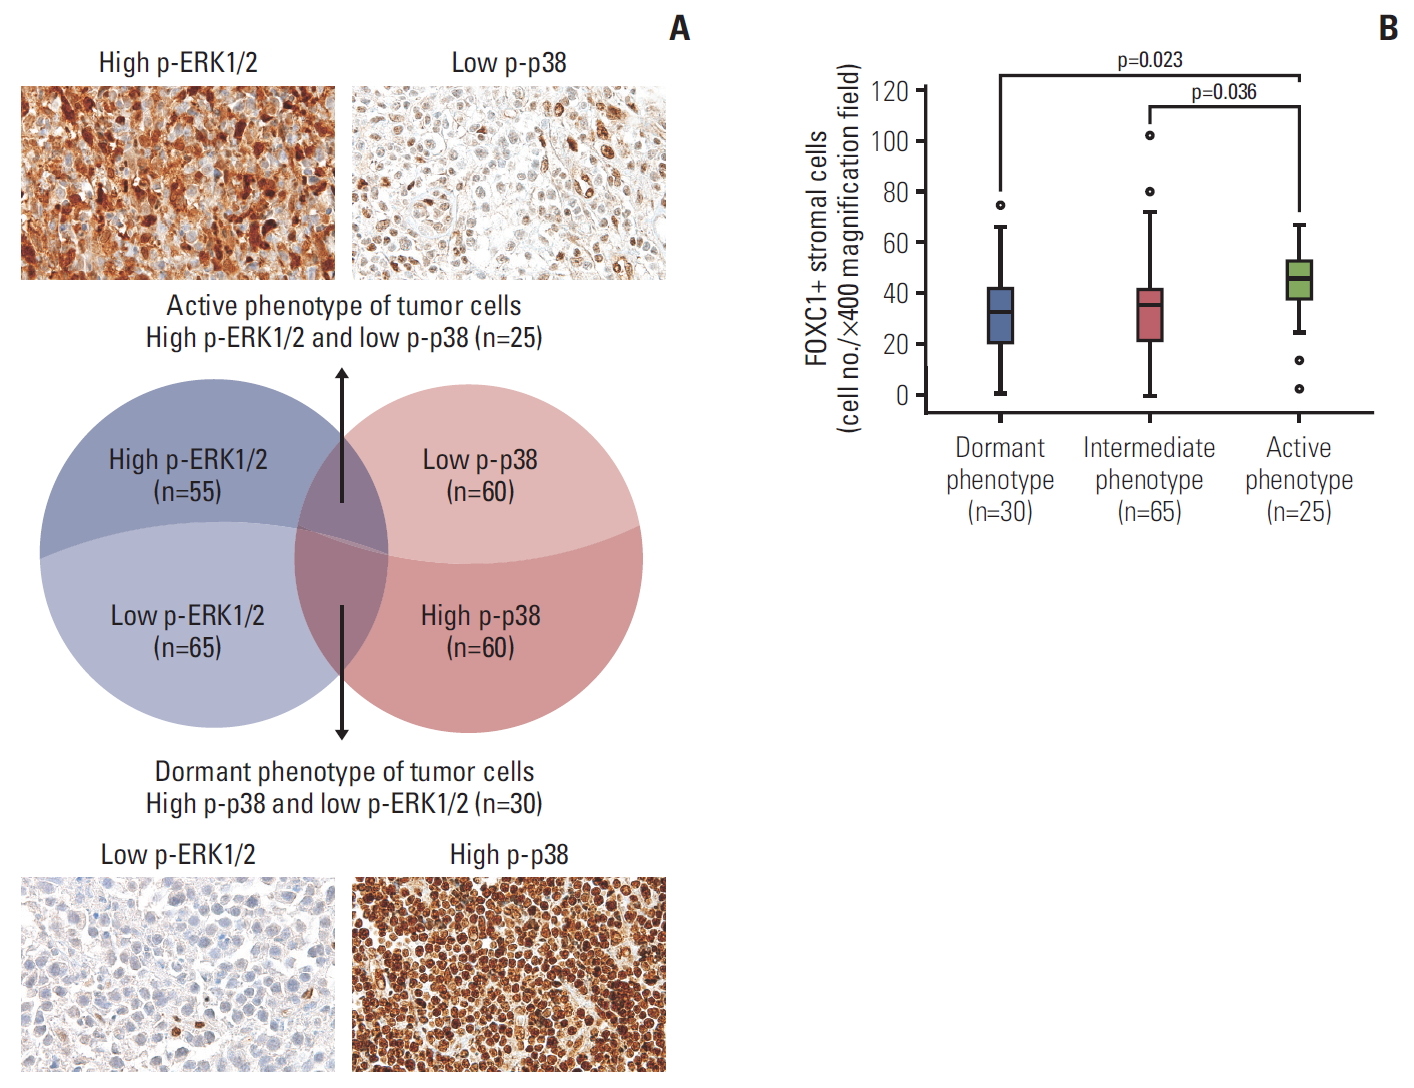
Nuclear expression of p-p38 and p-ERK1/2 in tumor cells was individually grouped into high and low based on a cutoff of the median value of the tested lymphoma cases. Tumors were defined as having a dormant phenotype (high p-p38 and low p-ERK1/2; n=30, 25.0%), active phenotype (high p-ERK1/2 and low p-p38; n=25, 20.8%), or intermediate type (both high p-p38 and p-ERK1/2 or both low p-p38 and p-ERK1/2; n=65, 54.2%) (Fig. 2A). Cases with an active phenotype of tumor cells showed significantly more infiltrating FOXC1+ stromal cells within the tumor microenvironment than those with dormant or intermediate phenotypes (p=0.023 and p=0.036, respectively) (Fig. 2B).
2. Status of FOXC1+ stromal cells in the tumor microenvironment with respect to clinicopathological variables
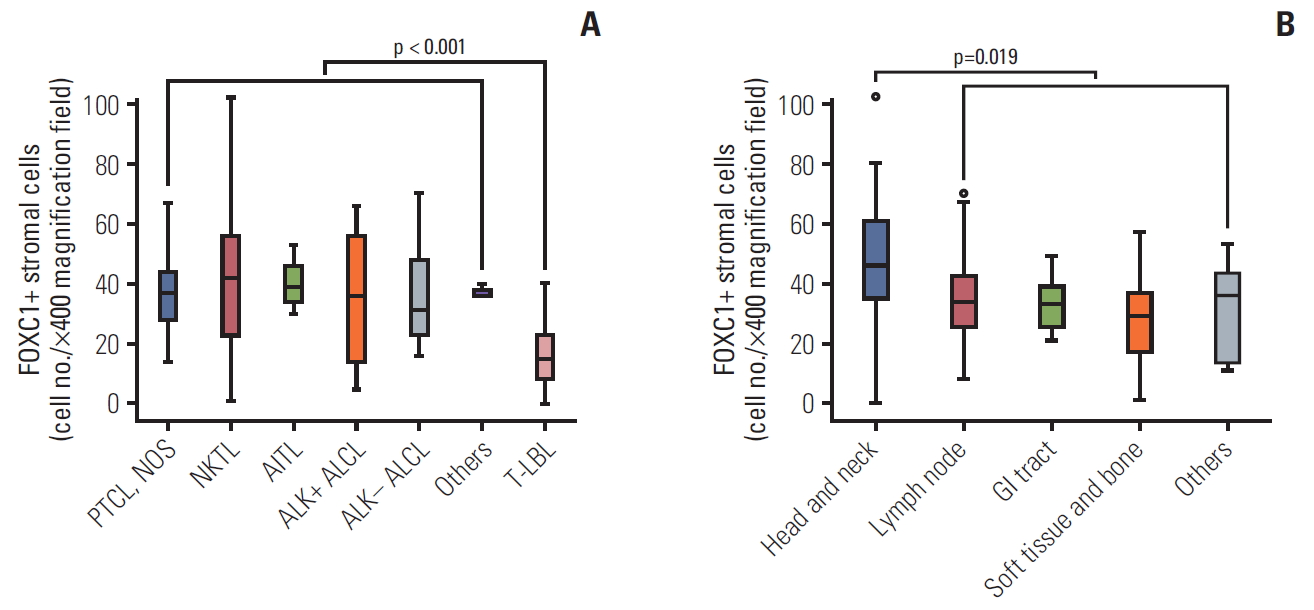
The status of FOXC1+ stromal cell infiltration in the tumor microenvironment according to clinicopathological variables is summarized in Table 1 and Fig. 3. The number of FOXC1+ stromal cells that infiltrated into the tumor microenvironment differed significantly according to the T and NK cell tumor subtype (p=0.003) (Table 1). Precursor T-LBL was characterized by significantly low numbers of FOXC1+ stromal cells as compared to that in mature T or NK cell lymphomas (p < 0.001) (Fig. 3A). The number of FOXC1+ stromal cells also differed significantly according to the anatomic site/organ of the tumors; head and neck sites contained relatively higher numbers of FOXC1+ stromal cells than did the remaining sites (p=0.019) (Table 1, Fig. 3B). Increased LDH levels and higher IPI scores (score ≥ 3) were significantly associated with increased numbers of counted FOXC1+ stromal cells (p < 0.05 for both); however, such association was not noted when cases were divided into two groups of low and high FOXC1+ stromal cell infiltration (Table 1). Bone marrow involvement, Ann-Arbor stage, or age did not correlate significantly with FOXC1+ stromal cells within the tumor microenvironment (Table 1).
The clinicopathological features did not show any significant correlation with the dormant, intermediate, or active phenotypes of tumor cells (S3 Table). Although statistical significance was not observed, the active phenotype was relatively rare in cases of precursor T-LBL (9.1%, 1/11). However, the dormant phenotype was relatively more frequent (45.5%, 5/11) than other subtypes (S3 Table, S4 Fig.).
3. Comparison of FOXC1, p38 MAPK, and ERK MAPK mRNA expression levels in AML cases
Cases with high FOXC1 mRNA expression were not matched with those with high p38 MAPKs (MAPK11, MAPK14, MAPK12, and MAPK13) mRNA, ERK MAPKs (MAPK1/ERK2, MAPK3/ERK1) mRNA or DUSP1 mRNA expression. The expression of p38 MAPKs was not high in cases showing high FOXC1 expression (Fig. 4).
4. Prognostic implications of FOXC1+ stromal cells within the T or NK cell lymphoma microenvironments
The overall survival rates of patients according to the status of FOXC1+ stromal cells, as well as other clinicopathological variables, were evaluated using univariate and multivariate analyses and are summarized in Table 2 and Fig. 5. Low FOXC1+ stromal cell infiltration correlated significantly with a worse overall survival rate (p=0.014) (Table 2, Fig. 5A). In addition, age > 60 years, lymph nodes as tumor sites (vs. head and neck sites), higher Ann-Arbor stage (≥ III), and higher IPI scores (≥ 3) were significantly related to poor overall survival based on univariate analysis (p < 0.05 for all) (Table 2, Fig. 5B-E). However, the tumor phenotypes (dormant, active, or intermediate) were not related to overall survival rates (p=0.327) (Table 2, Fig. 5F). In multivariate analysis, higher IPI scores (≥ 3) were independent prognostic factors for overall survival (p < 0.001) (Table 2). Although not statistically significant, low FOXC1+ stromal cell status tended to be marginally yet independently related to poor overall survival (p=0.059) (Table 2).
Survival analyses for high and low FOXC1+ infiltrated tumors were performed according to each subtype, PTCL and AITL cases (known to be associated with poor prognosis), and NKTL and ALK+ ALCL cases (with good prognosis) (S5 Fig.). There was no statistically significant association in each subtype. Survival analysis for high and low FOXC1+ stromal cells in all cases except those with tumors arising in the head and neck was performed; low FOXC1+ stromal cell-infiltrated tumors showed significantly poorer survival (p=0.020) (S6 Fig.). According to the primary site, tumors with low FOXC1+ stromal cell infiltration arising in lymph nodes were associated with significantly lower survival (p=0.025) (S7 Fig.). In NKTL cases, tumors arising in lymph nodes were associated with a worse prognosis than those arising in the head and neck (p < 0.001) (S8 Fig.). In the univariate and multivariate analyses of subtypes and primary sites, ALK+ ALCL showed a significantly better prognosis (S9 Table).
Discussion
Although the microenvironments of extramedullary hematopoietic disorders have not been studied extensively, the contribution of the tumor microenvironment to the pathogenesis of lymphoid malignancies is being increasingly recognized [19,20]. Based on a recent study showing that FOXC1 is critical for maintaining the bone marrow microenvironment associated with hematopoietic stem cell regulation [9], we hypothesized that it might be involved in the regulation of tumor dormancy and activation in the microenvironments of T and NK cell lymphomas. Here, we investigated the infiltration of FOXC1+ stromal cells within the tumor microenvironment, along with p-ERK1/2 and p-p38 expression in tumor cells.
Unlike previous results showing that FOXC1 expression is the highest in CAR cells within the normal bone marrow microenvironment compared to that in other bone marrow non-hematopoietic cells (with very low levels) [9], various lineages of stromal cells were found to express FOXC1 in this study. We observed that FOXC1 was expressed in stromal cells, most of which were morphologically compatible with reticular spindle cells, fibroblasts, and histiocytes. Some FOXC1+ stromal cells expressed CXCL12, whereas the others did not. This difference might be caused by variations in the microenvironments; extramedullary sites, which are sites of lymphomagenesis, instead of the normal bone marrow microenvironment, were investigated in this study.
To assess the putative role of FOXC1+ stromal cells in regulating tumor dormancy and activation within the tumor microenvironment, we divided tumor phenotypes into active or dormant phenotypes based on phosphorylated p38 and ERK1/2 expression in accordance with previous reports [2,3]. The number of infiltrating FOXC1+ stromal cells was significantly lower in the dormant tumor cells than in active phenotype tumor cells within the microenvironments of T and NK cell lymphomas. This observation was not concordant with the results of a previous study [9]. In that study, FOXC1 was found to be essential for the maintenance of mesenchymal niches for hematopoietic stem cells and progenitor cells within the normal bone marrow [9]. Although our study focused on tumors of T and NK cell lineages in extrabone marrow sites, these conflicting results require further in-depth investigations.
Evidence supporting either observation is limited as studies on the role of FOXC1 in hematological malignancies are rare. Although recent comprehensive genetic analyses on AML based on TCGA data have not focused on T and NK cell lymphomas or their microenvironments, they might support our observations. We also compared the mRNA expression levels of FOXC1, p38 MAPKs (MAPK11, MAPK14, MAPK12, and MAPK13), ERK MAPKs (MAPK1/ERK2, and MAPK3/ERK1), and DUSP1 using the AML data. We noted that the expression of p38 MAPKs was not high in cases showing high FOXC1 expression. A comparison of the mRNA levels of a limited number of genes cannot be used to delineate the overall signaling cascade involving the phosphorylation and activation of the p38 MAPK and ERK MAPK pathways. However, this finding suggests that FOXC1 activation occurs predominantly in non-dormant hematological malignancies.
In addition, patients with precursor T-LBL had fewer FOXC1+ stromal cells than those with mature T and NK cell lymphomas. Moreover, in the precursor T lymphoblastic lymphoma, the active phenotype was relatively rare, whereas the dormant phenotype was relatively more common than other subtypes. Another study showed that imbalances between p38 MAPK and ERK MAPK pathways were associated with the dormancy of acute T lymphoblastic leukemia, the leukemic counterpart of precursor T lymphoblastic lymphoma [21]. Taken together, these observations suggested that the number of FOXC1+ stromal cells might be associated with the tumor status, i.e., an active or dormant phenotype. Further in-depth study is required to understand the mechanisms through which FOXC1 is downregulated in the stromal cells of dormant tumors. Studies show that crosstalk between tumor cells and their microenvironments controls the switch between proliferating and dormant tumor cells, and various signals are involved in this switch [22]. FOXC1 activation or suppression in the tumor microenvironment might be one of the signals involved in the regulation of tumor dormancy or activation, along with the p38 MAPK and ERK MAPK pathway cascades.
In the present study, low infiltration of FOXC1+ stromal cells were associated with a dormant phenotype and poor outcome for patients with T and NK cell lymphomas. The dormant phenotype is generally considered to be associated with therapy resistance, resulting in treatment failure and disease progression [2,3]. However, this phenotype was not specifically associated with patient prognosis in our series. The reduced infiltration of FOXC1+ stromal cells into the tumor microenvironment appears to be related to the aggressive clinical behavior of T and NK cell lymphomas. Survival could be affected by the behavior of each subtype, but the tendency of low FOXC1+ stromal cell-infiltrated tumors to show poor prognosis was maintained according to the subtypes. This tendency was also maintained according to the primary site, except the head and neck, which included similar numbers of cases of NKTL in both the FOXC1+ low and high groups. NKTL is known to be associated with a good prognosis among T and NK cell lymphomas, but NKTLs arising in the lymph node have a poorer prognosis than those arising in the head and neck, and NKTLs with low FOXC1+ stromal cell-infiltrated tumors showed a similar tendency of poor prognosis. Overall, patient outcome appears to be ultimately determined by a combination of intrinsic factors, such as the dormant or activated status of tumor cells, and extrinsic factors, such as the tumor microenvironment [23]. For T and NK cell lymphomas, FOXC1+ stromal cells in the tumor microenvironment might be an important extrinsic factor determining the biological phenotypes of tumor cells and the clinical risk of patient outcome.
Our study has certain limitations. FOXC1 is a transcription factor, and recent studies have revealed that its expression is preferentially nuclear [9]. In addition, in several studies on carcinomas of epithelial origin, upregulated nuclear expression of FOXC1 was found to be related to proliferation, epithelial-mesenchymal transition, angioinvasion, and poor patient prognosis for basal-like breast carcinoma [24,25], gastric carcinoma [26], non-small cell lung cancer [27], and oral squamous cell carcinoma [28]. However, in our study on T and NK cell lymphoma tissues, FOXC1 was generally expressed in the cytoplasm of stromal cells within the tumor microenvironment, and a reduction in the number of FOXC1+ stromal cells was related to unfavorable patient prognosis. Some studies have shown that FOXC1 is phosphorylated and activated by the ERK1/2 MAPK pathways and that phosphorylated FOXC1 localizes to the nuclei, while the unphosphorylated form remains in the cytosol [29,30]. Although the results of these in vitro analyses do not completely support our observations, they might partially explain our results regarding the association between increased FOXC1 expression and the active phenotype characterized by high p-ERK1/2 levels. FOXC1 in the cytosol of stromal cells might be unphosphorylated and could act as a substrate for activated ERK MAPK. The suppression of ERK MAPK in dormant tumors might not necessarily lead to an increase in the levels of unphosphorylated FOXC1 in the cytosol. Actually, a recent study on ovarian serous tumors showed that cytoplasmic FOXC1 expression decreases with higher histological tumor grade, which suggests that cytoplasmic FOXC1 might be unphosphorylated [31]. Our observations cannot explain the function of cytoplasmic FOXC1 in stromal cells within the microenvironments of T and NK cell lymphomas. However, the FOXC1 status in the tumor microenvironment might be indicative of the molecular crosstalk between tumor cells and stromal cells during the regulation of tumor dormancy or activation.
In summary, a decrease in the number of FOXC1+ stromal cells within the microenvironments of T and NK cell lymphomas was found to be associated with the dormant phenotype of tumor cells and poor patient outcome. To the best of our knowledge, this is the first study to provide evidence regarding a putative relationship between FOXC1+ stromal cells and tumor phenotype (dormant or active) in T and NK cell lymphomas. Further investigations are required to elucidate how FOXC1+ stromal cells regulate tumor dormancy or activation within the tumor microenvironment. The modulation of FOXC1 expression in stromal cells within the tumor microenvironment could be utilized as a possible therapeutic strategy to treat aggressive T and NK cell lymphomas, especially with respect to the regulation of tumor dormancy and activation.