INTRODUCTION
The development and progression of cervical tumors is likely to be associated with alterations in apoptosis, cell growth/suppression and disturbances in immune surveillance. The tumor suppressor gene, p53, has been established as an essential component for the suppression of tumor cell growth, and it appears to take part in the regulation of the cell cycle as a transactivator, i.e., it functions as a negative regulator of cell division by controlling a set of genes that's required for this process (1,2). The development of most cancer frequently originates from mutations in the p53 gene (3). p53 mutation is observed in more than 50% of cancer cells. Restoration of the wild-type (wt) p53 or ectopic p53 expression causes the retardation of tumor cell growth in vitro or it causes tumor cells to undergo apoptosis (4). In normal cells, external stimulation, and particularly exposure to damage of the cellular DNA, results in increased levels of p53 expression, which in turn promotes G1 arrest or apoptosis, and apoptosis is a process that's associated with the p21 (5).
Human papilloma viruses (HPV) 16 and 18 have been identified in more than 90% of cervical cancer cases (6). Generally, E6 and E7 oncoproteins are consistently expressed after high-risk HPV infection, and they appear to be essential for the immortalization and transformation of human squamous epithelial cells (7). E6 and E7 proteins form complexes with p53 and Rb, respectively, and they thereby inhibit the activities of these proteins in the cell cycle regulatory systems (8). These selective degradations of tumor suppressor proteins are strategically very important in gene therapy, as the inactivation of p53 and Rb is essential for the induction of cervical carcinoma (9). It has been firmly established that cervical cancer cell lines infected with HPV expressed normal pRB, but they expressed wild type p53 only at low-levels. Trials that have been done regarding the suppression of cancer cell growth via the restoration of the p53 mutation have shown considerable progress. p53-dependent apoptosis has been regarded as a useful strategy for the treatment of human cancer (10). Adenoviral vectors have been used to transfer a specific gene into cells, and this has generated an overwhelming amount of data regarding the mechanisms of p53-mediated inhibition (4, 11). However, this procedure remains far from ideal in the setting of cervical cancer therapy, as the effects of adenoviral vectors may be very differently in humans than in animal models. Recently, it is becoming increasingly uncertain as to whether wide variations exist with regard to the tumorigenic inhibitory effects among different cell types (12). In addition, p53 appears to induce multiple independently regulated apoptotic pathways, depending on the existing physiological circumstances and the cell types. The precise molecular mechanisms underlying p53-mediated apoptosis remain unclear.
Our group has previously reported the differential suppression of human cervical cancer cell growth by adenovirus delivery of p53 in vitro, in which the phase of cell cycle arrest was dependent on the cell line. Another of our studies demonstrated that that recombinant adenovirus-p53 gene transfer showed cell line-specific growth suppression of human cervical cancer cells both in vitro and in vivo. In this current study, we observed the effects of exogenous Adp53 delivery with regard to the suppression of the growth of HPV-associated SiHa cells at both the RNA and protein expression levels, and we additionally compared the levels of protein expression of 6 genes that are associated with cell cycle control, apoptosis and cell cycle arrest after infection with Adp53 in SiHa, CaSki, HeLa and HT3 cells.
MATERIALS AND METHODS
1) Cell lines and culture conditions
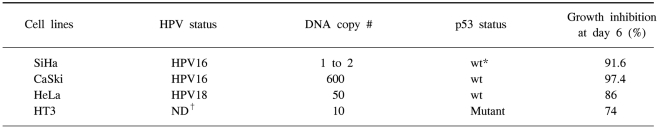
HPV-infected human cervical cancer cell lines, i.e., HPV16-positive SiHa cells (1 to 2 copies per cell), HPV 16-positive CaSki cells (600 copies per cell as well as the sequences related to HPV-18), HPV 18-positive HeLa cells (50 copies per cell), and the HPV-negative HT3 cells that were used as a control were obtained from the cell line bank of the Seoul National University Cancer Research Center (Table 1). These cells were routinely propagated in monolayer cultures in DMEM (GIBCO-BRL, Paisley, Scotland), that was supplemented with 5% fetal bovine serum (FBS), 0.37% sodium bicarbonate, 30 mM HEPES and penicillin/streptomycin. The cells were cultured in a 5% CO2 incubator at 37℃.
2) Recombinant adenoviral vector and titration of the Adp53 viral stock
A recombinant adenoviral vector Adp53 that contained the human wild-type p53 gene was constructed as previously described (13). AdLacZ was generously provided by Dr. Jae-Ho Lee of Seoul National University, Seoul, Korea. The viral titers were determined in the 293 cells by the plaque assay method. Briefly, 293 cells (105 cells/well) were inoculated onto a 12-well plate and then cultured for 24 h. When 90% confluency was achieved, the cells were infected with the recombinant adenovirus. The cell plates were shaken 6 times for 1 h, and 1 ml of DMEM was added at this time. The cell cytopathic effect (CPE) was observed after 12, 24, 26 and 48 hours with using a converted microscope.
3) Western blotting for p53
The cells grown in the 6 well culture dishes (5×10⁵ cells) were transfected with Adp53 at a multiplicity of infection (MOI) of 50. The control cells were mock-infected. The transfected cells were harvested at 2, 4 and 6 days after infection, and then they were lysed. 30 µg of the cell extracts were separated by sodium dodecyl sulfate-polyacrylamide gel electrophoresis (SDS-PAGE), and electroblotted to Hybond-C membranes (Amersham, Uppsala, Sweden). After the transfer was completed, the membranes were stained with Ponceau S (Sigma, Spruce St, St. Louis) to verify equal sample loading. The membrane was blocked with 5% skimmed milk and it was probed with mouse anti-human 53 DO7 (Novocastra, Newcastle, UK), that was directed against p53. These primary antibodies were diluted at 1 mg/ml and then incubated with the membrane for 4 h at room temperature. The bound antibodies were detected with goat anti-mouse IgG antibody conjugated to horseradish peroxidase (Novocastra). After each step, the membrane was washed with Tris-buffered saline with 0.1% Tween-20 (TBST). The protein bands were visualized using an ECL Kit, according to the manufacturer's instructions (Amersham).
4) Viable cell count
Cervical cancer cells were seeded into a 12-well plate at a density of 105 cells per well. DMEM supplemented with 5% FBS was used as the growth medium. The cells were infected with AdLacZ, which used as a negative control, and the culture medium alone was used as the positive control. Each sample was analyzed in triplicate. We performed cell count assays after 6 days of infection with Adp53 or AdLacZ. Cell viability was confirmed by tryphan blue dye exclusion. From analysis of three replicated experiments, the typical measurement deviations were observed to be less than ±3.0 percent for each assay.
5) Cell cycle analysis
Cervical cancer cells (5×10⁵ cells) were infected with adenovirus expressing p53 or LacZ at a multiplicity of infection (MOI) of 50. After 2 days of incubation, the cells were trypsinized and then washed twice with PBS. The cells were stained with annexin V-FITC conjugate for 10 min. The stained cells were then analyzed by FACS (Becton Dickinson, San Jose, CA). In order to determine the DNA contents, the cell debris and fixation artifacts were gated out and the cell populations that were at the G0/G1, S and G2/M stages were quantified using the CellQuest program. The forward and side scatter gates were set to exclude any dead cells from the analysis; at least 10,000 events were collected for each sample.
6) Membrane chip analysis
The total cellular RNA was isolated according to the acid-guanidinium-thiocyanate-phenol chloroform method with using Tri-Reagent (Molecular Research, Inc., Cincinnati, OH). The apoptosis pathway GEArray Q Series Human Cell Cycle Gene Array was obtained from SuperArray Inc. (SuperArray Inc., Frederick, MD). This kit was developed to profile the expression of 96 genes rhat are involved in cell cycle regulation. Cell cycle progression is precisely controlled by cyclin-dependent kinases (CDKs) and also the proteins that regulate the CDKs. These CDKs and CDK-modifying proteins, including cyclins, CDK inhibitors, CDK phosphatases and CDK kinases, are featured in the Human Cell Cycle GEArray Q Series. The genes that are essential for repairing DNA damage and the mitotic spindle checkpoints, as well as the genes in the SCF and APC ubiquitin-conjugation complexes, are also represented (SuperArray Inc.). Briefly, the total RNA from the respective samples was utilized as a template in order to generate cDNA probes with using the GEAprimer mix as a reverse transcriptase primer. The cDNA probes, which represent the abundant mRNA population, were then denatured and hybridization was conducted in GEHybridization solution on two nylon membranes that were spotted with gene-specific cDNA fragments. The membranes were then washed twice with 2×SSC and 1% SDS each time, and this was followed by another washing with 0.1×SSC and 0.5% SDS. The membranes were then exposed to ChemiDoc (BioRad Laboratories, Hercules, CA). The relative expression levels of each gene were then determined using the GEArray Analyzer program (SuperArray Inc.). For each gene, its relative fold change in expression was the ratio of the median expression levels of the sample versus that of the control. Genes were excluded from the analyses if their expression was negative or too smeared. Genes that showed differences in their expression levels of at least 1.5 were selected for function analysis. Measurements were taken on two separated arrays.
7) Changes in the cell cycle regulatory proteins induced by Adp53
The protein expression in the SiHa, CaSki, HeLa, and HT3 cancer cells after infection with the control, Adp53 or AdLacZ at 24 and 48 h were measured by western blot analysis. The remaining procedures were the same as those explained in the materials and methods "western blotting for p53" section, with the exception of our measuring the p53 levels, as well as the p21, CDK4, E2F-1, E2F-4 and PCNA expression levels.
8) Statistical analysis
Statistical analysis was done using ANOVA. Values between the different groups were compared. P values of less than 0.05 were considered significant. All the data shown for the cell cycle analysis experiments and the cell growth inhibition experiments are representative of three independent experiments.
RESULTS
1) Expression of p53 proteins after adenovirus-mediated gene transfer in SiHa cells
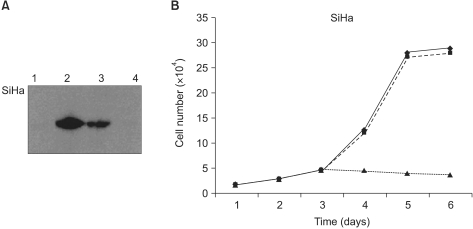
To determine whether the Adp53 vector overexpressed p53 protein in the SiHa cells, western blot analysis was performed after infection with 50 MOI of Adp53 in vitro (Fig. 1A). Our results demonstrated that the exogenous p53 protein expression levels were high on day 2 (lane 2), decreased on day 4 (lane 3), and diminished on day 6 (lane 4). There was no p53 expression in the control cells or in the cells infected with AdLacZ (data not shown).
2) Suppression of cell growth after Adp53 infection in SiHa cells
To evaluate the anticancer effect of the exogenous wild-type p53 expression, the degree of cell growth inhibition was also assessed by cell count assay over increasing time, and this showed significant increases in cell growth inhibition over time. Unlike the Adp53-infected group, cells infected with AdLacZ exhibited increased cell growth in a manner similar to that of the control group. As shown in Fig. 1B, the inhibition of cell growth as the result of exogenous Adp53 infection was ~92% in the SiHa cells on day 6, as compared to the control cells or the cells infected with AdLacZ.
3) p53 controlled the expression levels of several transcripts at 24 and 48 h in the SiHa cells
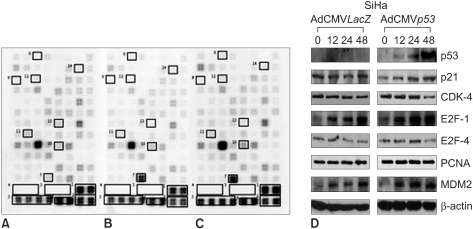
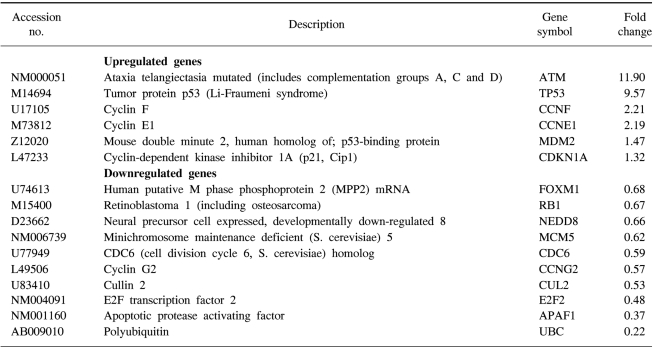
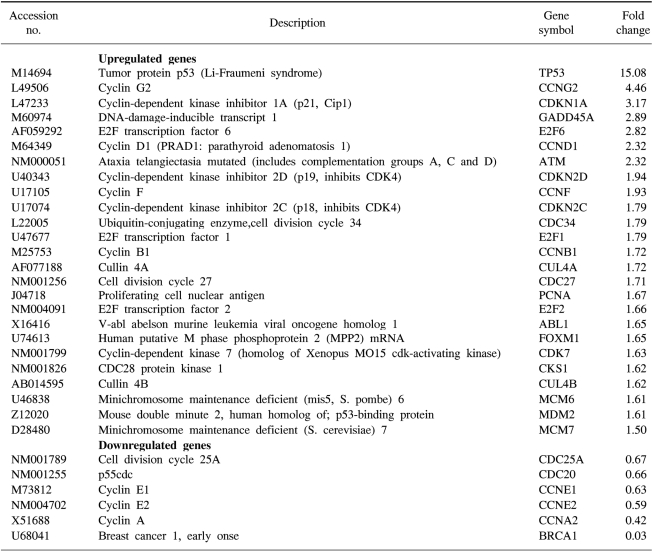
We confirmed that exogenous Adp53 infection exerted cell growth inhibitory effects in the four cancer cell lines. Next, we attempted to determine which molecules that are responsible for the p53 anticancer function changed after exogenous Adp53 infection in the SiHa cells. Therefore, we evaluated the roles of the molecules that were responsible for p53 function; the changes in the levels of transcripts regulated by p53 were studied by microarray analysis after the cervical cancer cells were transfected with Adp53. The gene expression profiles of the SiHa cells at 24 h (B) and 48 h (C) after Adp53 infection, as well as that of the control (A), which was not infected by Adp53, are shown in Fig. 2. The selected hybridization signals refer to the controls or they are examples of the differentially expressed genes. These are as follows: 1, human housekeeping genes (GAPDH); 2, human housekeeping genes (ACTB); 3, blank; 4, negative control (PUC18); 5, positive control (PPIA); 6, positive control (RPL13A); 7, TP53; 8, ATM; 9, CCNF; 10, MDM2; 11, FOXM1; 12, CCNG2; 13, E2F2 and 14, CCNE1. As expected, AdLacZ infection did not induce p53 expression; however, several transcripts were up-regulated or down-regulated after Adp53 infection in the SiHa cells. In particular, the expression profiles were more prominent at 48 h than those at 24 h. The ATM, CCNF, TP53, CCNE1, CDKNIA and MDM2 transcript levels were found to be up-regulated after 24 h of exogenous Adp53 infection. RB1, NEDD8, MCM5, CDC6, CUL2, APAF1 and UBC were found to be only down-regulated, and there was an increase in the p53 protein after 24 h. By way of contrast, CDC25A, CDC20, CCNE2, CCNA2 and BRCA1 were shown to be only down-regulated with only an increase in the p53 protein. The transcripts that were up-regulated with an only increase in p53 at 48 h were CDKN1A, and GADD45A (Table 2, 3).
4) p53 controlled the expression levels of several proteins at 24 and 48 h
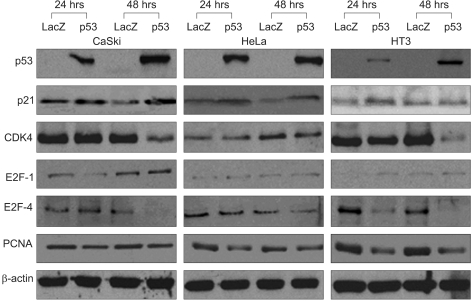
In order to determine the expression levels of the proteins associated with cell cycle control, western blot analyses were performed at 24 and 48 h with various cervical cancer cells, including the SiHa cells that were initially transfected by Adp 53 at a MOI of 50, as shown in Fig. 2D and Fig. 3. p53 proteins were highly expressed after infection, but the p21 protein expression increased only slightly. The CDK4 expression level was high after 24 h of infection, but then it showed decreased expression levels at 48 h. The E2F-1 expression after infection increased in the SiHa cells. E2F-4 achieved maximal levels at 24 h, and it began to decrease at 48 h in the SiHa cells. PCNA was also detected, but the level of this protein was determined to be unchanged upon Adp53 infection in the SiHa cells.
5) Exogenous p53 induced both apoptosis and cell cycle arrest in the G1 or G2 phase
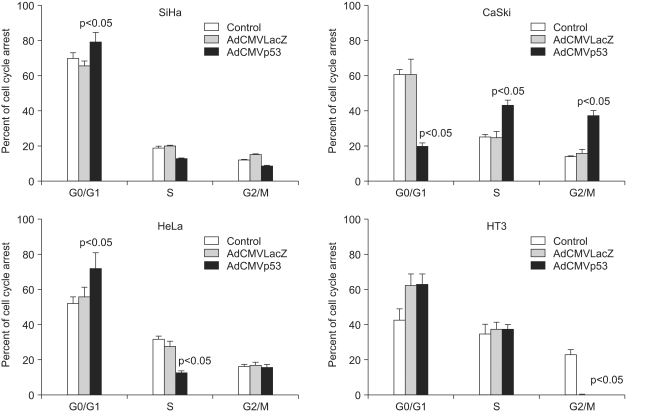
To determine the manner in which the cell decides on p53-dependent apoptosis or cell cycle arrest, we infected cells with Adp53 at a MOI of 50, and we then performed annexin V and/or propidium iodide staining. As shown in Fig. 4, cell cycle arrest was analyzed by flow cytometric analysis. When the SiHa, CaSki, HeLa, and HT3 cells were infected with Adp53, a significant alteration in the cell cycle progression of these cells was detected. The percentages of SiHa, HeLa and HT3 cells in the G1 phase increased to 79.3%, 72.1% and 63.2%, respectively, indicating that the cell cycle was arrested at the G1 phase by Adp53 delivery in the three cell lines. The hypodiploid (sub-G1) peak resulting from DNA fragmentation, which represents apoptotic cells, was undetectable in this assay. However, the CaSki cells exhibited different cell cycle arrest patterns with increases in the proportion of cells in the S and G2/M phases. In contrast, there was normal cell cycle progression in the CaSki control or in the cells infected with AdLacZ as compared to the other cell lines. These data suggest that the exogenous p53 expression induced cell cycle arrest in the G1 phase in the SiHa, HeLa and HT3 cells, as well as cell cycle arrest in the S and G2/M phases in the CaSki cells.
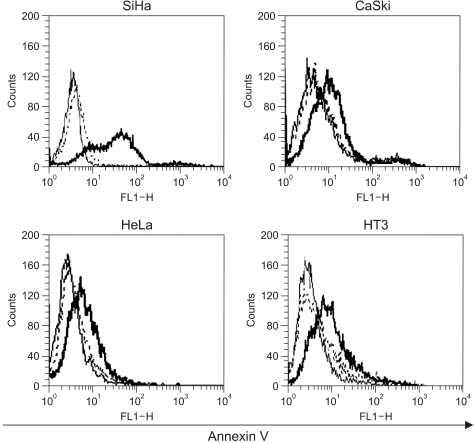
As shown in Fig. 5, the results indicated that 48 h after infection with Adp53, a large increase occurred in the proportion of SiHa cells stained with annexin V, thereby suggesting that exogenous p53 overexpression induced apoptosis in the SiHa cells. However, p53-induced apoptosis in the CaSki, HeLa and HT3 cell lines increased slightly as compared to that in the control.
DISCUSSION
Our group has previously reported the differential suppression of human cervical cancer cell growth by adenovirus delivery of p53 in vitro and that the phase of cell cycle arrest was dependent on the cell line. In particular, the cell cycle was arrested in the G2/M phase in CaSki cells; in contrast, the cell cycle was arrested in the G1 phase in the SiHa and HeLa cells (14). Another of our studies showed that recombinant adenovirus-p53 gene transfer induced cell line-specific growth suppression on human cervical cancer cells in vitro and in vivo (15). However, there have been no studies of the genes associated with regulation of the cell cycle in the HPV-associated cervical cancer cells by performing microarray and then making direct comparison among different cell lines. Therefore, in this study, we observed the effects of exogenous Adp53 delivery at both the RNA and protein levels with regard to the suppression of the growth of SiHa cells.
The study initially showed that the expression of p53 protein in the SiHa cells after infection with adenovirus p53 was highly maintained till day 2 and it was decreased at day 4, and then it diminished at day 6 (Fig. 1A). p53 transcripts were expressed for 4 days with no cleaved fragments of p53 in the SiHa cells in vitro. The expression levels of p53 proteins in the SiHa cells were similar than those in the HeLa cells with same MOI infection. The HPV-negative control cell line, i.e., the HT3 cells, showed continuously elevated p53 levels till day 6; this suggested that the gene was potentially mutated in this cell line because the mutated forms of p53 often have an extended half-life and they are found at higher steady state levels (16).
In order to provide some insights into the some of the molecular mechanisms involved in p53-dependent cell growth suppression, microarray analysis was performed after exogenous Adp53 infection into the SiHa cells. Many of the genes that are down-regulated by Adp53 are genes that encode for proteins involved in various cell cycle-check points, as well as repair of DNA damage. Changes in the RNA levels of the cell cycle regulators, as well as the CDKs, following Adp53 infection revealed that the p53, p21 and mdm2 genes were continuously up-regulated at 24 and 48 h. There were no genes that were continually down-regulated at 24 and 48 h after treatment. These results allowed the simultaneous, quantitative measurement of the expression of many genes induced by Adp53 delivery.
In addition to our microarray data, we also determined the p53, p21, CDK4, E2F, and PCNA protein levels after Adp53 treatment. We performed western blot analyses of the SiHa cell line, and the results from these analyses were compared to those from the CaSki and HeLa cells. It demonstrated that the p53 and p21 levels were significantly increased after Adp53 infection, and the expression patterns of the p53 and p21 proteins in the CaSki and HeLa cells were similar to that of the SiHa cells. Therefore, Adp53 gene transfer has an antitumor effect on HPV-associated cervical cancer.
pRB that's hypophosphorylated by CDK4 has been determined to bind and inhibit the activity of the transcription factors belonging to the E2F family, and this appeared to be primarily responsible for subsequent growth arrest (17). In our study, the CDK4 levels were reduced in the control and cancer cells 48 h after Adp53 infection, and this was also consistent with the previous report (17). We observed that CDK4 protein in the SiHa cells was increased at 24 h of infection; then it decreased at 48 h of infection, the same as the expression pattern exhibited in the CaSki and HT3 cells. CDK4 is activated early in G1 and it blocks active repression by Rb through phosphorylation of the C-terminal region of Rb. Thus, CDK4 is not important for the p53-dependent apoptosis in cervical cancer cells.
On the other hand, Adp53 downregulated Rb at the gene level for 24 hr. Rb has been reported to be able to control the G1/S transition and it functions as a transcription suppressor. The Rb protein can bind normally to the transcription factors of the E2F family until it is phosphorylated by the CDK4/cyclin D complex at the restriction point in the late G1 phase. Phosphorylated pRb is unable to interact with E2F; therefore, the non-sequestered transcription factor can permit the G1/S transition. As a Adp53-dependent pathway, it seems that there is no connection between Adp53 and Rb. In this study, the Rb expression level was lowered upon Adp53 treatment.
The transcription factor E2F plays a critical role in the transition from G1 to S. The ectopic expression of E2F-1, which was the first member of the E2F family to be identified, is sufficient to cause quiescent cells to enter the S phase. The E2F-pRb protein complex might be involved in the inhibition of cell cycle progression. The integration of E2F-1 signaling and the activation of the Atm/Chk2/p53 pathway also provide possible mechanisms for the proposed involvement of E2F-1 in the apoptosis induced by DNA damage (18). In this study, the E2F-1 levels were clearly increased in the CaSki cells at 48 h of infection, and the SiHa and HeLa cells both exhibited only minor induction. The E2F-4 protein expression pattern in the CaSki and HeLa cells was quite similar to that of the SiHa cells, whereas the HT3 cell lines exhibited an unchanged expression. The E2F-1 protein was up-regulated in the absence of p53 accumulation in the SiHa cells, (see Fig. 2D and Fig. 3) and so this warrants further study (19, 20). Proliferating cell nuclear antigen (PCNA) is a 36-kDa, acidic, non-histone, nuclear protein, and its expression is associated with the late G1 and S phases of the cell cycle. PCNA can be used as an immunohistochemical marker for proliferating cells (21). The PCNA levels have been determined to be correlated with the proliferative activity and the prognosis of patients with head and neck tumors. In this study, the PCNA gene was expressed in the SiHa cells, but the levels of PCNA proteins were significantly downregulated in the CaSki, HeLa and HT3 cells after Adp53 infection. Thus, PCNA is important for Adp53-dependent apoptosis in cervical cancer cells. Taken together, the western blot analysis of p53 protein that acts against the cell cycle regulatory genes demonstrated that exogenous infection of Adp53 in cancer cells was significantly different from the other HPV-associated cervical cancer cells.
We then compared the relationship of apoptosis and cell cycle arrest in the SiHa, CaSki, and HeLa cells after infection with Adp53. A significant level of programmed cell death was exhibited by the SiHa cells, as compared to the CaSki and HeLa cells, and this was determined by annexin V staining (Fig. 5). In the HPV 16-infected cells and the HPV 18-infected cells, exogenous p53 overexpression may induce E6 exhaustion and subsequently promote cell growth inhibition. It has been reported that the anticancer effects take place via exogenous p53-mediated apoptosis, as the higher cellular p53 levels direct the cell through a pathway that leads to apoptosis; otherwise, cells progress through a pathway that results in growth arrest at lower levels of p53 expression (22). In addition, it was proposed that the genetics of the cell determine whether the cell enters growth arrest and apoptosis (5). The exogenous p53 expression is directly related to the inhibition of NF-κB activity, which is in turn associated with the prevention of apoptosis (23). Apoptotic protease activating factor-1 (APAF-1) plays an important role in p53-mediated apoptosis as a p53 downstream effector, as was confirmed by cDNA microarray (24).
To successfully treat cervical cancer that originates from a high-risk HPV infection, it is important to understand the specific molecular-level mechanisms of growth suppression that are associated with adenoviral delivery of p53. The results of our study will serve as a foundation for conducting further research on this subject.
CONCLUSIONS
We observed that the adenovirus delivery of the wild-type p53 gene exerted a significant effect on the suppression of cervical cancer cell growth via apoptosis or cell cycle arrest. The mechanism by which p53 inhibited the SiHa, HeLa and HT3 cancer cell growth appears to be related to the arrest of the cell in the G1 phase of the cell cycle. The continual expression of p21 suggests that p53 might act in the same way in the HPV-infected cervical cancer cell lines, and so this facilitates apoptosis in the SiHa, HeLa and HT3 cells after Adp53 infection. The expression levels of the p53-target genes exhibited significant differences with regard to the cell cycle machinery and control mechanisms. The gene expression profiles that are involved in apoptosis should be further studied by microarray analysis with using a variety of cell lines. These data support the notion that gaining understanding of p53-dependent apoptosis and cell growth arrest could be applicable to creating advanced strategies for preferential tumor cell-specific gene delivery.