Introduction
Hepatocellular carcinoma (HCC) is the fifth most common tumor worldwide and the third most common cause of cancer death, especially in Asia. Hepatitis B virus (HBV) was the most common cause of HCC [1]. Despite the surveillance programs to diagnose early liver tumors in cirrhotic patients, most HCCs are currently diagnosed at advanced stages. Based on Chinese specific national conditions and practical experience, the following HCC staging scheme is recommended, including stage Ia, Ib, IIa, IIb, IIIa, IIIb, and IV. Stage IIb is defined as tumor numbers ≥ 4 without extrahepatic metastasis or vascular invasion. Stage IIIa is defined as tumors with vascular invasion and without extrahepatic metastasis. All stage IIb or IIIa patients have Child-Pugh class A or B and performance status (PS) 0-2. In China, transcatheter arterial chemoembolization (TACE) is an approved first-line therapy for stage IIb or IIIa patients [2,3].
Response rates to TACE are heterogeneous. Age, liver function, α-fetoprotein, tumorlocation, tumor size, and tumor number are the reported risk factors for TACE therapy in patients with HCC [4,5]. According to JSH-LCSGJ Criteria 2014 Update, these patients who cannot benefit from ≥ 2 TACE therapy were considered as TACE failure/refractoriness. TACE failure/refractoriness is defined as insufficient response including intrahepatic lesion (viable lesion of > 50% or tumor number increases as compared to tumor number before the previous TACE procedure), continuous elevation of tumor markers, appearance of vascular invasion or extrahepatic spread after two or more consecutive use of superselective TACE [6]. However, survival may vary widely among patients with HCC with similar clinicopathologic features. Then, more accurate predictors should be identified to discriminate patients who will benefit from TACE therapy from those with TACE failure/refractoriness.
Genetic profiling, to date, has revealed broad diversity as regards recurrent genomic alterations in HCC. Moreover, a large number of samples have provided an accurate landscape of genetic alterations and biomarkers [7]. It was reported that TP53 and CTNNB1 can affect 25-30% of HCC. For example, mutated genes affect the cell cycle (TP53), WNT signaling (CTNNB1 and AXIN1) or chromatin remodeling (ARID1A and ARID2) [8]. Besides, mutated driver genes, for example, JAK1, MYC, NOTCH, BRCA, PTEN, SOX2, FGF3, and RB1, may be related with HCC prognosis. As most genomic studies had been conducted in early HCC and almost all samples were obtained through liver resection, only one study depicted the genetic determinants of HCCs from early stages to advanced stages [9]. However, how genes affected the tumor response of patients treated with TACE remains unknown.
Therefore, this study aimed to investigate and analyze the clinicopathologic features and mutational landscape of HBV-related advanced HCC undergoing TACE, which will help design more comprehensive biomarkers to guide clinical practice.
Materials and Methods
1. Patients and tumor samples
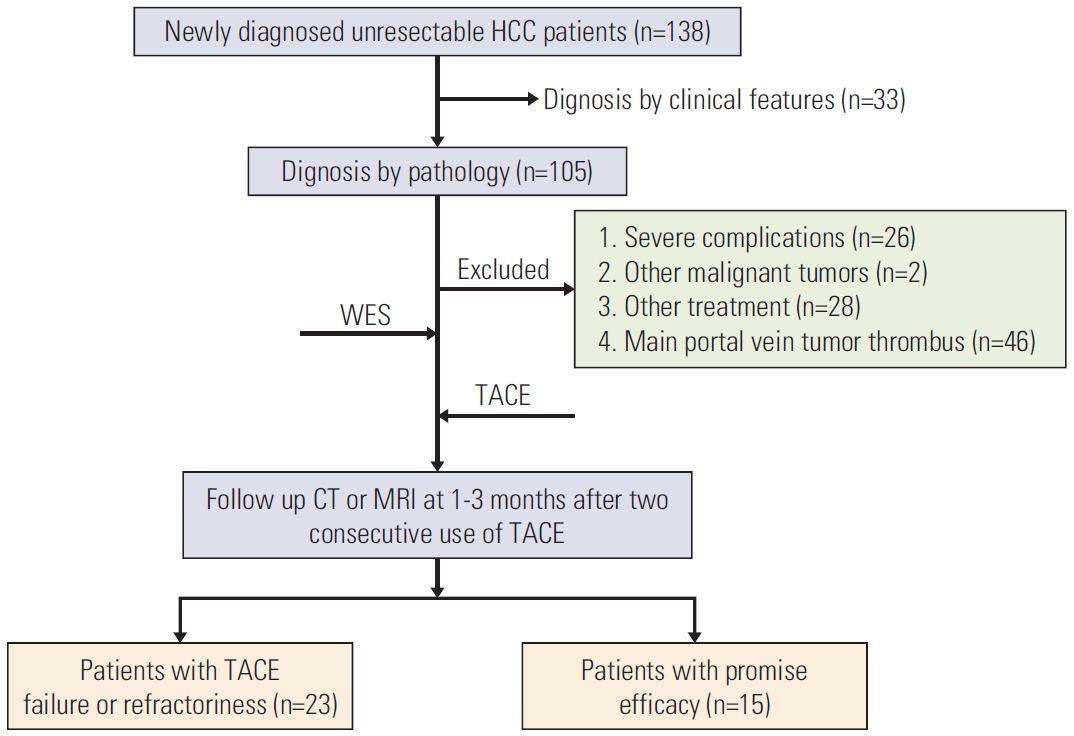
A total of 138 patients newly diagnosed with unresectable HCC admitted to The First Affiliated Hospital, Sun Yat-sen University, Guangzhou, China, between January 2017 and December 2018 were recruited. HCC was diagnosed based on histological criteria according to the Chinese standard treatment for HCC in 2017 [3]. All patients were included in our study if they (1) underwent TACE as the first treatment, (2) were 18-75 years, (3) were classified as IIb or IIIa according to Chinese standard treatment for HCC in 2017 [3], (4) had Eastern Cooperative Oncology Group (ECOG) PS of 0 or 1, (5) had Child-Pugh class A or B, and (6) had history of HBV infection. Patients were excluded if they (1) had serious medical comorbidities, such as hepatic encephalopathy, uncontrolled ascites, severe coagulation disorders, current infection and serious heart or kidney dysfunction (i.e., total bilirubin, > 100 μmol/L; prothrombin activity, < 40%; or platelet count, < 20×109/L), (2) currently had other malignancies or history of other malignancies, (3) had undergone other treatments before (i.e., liver resection, liver transplantation, radiofrequency ablation, targeted drugs, or immune checkpoint inhibitors), (4) had major portal vein tumor thrombosis or extrahepatic metastasis, (5) had history of hepatitis C virus infection, alcoholism, or other etiologies. All samples were obtained by computed tomography (CT)–guided puncture biopsy and were immediately frozen in liquid nitrogen and stored at –80°C before the extraction. Then, their global gene expression pattern was analyzed using whole-exome sequencing (WES) from 38 HBV-related advanced patients.
2. WES analysis
In this study, total exosomes from 38 HBV-related advanced HCC tumor tissues were sequenced. SureSelect Human All Exome Kit V5 (Agilent Technologies, Santa Clara, CA) was used to fragment and hybridize DNA which contained 27,000 exon sequences. Exome shotgun libraries were sequenced on Illumina Xten platforms, generating 150 bp paired reads at each end. Imaging analysis and baseline calls were made using CAVSAVR (Illumina, San Diego, CA) with default parameters. Sequencing adapters and low quality reads were removed for high quality reads. The genes were compared with NCBI human reference genome hg19 using the Burrows Wheeler alignment algorithm.
3. TACE procedure
TACE procedures were performed by two of three experienced interventional radiologists (W.F., Y.W., and J.L.). Hepatic angiography was performed by placing a 5-F catheter (Terumo, Tokyo, Japan) or a 2.7-F microcatheter (Renegade Hi-Flo Straight, Boston Scientific, Natick, MA; Progreat, Terumo) as superselectively as possible into tumor-feeding arteries. An emulsion of 5-20 mL lipiodol (Lipiodol, Guerbet, Aulnay-Sous-Bois, France) or drug-loaded microspheres (DC-Bead [DCB], SciClone, Shanghai, China) and 20-80 mg of epirubicin (Pharmorubicin, Pfizer, New York, NY) were administered into feeder vessels. Then, 350-560-mm absorbable gelatin sponge particles (Gelfoam, Hangzhou Pharmaceutical, Hangzhou, China) were administered into tumor-feeding vessels. Particle size of DCB microspheres were selected according to angiogr-aphic blood flow velocity. After embolization, angiography of the feeding artery was performed to determine the extent of vascular occlusion. If reflux occurred, the use of lipiodol, DCB microspheres, or absorbable gelatin sponge particles will be discontinued.
4. Evaluation of TACE response
In our study, TACE failure/refractoriness is defined as insufficient response including intrahepatic lesion (viable lesion of > 50% or tumor number increases as compared to tumor number before the previous TACE procedure), continuous elevation of tumor markers, progression of vascular invasion, or appearance of extrahepatic spread after two consecutive use of superselective lipiodol or DCB TACE [9]. Tumor assessment was performed at 1-3 months using CT or magnetic resonance scan after two conecutive use of TACE. Group A patients were included when TACE failure/refractoriness occurred at 1-3 months. Other patients were automatically entered into group B and considered effectively treated with TACE therapy.
5. Statistical analyses
All statistical analyses were performed using SPSS software ver. 24.0 (IBM Corp., Armonk, NY) and Graphpad Prism 7 software (GraphPad Software Inc., San Diego, CA). Proportions were compared using the Fisher exact chi-square test (the total number of cases, < 40) or Pearson’s chi-squared test (total number of cases, ≥ 40). Univariate and multivariate analysis were performed using the bivariate Logistic regression model. All statistical tests were two-tailed, and p < 0.05 indicated a significant difference.
6. Ethical statement
All study protocols were conducted according to the ethical guidelines of the “World Medical Association Declaration of Helsinki-Ethical Principles for Medical Research Involving Human Subjects.” This study was approved by the Institutional Review Board of the Research Institute and Hospital National Cancer Center (IRB No. [2018] 43). This study was approved by the institutional review board of The First Affiliated Hospital, Sun Yat-sen University. All patients provided written informed consent.
Results
1. Study population and HCC characteristics at baseline
A total of 38 patients with HBV-related advanced HCC were enrolled and clearly diagnosed by pathological biopsy in this study (Fig. 1), with demographic, clinical, and tumor staging features depicted in Table 1. There was no difference of histologic criteria between China and the World Health Organization. Among them, 37 patients were men (97.4%); seven (38.9%) had Child-Pugh class B; more than half of patients had vascular invasion (57.9%) and two or more lesions (77.8%); and eight (44.4%) had a maximum tumor size of > 5 cm (Table 1, Fig. 1).
2. Overview of genetic alterations in 38 patients with HBV-related advanced HCC
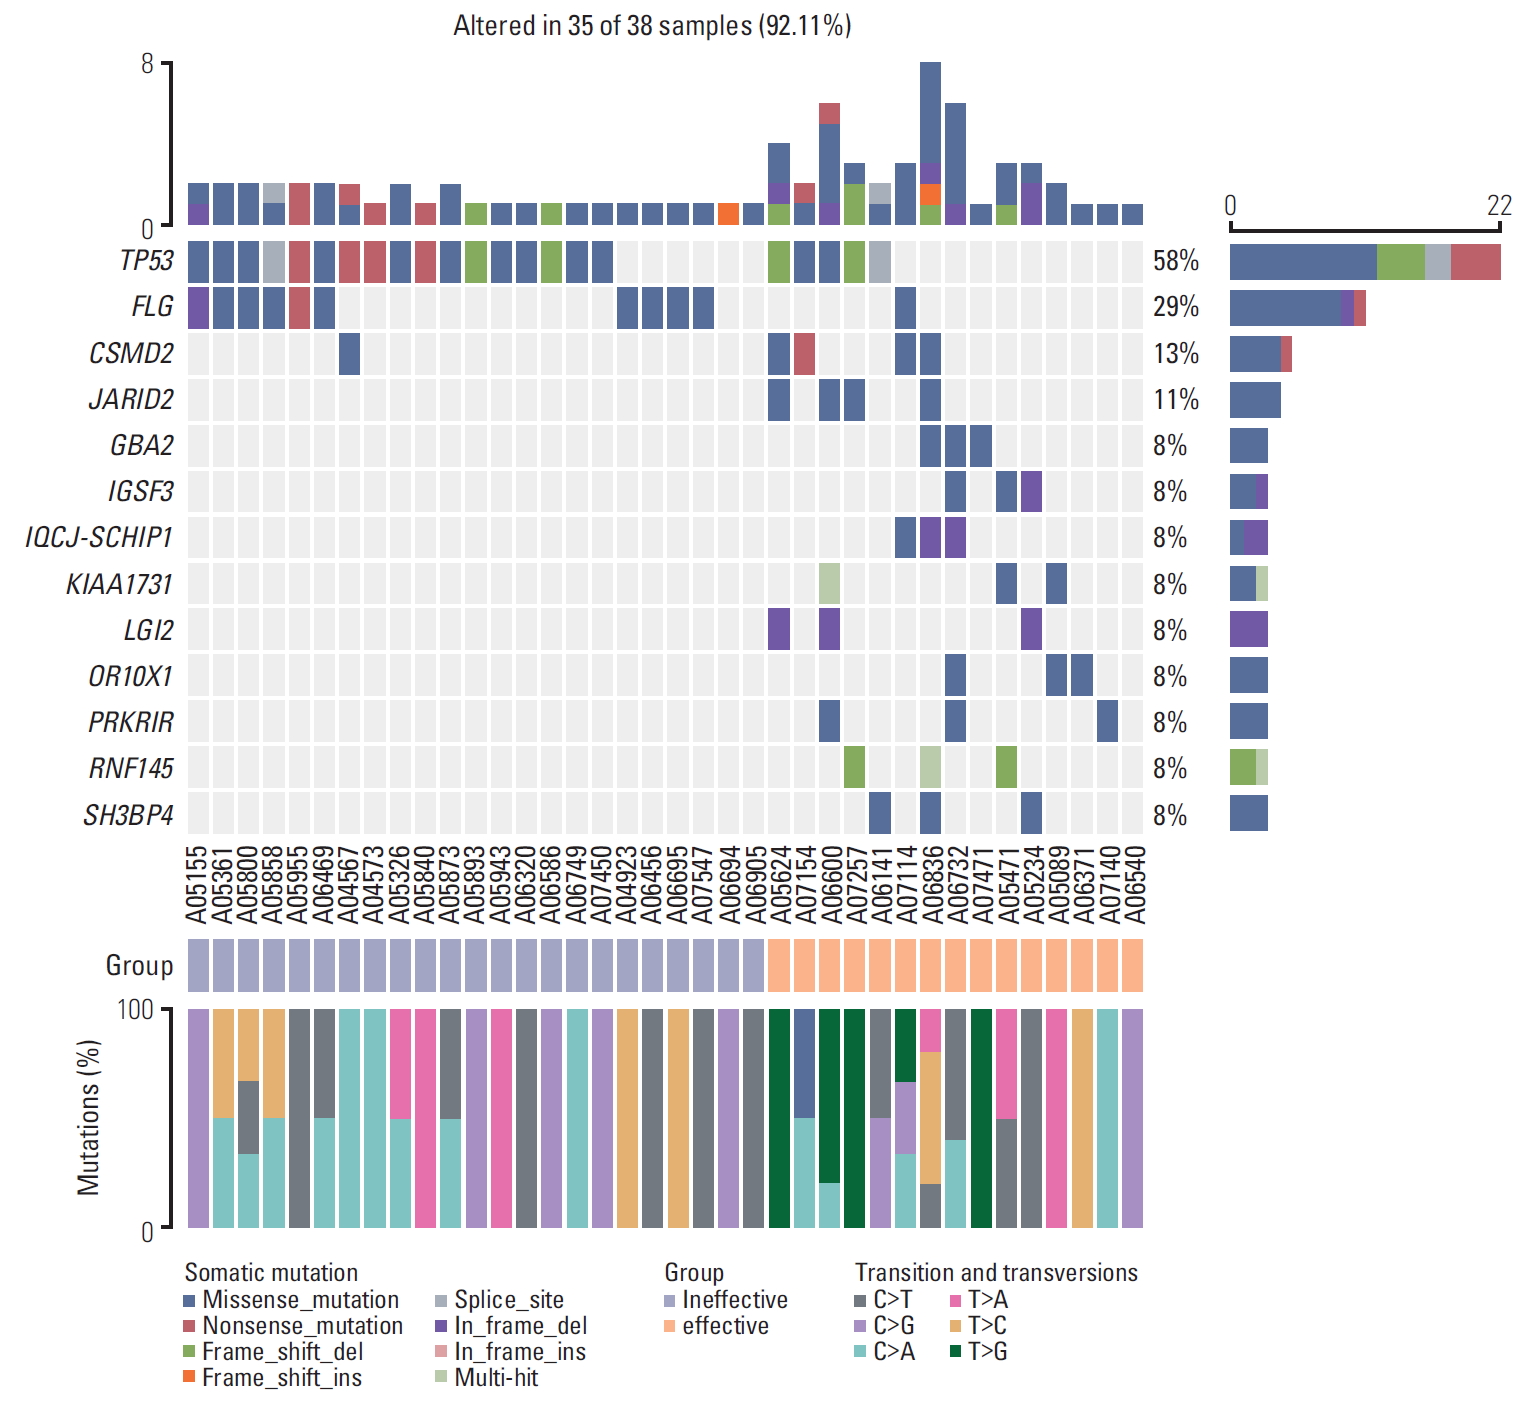
Results of gene mutations were obtained from all 38 patients using the WES technique. A total of 186 potential driver genes were screened. The most significantly mutated genes are as follows: two genes that have been previously established to be mutated in HCC (TP53, CTNNB1) and four genes known to be frequently mutated in other cancer types (MYC, JAK1, FGF, and BRCA) (Table 2). Among them, TP53 had the highest prevalence of altering mutations identified in our study (22/38, 57.9%) (Fig. 2), which was consistent with that of previous studies.
3. Significant mutated genes and clinical features between different response groups
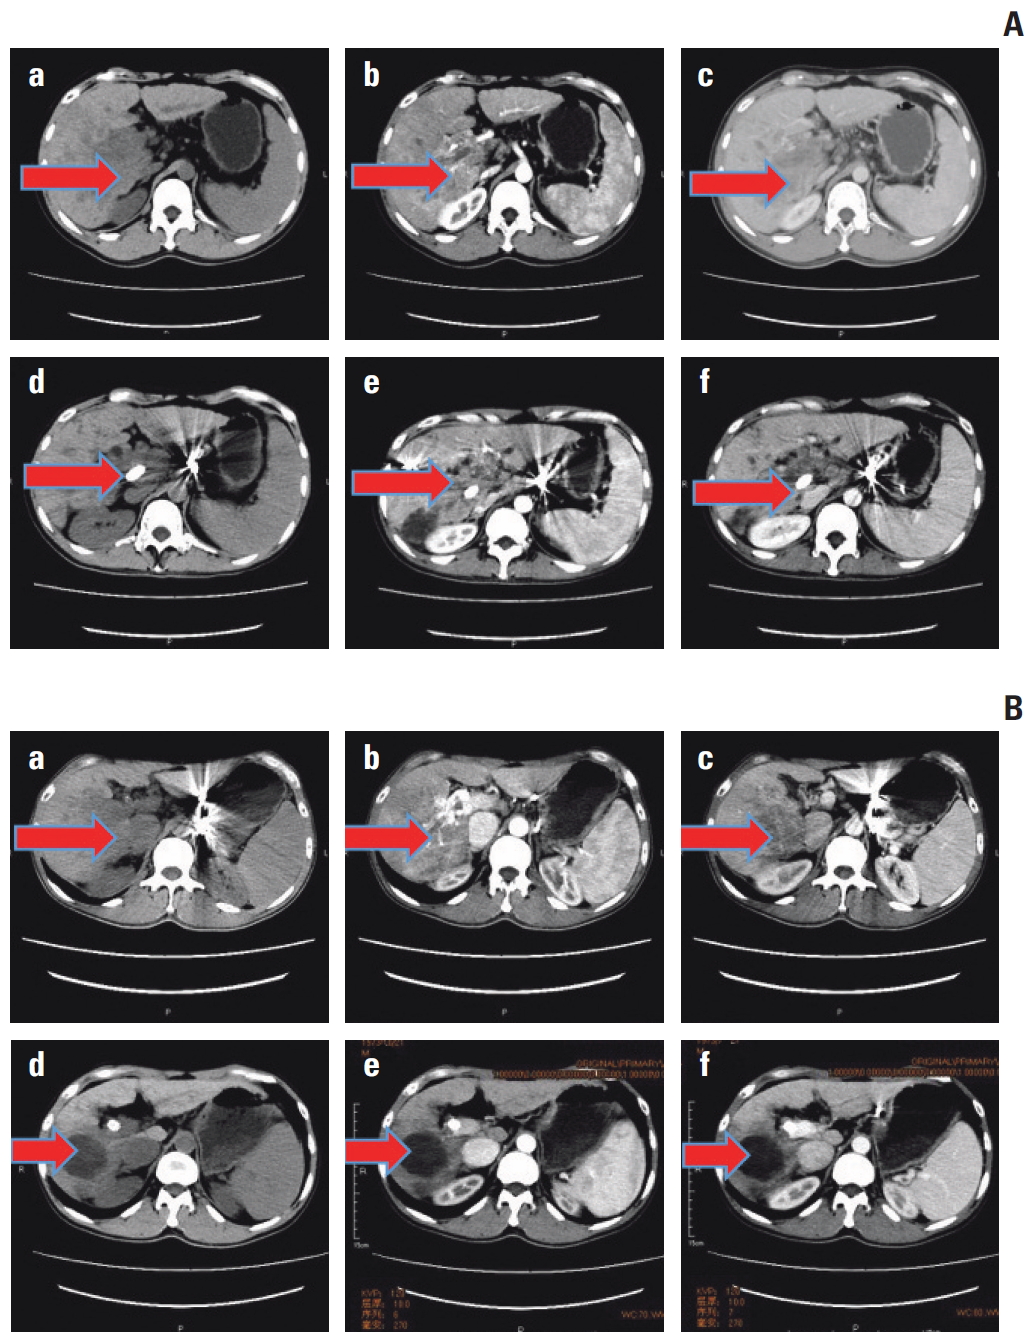
According to the criterion mentioned above, 23 patients were entered into group A and considered TACE failure/refractoriness, whereas other 15 patients belonged to group B and they could benefit from TACE therapy. Between the two groups, TP53 mutation was the only driver gene significantly different in our study (p=0.020) (Table 3, Fig. 2). In particular, mutation frequency of hotspot R249S was higher in group A than group B. But no significant difference was shown in hotpot mutations such as R249S (p=0.371), G59V E68*, R65*, W146*, V157F, E171*, E221 Rfs*25, C229Yfs*10, M246V (Fig. 3A and B). Moreover, increased gene expression in group A was observed for FLG (6/23 samples) as compared with group B. Meanwhile, increased gene expression in group B was observed for CSMD2 (4/15 samples), JARID2 (4/15), GBA2 (3/15), IGSF3 (3/15), IQCJ-SCHIP1 (3/15), KIAA1731 (3/15), LGI2 (3/15), OR10X1 (3/15), PRKRIR (3/15), RNF145 (3/15), and SH3BP4 (3/15) (Fig. 2). With regard to clinical characteristics, we found that vascular invasion, aspartate transaminase, Child-Pugh class, and ECOG PS were significantly higherin group A than that group B (Table 4).
4. TP53 mutation and vascular invasion as predictive factors for TACE failure/refractoriness
Univariate analysis showed that Child-Pugh class (odds ratio [OR], 15.273; 95% confidence interval [CI], 1.714 to 136.126; p=0.015), ECOG PS score (OR, 0.145; 95% CI, 0.031 to 0.677; p=0.014), vascular invasion (OR, 19.000; 95% CI, 3.604 to 100.154; p=0.001), TP53 mutation (OR, 5.667, 95% CI, 1.369 to 23.462; p=0.017) were significantly correlated with TACE failure/refractoriness. On multivariate analysis, vascular invasion (OR, 18.204, 95% CI, 1.392 to 238.090; p=0.027) and TP53 mutation (OR, 13.287, 95% CI, 1.114 to 158.451; p=0.041) were significantly correlated with TACE failure/refractoriness (Table 5, Fig. 4). Then, we did subgroup analysis depending on presence or absence of vascular invasion. Of the 16 patients without vascular invasion, eight (50.0%) had TP53 mutations, and TP53 mutation was associated with TACE failure/refractoriness (p=0.041). Of the 22 patients with vascular invasion, 14 (63.6%) had TP53 mutations, and there was no correlation between TP53 mutation and TACE failure/refractoriness (p=0.386) (Table 6).
5. Frequently altered cancer pathways related to TP53 mutation status
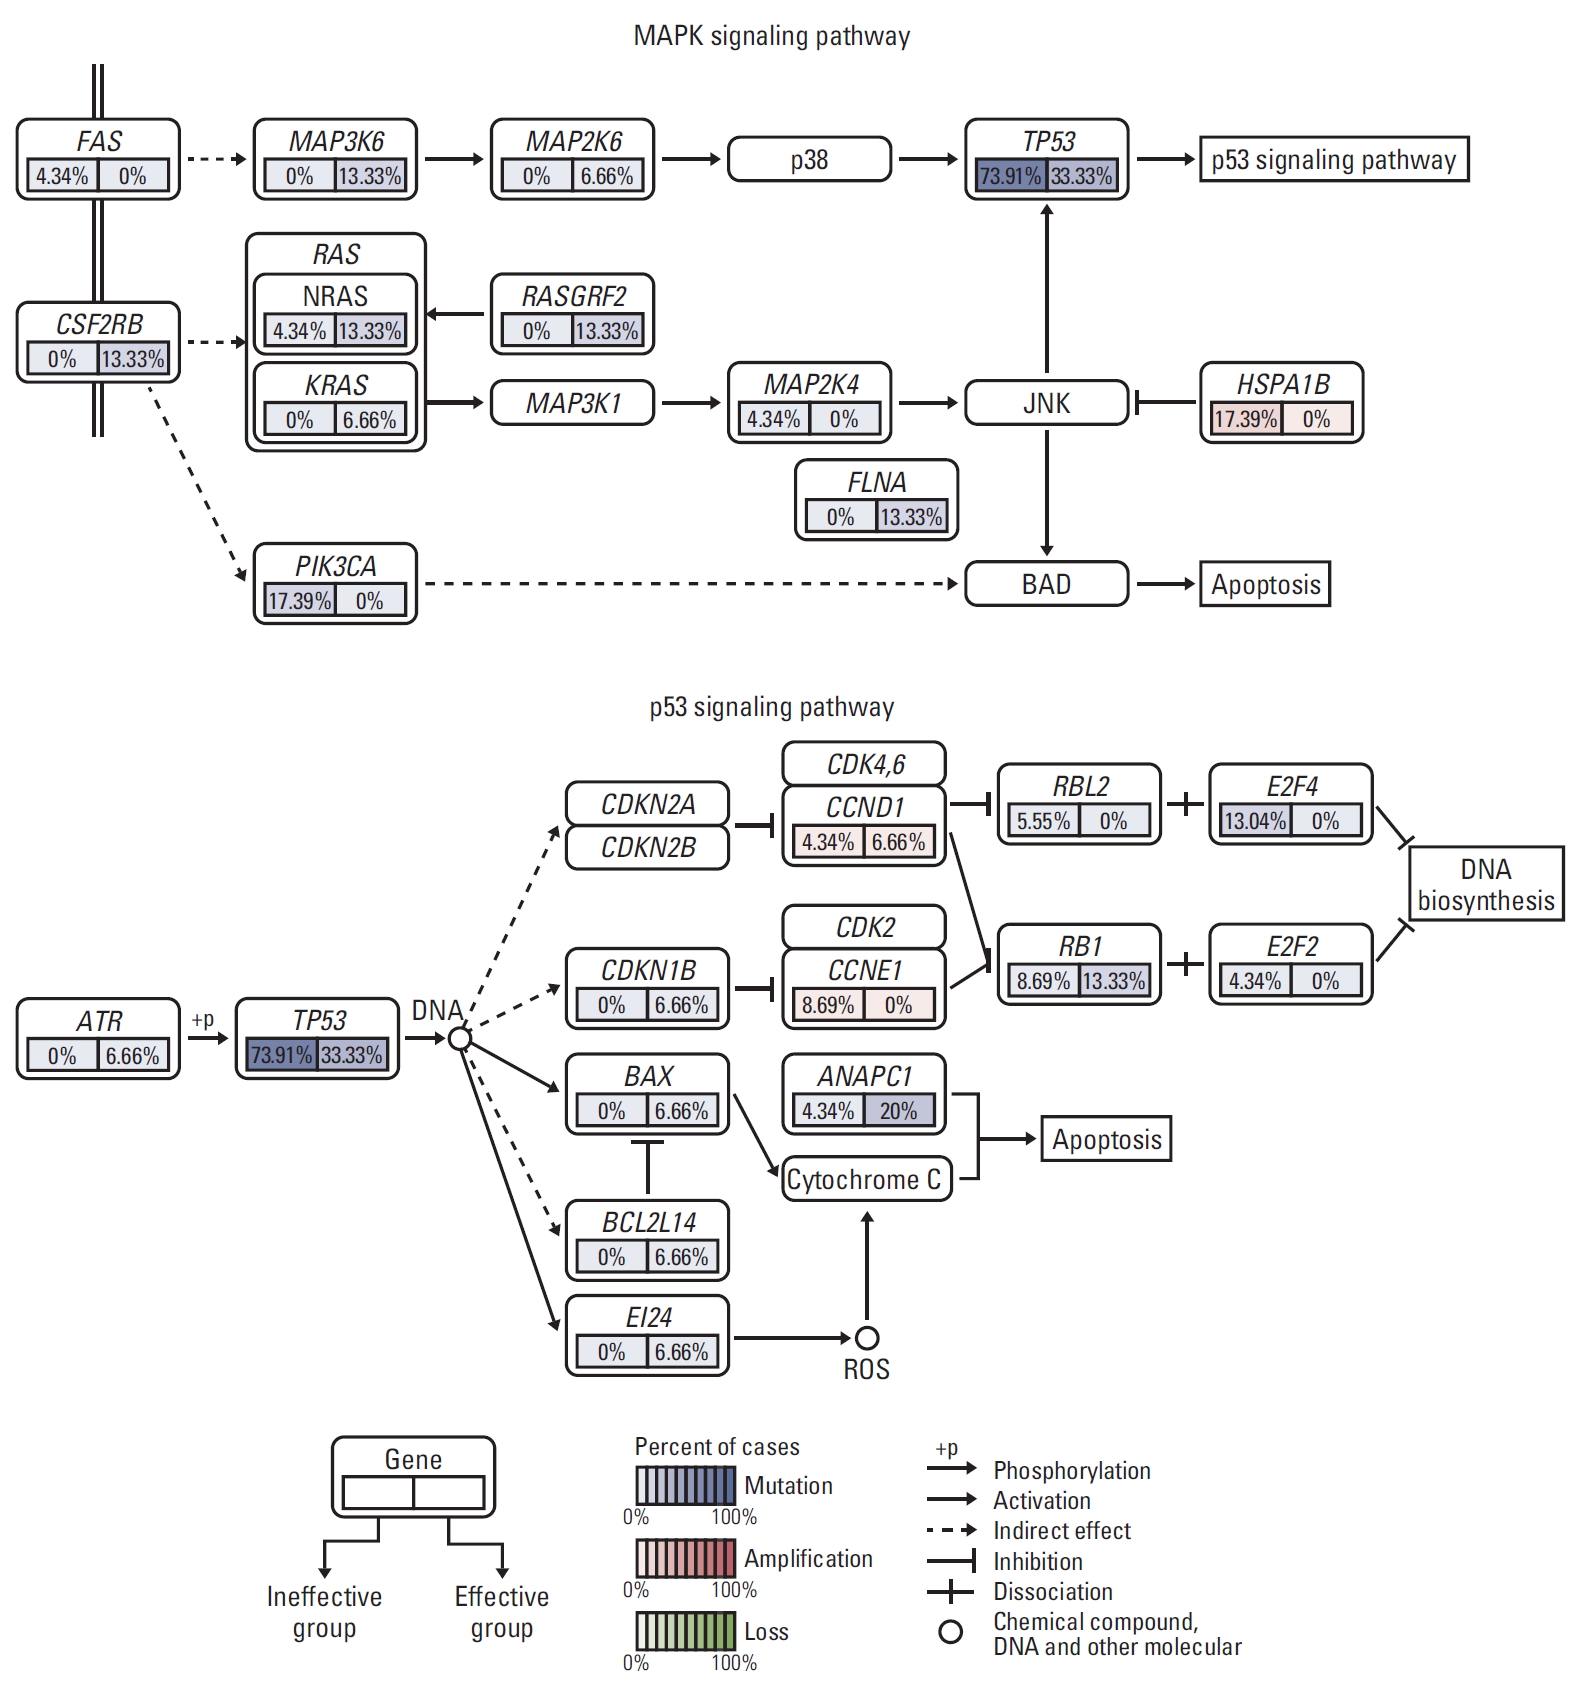
Then, pathway enrichment analyses of genes harboring somatic single nucleotide polymorphism or copy number variations were performed using the gene set enrichment analysis (GSEA) technique from MsigDB for TP53 mutation. Frequent alterations across multiple pathways, including Wnt, JAK/STAT, G1/S cell cycle, mitogen-activated protein kinase (MAPK), and apoptosis were identified. MAPK and apoptosis pathway were found to drive TACE failure/refractoriness. MAPK signaling pathway included TP53, FAS, NFATC4, HSPA1B, FLNA, and RASGRF2 mutation, whereas apoptosis signaling pathway included TP53, FAS, PIK3CA, and CSF-2RB mutation. Among them, PIK3CA and HSPA1B were detected in 17.39% of patients in group A and 0% in group B. They induced the activation of BAD by promoting apoptosis. DNA biosynthesis was observed in group A, with E2F4 mutated in 13.04% and E2F2 in 4.34% of patients (Fig. 5).
Discussion
To our knowledge, few data are available regarding the genetic mechanism of TACE failure/refractoriness for HBV-related advanced HCC. This study is the first report to describe the correlations between TACE failure/refractoriness and genetic alteration in HBV-related advanced HCC.
This study found that TP53 had the highest frequency (57.9%) of mutations in HBV-related advanced HCC. However, in COSMIC database, TP53 mutation accounted for approximately 27% of all samples with mutation. The frequency of TP53 mutation in our series which was higher than any previous reports could be explained by a difference of etiologies and tumor staging. Woo et al. [10] had demonstrated that TP53 mutation was associated with poor prognosis in Chinese patients with HCC with HBV infection. HBV infection affects the IncRNA expression, which can also affect p53 stability [11]. Nault et al. [9] also reported that advanced-stage HCC (Barcelona Clinic Liver Cancer [BCLC] B/C) showed higher frequencies of TP53 mutation. Then, to determine the possible genetic mechanism related to TACE efficacy, heatmap of significantly somatic genetic alterations was compared between TACE failure/refractoriness (group A) and TACE effective (group B) groups. Among all driver genes, only the frequency of TP53 mutation was found to be significantly higher in group A than that in group B. Among all hotpots in TP53 mutation, mutation frequency of hotspot R249S was higher in group A than that in group B, but no significant difference was shown in all hotpots, including R249S. Currently, the specific mechanism of TP53 mutation on TACE failure/refractoriness, especially hotspot such as R249S, is still unclear.
To further elaborate the relationship between TP53 mutation and TACE efficacy, the following univariate and multivariate analyses were performed. We found that only TP53 mutation and vascular invasion were possible predictive factors of TACE failure/refractoriness. Then, we did subgroup analysis depending on presence or absence of vascular invasion. We found that TP53 mutation was significantly correlated with TACE failure/refractoriness only when vascular invasion was absent. It meant for stage BCLC B patients, TP53 mutation was more likely to drive TACE failure/refractoriness.
Tumor hypoxia induced by TACE therapy is the possible mechanism of TACE failure/refractoriness. Kamat et al. [12] reported that with higher hypoxia inducible factor-1α levels in response to chronic hypoxia, p53-mutant (MUT) cells could favor cell survival and tumor progression. Tumor protein p53 plays a central role in cellular DNA damage responses. Recent studies have shown that accelerated cell proliferation, increased metastasis, and apoptosis resistance were found in the TP53-MUT group [13]. Speidel [14] reported that TP53 is upregulated and activated by genotoxic stress and promotes apoptosis, cell cycle arrest, senescence, and DNA repair. Therefore, compared with p53-wild-type (WT) cells, p53-MUT cells are more likely to induce TACE failure/refractoriness because of metastasis and apoptosis resistance of HCC cells. Furthermore, accumulating evidence showed that hotspot mutations of TP53 mutation such as R249S were strongly associated with poor prognosis [10]. R249S may be associated with hepatitis B virus X protein, which is expressed from hepatocyte-integrated HBV associated with HCC development [15,16]. Besides, vascular invasion was reported as the single impediment to long-term survival in patients with HBV-related HCC who underwent resection and/or ablation after TACE and increased the risk of TACE failure/refractoriness [17,18]. Oda et al. [19] found that in most multinodular HCCs, there are different TP53 mutation patterns in different nodules, indicating that heterogeneous cell clones could promote HCC cells proliferation, vascular invasion, and extrahepatic metastasis. Therefore, in HBV-related Stage BCLC B HCCs, comprehensive treatment is needed when TP53 mutation is present.
Subsequently, GSEA pathway enrichment analysis was performed to elaborate on the discrepancy of related pathways between groups A and B. Therefore, MAPK and apoptosis pathways were found to be related to TACE efficacy. As signaling pathways downstream from targets of TP53 mutation, MAPK and apoptosis pathways could abrogate the dependence of HCCs on TACE treatment and thus may mediate TACE failure/refractoriness. However, the specific mechanism remains to be identified. MAPK/ERK signaling pathways play central roles in cancer cell metabolic adaptation, which promotes liver cancer cell proliferation [20]. HCC-derived exosomes elicit HCC progression and recurrence by epithelial-mesenchymal transition through MAPK/ERK signaling pathway [21]. Apoptosis-related pathway induces the expression of apoptosis-related proteins in HCC cells and promotes vascular invasion and extrahepatic metastasis [22]. Thus, the activation of MAPK and apoptosisrelated pathways induced by TP53 mutation could drive TACE failure/refractoriness.
Our study was limited because of several points. First, it was conducted in a small cohort of patients, and all data were obtained from a single center. To address this limitation, more clinical and genomic data are expected to be collected with higher number of patients and research centers. Second, this was a retrospective (not prospective) study, which may reduce the reliability of data. This mostly led to a selection bias. Third, genetic factors were part of biological factors influencing TACE failure/refractoriness; therefore, more evaluating indicators and circulating cell-free DNA are encouraged.
In conclusion, vascular invasion and TP53 mutation were predictive factors of TACE failure/refractoriness in HBV-related advanced HCC. TP53 mutation was independently related with TACE efficacy, which may work via MAPK and apoptosis pathways. However, further studies regarding their specific mechanism remain to be conducted.