Introduction
Gastric cancer (GC) is the fifth most common cancer and the third leading cause of cancer-related death worldwide [1]. The 5-year relative survival rate is approximately 55% in patients with stage II or III GC [2]. The last few decades have witnessed great advances in the treatment of patients with advanced GC, including postoperative adjuvant chemotherapy [3] and molecular targeted therapeutics [4].
Recent studies have demonstrated favorable outcomes of immunotherapy for patients with advanced cancer treated with immune checkpoint inhibitors, including anti–programmed death 1 receptor (PD-1)/programmed death ligand 1 (PD-L1) inhibitor [5]. PD-1 binds to its ligands PD-L1 and PD-L2 on the tumor cells, allowing for immune escape [6]. PD-L1 protein expression in viable cancer cells determined by immunohistochemistry (IHC) is correlated with a therapeutic effect of immune checkpoint inhibitors, and is thus considered an important biomarker for the use of anti–PD-1/PD-L1 inhibitors in clinical trials. Based on these clinical trial results, the Food and Drug Administration (FDA) approved PD-L1 IHC as a companion diagnostic modality for some solid tumors, including GC [7].
Based on the phase II KEYNOTE 59 trial [8], in September 2017, pembrolizumab was approved by the FDA for patients with advanced or metastatic GC and gastroesophageal junction (GEJ) cancer who had undergone previous treatment with at least two lines of chemotherapy. The PD-L1 IHC 22C3 pharmDx was approved by the FDA as a companion diagnostic assay for the use of pembrolizumab. PD-L1 expression in patients with GC and GEJ cancer evaluated using a combined positive score (CPS) has been proposed, in which a cutoff CPS ≥ 1 would indicate positive PD-L1 expression [8]. The more recent phase III KEYNOTE-061 trial evaluated pembrolizumab monotherapy as a second-line chemotherapy for patients with advanced GC or GEJ cancer with CPS ≥ 1, who were previously treated with first-line chemotherapy of platinum-containing and fluoropyrimidine-containing drugs, which demonstrated no significant improvement of pembrolizumab for improving overall survival (OS) compared to paclitaxel as second-line therapy. However, advanced GC patients with higher levels of PD-L1 expression, such as CPS ≥ 10, did achieve a significant therapeutic benefit from pembrolizumab [9].
Thus, FDA-approved PD-L1 IHC companion diagnostic assays should be performed to assess whether anti–PD1/PD-L1 inhibitors are appropriate for a given patient. Each companion diagnostic assay includes a specific antibody clone and staining platform associated with a specific inhibitor. However, not all pathology laboratories have the available resources to perform the various companion diagnostic assays required for specific inhibitors. To address this challenge, some studies have investigated the possibility of harmonizing these various PD-L1 IHC assays for non-small cell lung cancer (NSCLC) and urothelial carcinoma (UC) [10,11]. The 22C3 pharmDx is currently the only companion diagnostic assay used in GC, and no comparative studies have been conducted on the interchangeability of different IHC assays such as the SP263 assay for GC patients, especially in terms of the CPS.
Therefore, in this study, the PD-L1 IHC 22C3 pharmDx and SP263 assay were performed on surgically resected specimens from patients with advanced GC, and the level of PDL1 expression was determined according to the CPS and tumor proportion score (TPS) with clinically relevant cut-off values. Additional independent assessments by four other pathologists were further compared to determine the interobserver variability for each assay.
Materials and Methods
1. Patients and samples
In total, 379 consecutive patients with stage II and III GC who underwent surgical resection at Seoul National University Bundang Hospital (Seongnam, Korea) between 2006 and 2013 were enrolled in this study. All patients were treated by fluoropyrimidine-based adjuvant chemotherapy after radical surgical resection. Clinicopathological characteristics were retrospectively collected from medical records and pathology reports. OS was defined as the time from the date of operation to death of any cause or censored observation.
Formalin-fixed paraffin-embedded tissue specimens were prepared from the surgically resected GC specimens. The 2-mm core tissue microarrays (TMAs) were constructed as described previously (SuperBioChips Laboratories, Seoul, Korea) [12]. In all 379 samples, we selected representative tissue cores at the center of the tumor (CT) and invasive margin (IM), respectively.
2. PD-L1 IHC and interpretation
Two PD-L1 IHC diagnostic assays were performed on each specimen according to the manufacturer’s instructions: 22C3 pharmDx (mouse monoclonal primary anti–PD-L1 antibody, prediluted, clone 22C3, Dako, Carpinteria, CA) on the Autostainer Link 48 with EnVision DAB Detection System (Agilent Technologies, Santa Clara, CA), and Ventana SP263 (rabbit monoclonal primary anti–PD-L1 antibody, prediluted, Ventana Medical Systems, Tucson, AZ) on the Benchmark XT staining systems and Ultra with OptiView Universal DAB Detection Kit (Ventana Medical Systems) [8,13].
Interpretation of the 22C3 pharmDx and SP263 assays was performed from stained slides by two of the authors (Y.P. and Y.K.) who received appropriate training. PD-L1 expression in the tumor cell membrane and membrane and/or cytoplasm of tumor-associated mononuclear inflammatory cells such as lymphocytes and macrophages was scored. The CPS was defined as the total number of tumor cells and immune cells (including lymphocytes and macrophages) stained with PD-L1 divided by the number of all viable tumor cells, then multiplied by 100 [9]. Each countable array core section contained at least 100 viable GC cells.
3. Interobserver agreement
We randomly selected one TMA block containing 55 GC samples. To assess the variabilities observed between two PD-L1 IHC assays and five observers, five pathologists (Y.P., J.K., H.Y.N., Y.K., and H.S.L.) independently evaluated PDL1 expression according to the CPS and TPS in the 55 samples. All pathologists were blinded to clinical information as well as the evaluation results of other pathologists.
4. p53 IHC
IHC for p53 (DO7, mouse monoclonal, Dako) was performed using an automated immunostainer (BenchMark XT, Ventana Medical Systems), according to the manufacturer’s instructions. To evaluate the overexpression of p53 in tumor cells, strong intensity of nuclear staining in ≥ 10% of tumor cells was defined as p53 overexpression/positive, while the cases with < 10% positive tumor cells including those expressing dispersed or partial positive cells were defined as negative [14].
5. Microsatellite instability analysis
To evaluate the microsatellite instability (MSI) status of tumor cells, polymerase chain reaction (PCR) was performed using five NCI markers (BAT-26, BAT-25, D5S346, D17S250, and S2S123) in both tumor cells and non-neoplastic normal tissues of the same specimens. An automated DNA sequence analyzer (ABI 3731 Genetic Analyzer, Applied Biosystems, Foster City, CA) was used to determine the MSI status in the PCR product. MSI status was assessed by alteration of the allele profiles in tumor cells compared with matched non-neoplastic normal tissues. Two or more NCI markers with unstable peaks were defined as MSI-high (MSI-H) and with one or no unstable NCI marker as MSI-low (MSI-L)/microsatellite stable (MSS) [15].
6. Epstein-Barr virus in situ hybridization
Epstein-Barr virus (EBV) in situ hybridization (ISH) via a fluorescein-conjugated EBV‐encoded small RNA (EBER) oligonucleotide probe (INFORM EBV-encoded RNA probe, Ventana Medical Systems) was used to determine the EBV status of tumor cells. EBV-positive GCs were defined as the presence of tumor cells with EBER expression in the nucleus [15].
7. Statistical analysis
SPSS ver. 25.0 (IBM Corp., Armonk, NY) and Stata 14 (StataCorp LLC, College Station, TX) were used for statistical analyses. For pairwise positive correlations between assays, Spearman correlation coefficients were calculated. For pairwise comparison of the 22C3 pharmDx and SP263 assay, the overall percent agreement (OPA), positive percent agreement (PPA), and negative percent agreement (NPA) were calculated with the following clinically relevant cut-off values: CPS ≥ 1, CPS ≥ 10, TPS ≥ 1%, and TPS ≥ 10% [9,16]. An OPA of at least 90% between the two assays was considered to indicate agreement between assays [17]. Interobserver agreement between the pathologists was evaluated according to intraclass correlation coefficients (ICC) for CPS and TPS, and by Fleiss’ kappa value for CPS cut-off values of ≥ 1 and ≥ 10, respectively. Each pathologist obtained OPA, PPA, NPA, and Cohen's kappa values between the two assays with CPS cut-offs ≥ 1 and ≥ 10. OS was calculated by KaplanMeier method and evaluated by the log-rank test. Cox proportional hazards model for both univariate and multivariate analyses of survival to identify the significance of independent prognostic factors were tested. p-values of < 0.05 were considered to indicate statistically significant difference.
8. Ethical statement
All tissue samples used in the study were obtained from Department of Pathology, Seoul National University Bundang Hospital, and the clinicopathological information and patients’ survival data in the hospital medical records were used. The Institutional Review Board (IRB) of Seoul National University Bundang Hospital approved our study (IRB number: B-1606/349-308). Since this study was the retrospective study, written informed consent were waived for all participants.
Results
1. PD-L1 staining by 22C3 pharmDx and SP263 assay
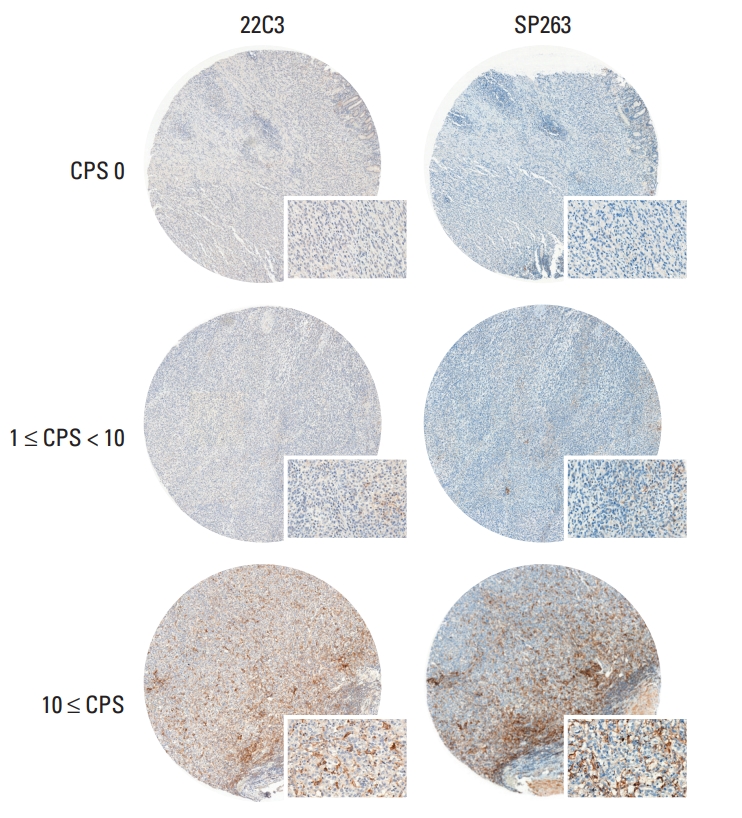
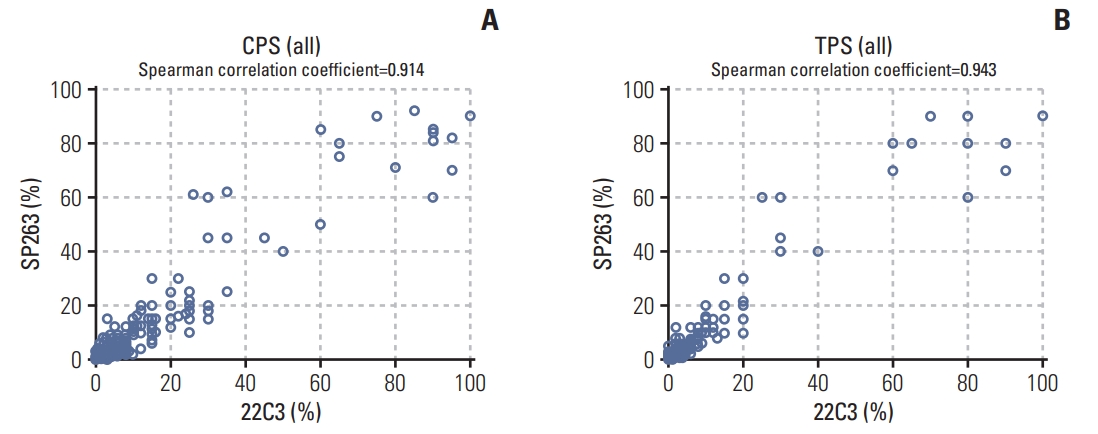
PD-L1 IHC was performed using the 22C3 pharmDx and SP263 assay and the CPS and TPS were calculated for each sample. Representative IHC images of PD-L1 determined with the 22C3 pharmDx and SP263 assay showed similar staining patterns for the same tissue core (Fig. 1). To compare the SP263 assay with the 22C3 pharmDx, the SP263 assay showed stronger staining intensity and prominent membrane staining than the 22C3 pharmDx. There was a strong positive correlation between the two assays for all specimens, including the CT and the IM, when comparing the CPS and TPS (Fig. 2). The Spearman correlation coefficient between the two assays was 0.943 for TPS, which was slightly higher than that for CPS (0.914). Correlation coefficients of the TPS between the two assays were 0.951 for CT and 0.935 for IM, and those of the CPS were 0.916 in the CT and 0.912 in the IM.
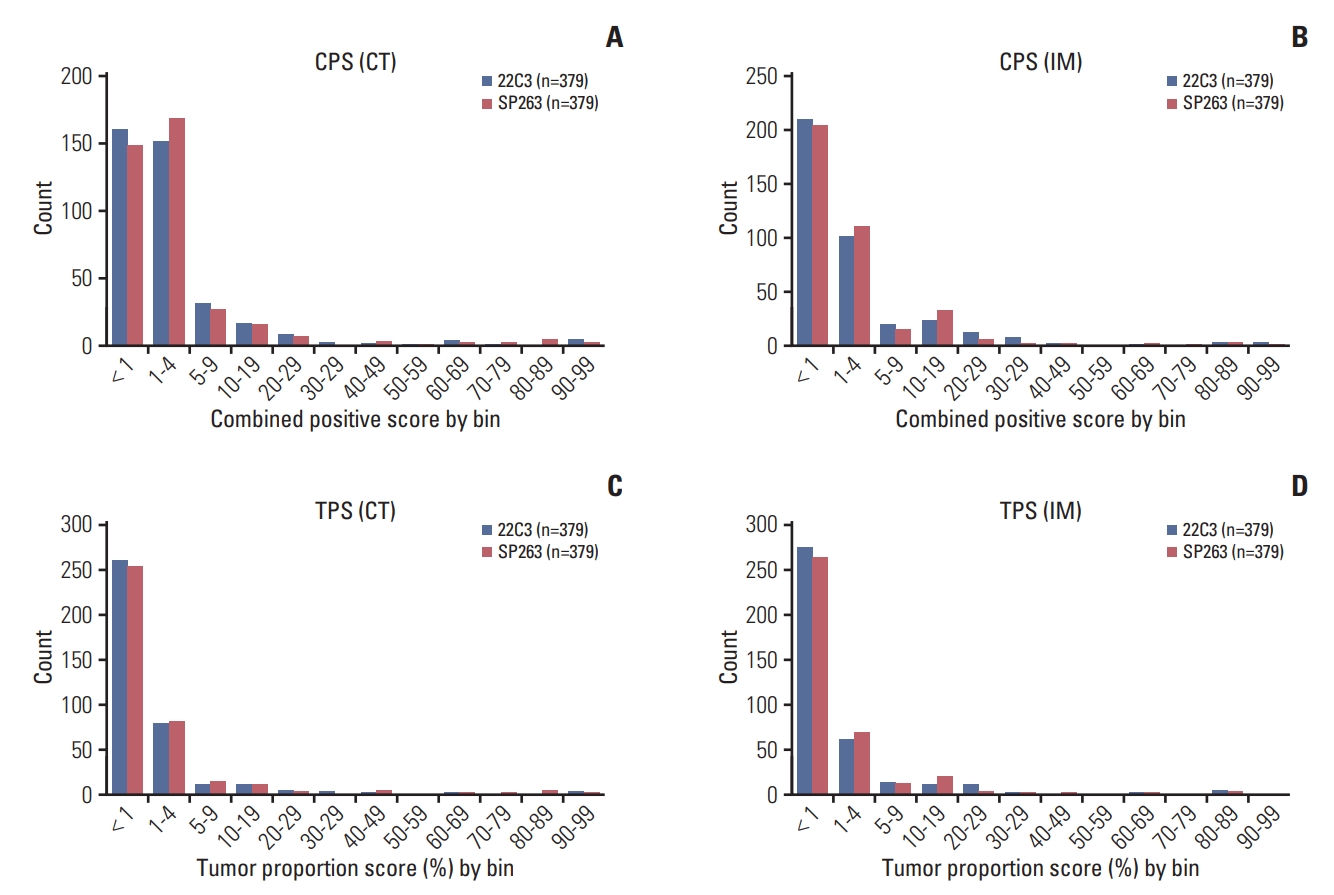
The distribution of CPS and TPS is shown in Fig. 3. In general, the distribution of CPS and TPS results was similar for the two assays, although the number of PD-L1–negative cases (CPS < 1 or TPS < 1) was slightly higher based on the 22C3 pharmDx results than the SP263 assay results. For both assays, the distribution of CPS results ranged from 0 to 10 in most cases, and the TPS results similarly ranged from 0 to 10% for the CT and IM.
2. Clinical diagnostic comparison between the two assays
Of the 379 cases, when positive expression of PD-L1 was defined as CPS ≥ 1, similar numbers of PD-L1–positive expression were determined by the two assays, although the positive rates for SP263 assay were slightly higher than for the 22C3 pharmDx for both the CT and IM (Table 1). At the CPS ≥ 10 cut-off, the 22C3 pharmDx detected slightly more PD-L1–positive cases than the SP263 assay for both the CT and IM. However, the difference in the positive cases between the two assays was greater for CPS ≥ 10 than for CPS ≥ 1.
The correlations between clinicopathologic characteristics and PD-L1 expression are summarized in S1 Table. In brief, at the CPS ≥ 10 cut-off, PD-L1 expression was significantly associated with less aggressive clinicopathologic features, including pTNM stage II (p=0.010), expanding tumor border (p < 0.001), and absence of perineural invasion (p < 0.001), except for the correlation with poorly differentiation (p < 0.001). At both CPS ≥ 1 and ≥ 10 cut-offs, PD-L1 expression were significantly associated with EBV positivity (p=0.001 at CPS ≥ 1, p < 0.001 at CPS ≥ 10) and MSI-H status (p=0.002 at CPS ≥ 1, p < 0.001 at CPS ≥ 10) in GCs.
Representative IHC images of the discordant results for PD-L1 expression in the CT and IM are shown in S2 Fig. The concordance rate and Cohen's κ values of PD-L1 expression between the CT and IM were higher for CPS ≥ 10 with both assays (> 90%) than with CPS ≥ 1 (Table 2).
OPA, PPA, and NPA were calculated at their clinically relevant PD-L1 CPS cut-offs (≥ 1 and ≥ 10) and TPS cut-offs (≥ 1% and ≥ 10%). As shown in Table 3, at all CPS and TPS cut-offs, the OPA was greater than 90% between the two assays and was greater for CPS ≥ 10 (CT, 99.2%; IM, 98.7%) than for CPS ≥ 1 (94.7%; 94.5%) at both the CT and the IM. The PPA and NPA also ranged from 90% to 100% for all cutoffs.
3. Survival analysis comparison of two assays
According to Kaplan-Meier survival analysis, PD-L1 positive expression tended to have a better prognosis at CPS both CPS ≥ 1 and ≥ 10 cut-offs, but there was no statistically significant difference (all p > 0.05) (S3A-D Fig.). On the other hand, patient with negative expression of PD-L1 at CPS ≥ 5 cut-off had a significantly poor outcome in both assays (22C3 pharmDx, p=0.021; SP263 assay, p=0.033) (S4A and S4B Fig.). Multivariate Cox regression analysis indicated that PD-L1 expression by both assays was an independent prognostic factor (22C3 pharmDx, p=0.010; SP263 assay, p=0.035) as well as tumor size and pathologic TNM stage (S5 Table). In addition, at all TPS cut-offs including ≥ 5 cut-off value, there were no significant OS differences according to PD-L1 expression (all p > 0.05, data not shown).
4. Interobserver agreement
To determine the interobserver agreement of PD-L1 interpretation, CPS and TPS results in 55 array cores were obtained from five pathologists, and the ICC for CPS and TPS and Fleiss’ kappa at two CPS cut-offs (≥ 1 and ≥ 10) were measured to assess interobserver variability between five pathologists for the two assays. Table 4 shows the ICCs for CPS among the five pathologists with 55 of the array cores, which was slightly higher for the 22C3 pharmDx (ICC, 0.387) than for the SP263 assay (0.349), while the ICCs for TPS was higher for the SP263 assay (0.710) than for the 22C3 pharmDx (0.596). The ICCs for TPS were higher for both assays than the ICCs for CPS. The concordance as measured by the Fleiss’ kappa analysis was higher for the 22C3 pharmDx (CPS ≥ 1, κ=0.389; CPS ≥ 10, κ=0.256) than for the SP263 assay (κ=0.224 and κ=0.140, respectively) at both the CPS ≥ 1 and CPS ≥ 10 cut-offs.
OPA, PPA, NPA, and Cohen’s κ values between the two assays were assessed by each of the five pathologists at multiple CPS cut-offs (≥ 1 and ≥ 10) (Table 5). At the CPS ≥ 1 cutoff, the OPA was greater than 90% by pathologists A, C, and E, and the PPA was greater than 90% by all pathologists. In contrast, only one pathologist (pathologist E) found an NPA greater than 90%. Moderate concordance, as measured by the Cohen’s kappa value, was observed by pathologists A (κ=0.757), D (κ=0.505), and E (κ=0.963). At the CPS ≥ 10 cutoff, the OPA was greater than 90% by pathologists A, D, and E. These same three pathologists also found PPA and NPA values greater than 80% and reported substantial concordance, as measured by the Cohen’s kappa value (A, κ=0.819; D, κ=0.707; E, κ=1.000) (Table 5).
Discussion
Since pembrolizumab was first approved by the FDA in September 2014 for the treatment of advanced melanoma, immune checkpoint inhibitors, including various anti–PD-1/PD-L1 inhibitors, have shown remarkable outcomes in clinical trials of some advanced solid tumors [7]. The companion diagnostic test that predicts the therapeutic response of patients with advanced cancer to an anti–PD-1/PD-L1 inhibitor has also been approved by the FDA. A PD-L1 IHC assay is considered to be the most effective and widely used diagnostic test for anti–PD-1/PD-L1 inhibitors [7]. However, some studies have reported that PD-L1 expression has some limitations as a biomarker because of the relatively high heterogeneity and interobserver variability [18,19].
Each anti–PD-1/PD-L1 inhibitor is associated with its own specific diagnostic assay, staining platform, and PD-L1 expression evaluation cut-off value set for selecting patients for treatment. As a representative example, pembrolizumab was shown to be applicable for patients with PD-L1–positive expression when using only the FDA-approved PD-L1 IHC 22C3 pharmDx and Agilent Autostainer Link 48 platform. This rigid application has complicated use of the biomarker test for anti–PD-1/PD-L1 inhibitors [20]. To resolve this complexity, the interchangeability of various PD-L1 IHC assays has been evaluated [21]. A comparative study of the Dako 22C3 pharmDx, Dako 28-8 pharmDx, and Ventana SP263 assay in NSCLC patients by AstraZeneca showed that suitable alternatives for each other could be used to select patients with NSCLC who were suitable for anti–PD-1/PD-L1 inhibitors [22]. Based on this study, Ventana SP263 assay performed on the Ventana Benchmark Ultra platform obtained CE-marked to determine that pembrolizumab could be used for patients with NSCLC. Although the results of comparative studies of different PD-L1 IHC diagnostic assays for patients with NSCLC and UC have shown some good agreement considering interchangeability [10,11,23], recent study has raised concerns about this interchangeability [24]. Furthermore, no comparative study of these assays has been conducted for patients with GC to date; thus, we here provide the first comparison between the 22C3 pharmDx and SP263 assay in GC.
In a previous study comparing the results of the 22C3 pharmDx and SP263 assay in patients with NSCLC, the staining of the SP263 assay in tumor cells was more intense and membrane staining was particularly strong, suggesting that this assay could result in more PD-L1 positivity [24]. Consistently, we found that the number of PD-L1–positive cells was higher at all CPS and TPS cut-off values for the SP263 assay.
Our data further showed that the OPA between the 22C3 pharmDx and SP263 assays was greater than 90% at all CPS and TPS cut-off values. Compared with the CPS method, the OPA was higher based on the TPS, and higher OPA values were also observed with higher CPS and TPS cut-off values. In addition, the ICC of the TPS was higher than that of the CPS to confirm the interobserver variability among the five pathologists. Previous studies have shown that PD-L1 expression in immune cells in patients with NSCLC was more discordant than that in tumor cells in comparing different PD-L1 IHC assays, including the 22C3 pharmDx and SP263 assay, and high interobserver variability was observed [10,25]. In contrast with the TPS method, the CPS method evaluates immune cells such as lymphocytes and macrophages as well as tumor cells. The clinical utility of the CPS method was confirmed in patients with GC in the KEYNOTE-059 trial and has the advantage of being a predictive biomarker capable of comprehensively evaluating PD-L1 expression in both tumor and immune cells [26]. Despite the apparent reliability and reproducibility of the CPS method in this trial [26], there are still limited studies on the use of CPS for the evaluation of immune cells in GC, and thus further investigation is needed in this regard as well as in other solid tumors such as NSCLC.
Previous studies demonstrated that PD-L1 expression heterogeneity and interobserver variability were higher than the assay variability in PD-L1 IHC assays [18,19]. Consistently, we found that the PD-L1 expression heterogeneity and interobserver variability were higher than the assay variability between the 22C3 pharmDx and SP263 assay. With respect to expression heterogeneity, the concordance of the results for the CT and IM with CPS ≥ 1 was 77.6% (Cohen’s κvalue= 0.559) with the 22C3 pharmDx assay and was 77.8% (Cohen’s κvalue=0.564) with the SP263 assay, which were lower than the values determining the overall agreement between the two assays. Previous studies have shown higher discrepancies with higher TPS cut-offs in biopsy and resection specimens [18,27], whereas we found higher agreement between the CT and IM with CPS ≥ 10 than with the lower cut-off of CPS ≥ 1. When comparing interobserver variability with assay variability, three pathologists (A, D, and E) obtained higher κ values between the two assays than those obtained among the five pathologists for both CPS ≥ 1 and ≥ 10 cutoffs. Two pathologists (A and D) went through a formal training program to evaluate CPS by the 22C3 pharmDx assay, and pathologist E learned the PD-L1 IHC interpretation method from pathologist D. The other two untrained pathologists (B and C) showed higher assay variability compared to that of the trained participants for both the CPS ≥ 1 and CPS ≥ 10 cut-offs. Three pathologists (A, D, and E) also showed higher agreement between the two assays at CPS ≥ 10 than at CPS ≥ 1. The concordance, as measured by the Cohen’s kappa value, was also the highest between pathologists D and E at the CPS ≥ 1 (22C3 pharmDx, κ=0.741; SP263 assay, κ=0.712) and ≥ 10 (κ=0.867 and κ=0.824, respectively) cut-offs for both assays. The lowest interobserver variability between pathologists D and E may be considered to reflect the influence of their better training. Since there are limited studies on the expression and interobserver variability in GC, further data are needed to validate these results.
In our study, significant differences in OS were identified in the CPS method, which evaluated tumor cells and tumorassociated immune cells, not the TPS method, which evaluated tumor cells alone. Previous studies, including recent randomized controlled trial, reported that patient with positive expression of PD-L1 in stromal immune cells had a significantly good outcome, but no statically significant difference in positive expression of PD-L1 in tumor cells [28]. However, prognostic significance of PD-L1 expression is still uncertain because PD-L1 expression did not have prognostic significance in some studies, but positive expression of PDL1 in tumor cells was a poor prognostic factor in other studies [29]. This diversity might be due to difference in PD-L1 antibody, difference in the clinical stage of the patient cohort and difference in subject and cut-off value to assess PD-L1 expression. We applied clinically relevant PD-L1 antibodies and interpretation guidelines, and PD-L1 positive expression by both 22C3 pharmDx and SP263 assays was an independent better prognostic factor at the CPS ≥ 5 cut-off. Further studies are needed for confirming these prognostic differences.
There are some limitations to this study that should be mentioned. Because this was a retrospective study design conducted in a single institution, specimen bias is possible. In addition, effects of different staining platforms could influence the results of PD-L1 IHC in clinical practice, which was not considered in the study. However, this study was conducted in a large homogenous cohort of patients with advanced GC. Since the PD-L1 IHC was performed on the TMA slide, it was possible to reduce the difference in staining conditions between the cases. In the first place, this study represents the first comparative study to use clinically relevant PD-L1 IHC cut-offs in GC. Therefore, this study may provide a basis for a better diagnostic process for the use of anti–PD-1/PD-L1 inhibitors in GC patients.
In conclusion, the 22C3 pharmDx and SP263 assay showed high agreement for the same GC specimens, but expression heterogeneity and interobserver variability were also found to be higher than assay variability. In addition, the higher cut-off value with the CPS method resulted in greater interchangeability between the 22C3 pharmDx and SP263 assay. More studies are needed in this regard with consideration of the best ways to evaluate PD-L1 expression, such as those addressing issues of expression heterogeneity, interobserver variability, and assay variability in GC when compared to NSCLC. Therefore, our study can provide insights for improving the selection of patients eligible for pembrolizumab treatment.