Skip Navigation
Skip to contents

Cancer Res Treat : Cancer Research and Treatment

OPEN ACCESS

Articles

Page Path
HOME > Cancer Res Treat > Volume 51(4); 2019 > Article
Original Article Novel Prognostic Nomograms Based on Inflammation-Related Markers for Patients with Hepatocellular Carcinoma Underwent Hepatectomy
Yifei Wang, MD1, Kaiyu Sun, MD2, Jingxian Shen, MD, PhD3, Bin Li, MS4, Ming Kuang, MD, PhD1,5, Qinghua Cao, MD, PhD6,, Sui Peng, MD, PhD4,7,
Cancer Research and Treatment : Official Journal of Korean Cancer Association 2019;51(4):1464-1478.
DOI: https://doi.org/10.4143/crt.2018.657
Published online: March 11, 2019

1Department of Liver Surgery, The First Affiliated Hospital of Sun Yat-sen University, Guangzhou, China

2Department of Gastrointestinal Surgery, The First Affiliated Hospital of Sun Yat-sen University, Guangzhou, China

3Department of Medical Imaging, Sun Yat-sen University Cancer Center, Guangzhou, China

4Clinical Trials Unit, The First Affiliated Hospital of Sun Yat-sen University, Guangzhou, China

5Division of Interventional Ultrasound, The First Affiliated Hospital of Sun Yat-sen University, Guangzhou, China

6Department of Pathology, The First Affiliated Hospital of Sun Yat-sen University, Guangzhou, China

7Department of Gastroenterology and Hepatology, The First Affiliated Hospital of Sun Yat-sen University, Guangzhou, China

Correspondence: Sui Peng, MD, PhD Clinical Trials Unit, Department of Gastroenterology and Hepatology, The First Affiliated Hospital of Sun Yat-sen University, 58 Zhongshan Road 2, Guangzhou, China
Tel: 86-20-87755766 Fax: 86-20-87766335 E-mail: pengsui@vip.163.com
Co-correspondence: Qinghua Cao, MD, PhD Department of Pathology, The First Affiliated Hospital of Sun Yat-sen University, 58 Zhongshan Road 2, Guangzhou, China
Tel: 86-20-87331780 Fax: 86-20-87331780 E-mail: caoqhua@mail.sysu.edu.cn
*Yifei Wang, Kaiyu Sun, and Jingxian Shen contributed equally to this work.
• Received: November 27, 2018   • Accepted: March 7, 2019

Copyright © 2019 by the Korean Cancer Association

This is an Open Access article distributed under the terms of the Creative Commons Attribution Non-Commercial License (http://creativecommons.org/licenses/by-nc/4.0/) which permits unrestricted non-commercial use, distribution, and reproduction in any medium, provided the original work is properly cited.

  • 10,216 Views
  • 267 Download
  • 20 Web of Science
  • 27 Crossref
  • 38 Scopus
prev next
  • Purpose
    Hepatocellular carcinoma (HCC) is an aggressive disease with high recurrence rate. However, current staging systems were lack of predictive capacity for HCC recurrence. We aimed to develop prognostic nomograms based on inflammation-related markers for HCC patients underwent hepatectomy.
  • Materials and Methods
    We recruited 889 surgically treated patients from two medical centers. Independent prognostic factors were identified by cox regression analyses. Nomograms for recurrence-free survival (RFS) and overall survival (OS) were established, and validated internally and externally. The performance, discrimination, and calibration of nomograms were assessed, and compared with existed staging systems.
  • Results
    Neutrophil to lymphocyte ratio (NLR) and gamma-glutamyl transpeptidase to platelet ratio (GPR) were the two inflammation-related factor that independently correlated with survival. NLR, GPR, international normalized ratio (INR), microvascular invasion, satellite lesions, tumour number, tumour diameter, and macrovascular invasion were used to construct nomogram for RFS while GPR, total bilirubin, INR, α-fetoprotein, microvascular invasion, satellite lesions, tumour diameter, and macrovascular invasion were for OS. In the training cohort, the C-index of nomogram was 0.701 (95% confidence interval [CI], 0.669 to 0.732) for RFS and 0.761 (95% CI, 0.728 to 0.795) for OS. These results received both internal and external validation with C-index of 0.701 (95% CI, 0.647 to 0.755) and 0.707 (95% CI, 0.657 to 0.756) for RFS, and 0.706 (95% CI, 0.640 to 0.772) and 0.708 (95% CI, 0.646 to 0.771) for OS, respectively. The nomograms showed superior accuracy to conventional staging systems (p<0.001).
  • Conclusion
    The nomograms based on inflammation-related markers are of high efficacy in predicting survival of HCC patients after hepatectomy, which will be valuable in guiding postoperative interventions and follow-ups.
Hepatocellular carcinoma (HCC) is the sixth most common cancer and the third leading cause of cancer-related death worldwide [1]. Surgical resection is recognized as one of the most important curative treatments. But the high post-resection recurrence rate of approximately 70% threatens the long-term survival of HCC patients [2,3]. Current staging systems such as Barcelona Clinic Liver Cancer (BCLC) and 7th American Joint Committee on Cancer (AJCC) cannot accurately predict recurrence and survival, because the individual prognosis is affected by various risk factors including patients’ general condition and their tumor characteristics whereas these systems only considered limited variables. Therefore, it is meaningful to come up with an improved tool that can perform individualised evaluation of postoperative recurrence and survival by enrolling potential risk factors. With this tool, clinicians can identify surgical patients with poor survival at the earliest stage and consequently perform additional interventions to prohibit or delay the recurrence and prolong life expectancy.
Annually, China contributes to almost half of new HCC cases in the world, and a majority of these HCCs are developed with an underlying chronic hepatitis B virus (HBV) infection [4]. Several recent studies have revealed the significant association between chronic inflammatory diseases and higher incidence of malignant cancers including HCC [5-7]. In this regard, given that HBV-related HCC is developed in the inflammatory microenvironment, it is reasonable to correlate with systemic inflammation [6,7]. Inflammatory hematological or biochemical components such as monocyte, neutrophil, or lymphocyte have been used to reflect tumor status via various combinations entitled as inflammation-related markers [8,9]. Emerging evidences suggested that preoperative peripheral inflammatory indices might be capable of predicting the prognosis of HCC patients, including neutrophil to lymphocyte ratio (NLR) [9], platelet to lymphocyte ratio (PLR) [10], lymphocyte to monocyte ratio (LMR) [11], gamma-glutamyl transpeptidase to platelet ratio (GPR) [12], prognostic nutritional index (PNI) and systemic immuneinflammation index (SII) [13,14]. Besides, aspartate aminotransferase (AST) also plays an important role in evaluating the level of inflammation-induced liver injury and correlates with HCC mortality, so AST-related inflammatory markers such as AST to platelet ratio index (APRI) [15], AST to neutrophil ratio index (ANRI) [16], and AST to lymphocyte ratio index (ALRI) [14] were also reported.
However, most previous studies only investigated one or two of these inflammatory markers at one time [9-18], which are insufficient to predict prognosis considering the heterogeneous nature of HCC and its complicated microenvironment. Besides, studies focusing on HBV-related HCC were rare. Therefore, a comprehensive and applicable model by incorporating available inflammatory markers of prognostic significance with other potential prognostic factors would be valuable for HCC patients with chronic HBV hepatitis infection who underwent hepatectomy. Nomogram refers to an easy-to-operate tool used to predict the survival outcomes of HCC patients [19-21]. The models were developed mainly using patient-, treatment-, and tumor-related features [19-22]. However, no predictive nomogram was built depending on the analysis of overall existed inflammation-related markers until now.
In this study, we recruited a large Chinese population to build and validate prognostic nomograms for HCC patients who underwent curative hepatectomy based on peripheral inflammation-related markers and accessible clinical parameters, to guide postoperative adjuvant interventions and follow-ups.
1. Study population
We retrospectively reviewed the medical records of all adult patients diagnosed with primary HCC who underwent curative resection as initial treatment at the First Affiliated Hospital of Sun Yat-sen University (FAHSYSU) and Sun Yatsen University Cancer Center (SYSUCC) from November 2003 through December 2015. The inclusion criteria were adopted as follows: (1) 18 years old and above; (2) HBV surface antigen (HBsAg) positive; (3) without preoperative treatment for HCC; (4) sufficient liver functional reserve: ChildPugh class A or B; (5) histologically proven HCC; (6) no history of other malignancies; and (7) absence of pathologic tumor-positive resection margins. The exclusion criteria were as follows: (1) HBV and other hepatitis virus co-infection; (2) combined HCC and cholangiocarcinoma; (3) incomplete clinical data; (4) lost to follow-up or insufficient follow-up time; and (5) radiologic evidence of extrahepatic metastasis. Among 1,244 patients received curative resection, 1,092 were with HBsAg positive. Two hundred and three patients were excluded due to the following reasons: age < 18 years (n=5), co-infected hepatitis (n=23), other malignancies (n=12), incomplete data (n=84), and insufficient follow-up time (n=79). Finally, 654 patients from FAHSYSU were enrolled in this study and randomly assigned into the training (n=457) and the internal validation (n=197) cohorts in a 7:3 ratio. An independent group of 235 patients from SYSUCC were designated as the external validation cohort. The workflow diagram of patient selection was shown in Fig. 1.
2. Data collection
The following clinical information was collected, including (1) preoperative patient characteristics (age, sex, leukocyte count, neutrophil ratio, monocyte ratio, lymphocyte ratio, haemoglobin, platelet, albumin, AST, alanine aminotransferase (ALT), gamma-glutamyl transpeptidase (GGT), total bilirubin (TBIL), prothrombin time (PT), international normalized ratio (INR), α-fetoprotein (AFP), Eastern Cooperative Oncology Group performance status, and Child-Pugh class); (2) tumor radiological features (tumor number, tumor diameter, macrovascular invasion, and BCLC stage); (3) resection factors (resection margin); and (4) pathological factors (Edmonson-Steiner tumor differentiation, cirrhosis, satellite lesions, microvascular invasion as well as tumor capsule).
3. Formulas of inflammation-related markers
Inflammation-related markers including NLR, PLR, LMR, GPR, APRI, ANRI, ALRI, SII, and PNI were taken within 14 days prior to surgery. Detailed formulas were shown in S1 Table.
4. Hepatic resection
Surgery (open hepatectomy, n=843; laparoscopic hepatectomy, n=46) was performed by surgeons have more than 10-year experience. The management guidelines for choosing open and laparoscopic liver resection were nearly the same. Intraoperative ultrasound was routinely used to detect the tumor burden, location, and invasion of tumor into blood vessels. Resection types composed of non-anatomic resection and anatomic resection and was chosen mainly depends on the current guidelines [23]. Non-anatomic resection refers to wedge resection and tumor enucleation. Anatomic resection refers to the resection of segment relied on Couinaud classification, which completely removed the targeted tumor and corresponding hepatic territory, commonly performed if patients have sufficient liver function. Hepatic parenchymal transection was performed by using a harmonic scalpel or a bipolar electrocautery. And in some cases, temporary hepatic inflow occlusion was used during this process. The thrombectomy for patients in BCLC stage C with tumor thrombus was performed following the procedure described in the study by Shi et al. [24]. Curative resection was defined as complete removal of tumor with a negative resection margin (R0 resection) confirmed by pathological examination.
5. Follow-ups
Contrast-enhanced ultrasound (CEUS) of the liver, contrast-enhanced computed tomography (CECT) of the abdomen and chest radiography were performed 4 weeks after the surgery to evaluate the treatment efficacy. Then the follow-up was performed every 3 months for the first 2 years, every 6 months from 2 to 5 years, and every 12 months thereafter. During each follow-up, CEUS and blood examinations including AFP and liver function relative parameters were performed. CECT or contrast-enhanced magnetic resonance imaging was carried out every 6 months.
The diagnosis of recurrence was relied on the evidence of imaging findings according to the current guidelines [25]. Once recurrence occurred, these patients would receive optimal treatment for recurrent lesions, depending on tumor and clinical characteristics. To avoid potential bias, those received liver transplantation after recurrence were excluded because of its strong impact on survival. Recurrence date was defined as the date of the new lesion firstly appeared on imaging examination. The recurrence-free survival (RFS) was calculated from the date of surgery to the date of recurrence or death or last follow-up, and overall survival (OS) was calculated from the date of surgery to the date of death or last follow-up. The study was censored on January 24, 2019.
6. Statistical analysis
Continuous variables were described as median and quartile range and compared using the independent sample t test or the Mann-Whitney U test. Categorical variables were described as frequency and percentage compared using chi-square test or Fisher exact test. Optimal cut-off points for inflammation-related markers and other continuous variables, except AFP and tumor diameter, were based on the primary outcome of RFS among all the patients from FAHSYSU, using the maximally selected rank statistics from “maxstat” R package.
All the patients from FAHSYSU were randomly divided into a training cohort and an internal validation cohort according to a 7:3 ratio. All the patients from SYSUCC entered the external validation cohort. LASSO with one standard error of lambda and then stepwise based on the Akaike information criterion were used to select the variables to construct a cox regression model in the training dataset. The nomograms were constructed to predict the survival rates based on the final cox model. The Cox model from the training cohort was fixed and applied into the two validation cohorts. The performance of the model was evaluated by Harrell's C-index, time-dependent receiver operating characteristic (ROC) curves and calibration curves in the three cohorts. Comparison of the C-indices between the nomogram and BCLC or 7th AJCC systems were performed with “compare C” R package. Survival curves were constructed using the Kaplan-Meier method and compared with the log-rank test. Statistical analyses were performed using R 3.4.3 (http://www.r-project.org) and Stata/MP 14.0. p-values less than 0.05 were considered statistically significant, and all tests were two-sided.
7. Ethical statement
The study was centrally approved by the Ethical Committee of the two hospitals. Written informed consent of the patient was waived because of the retrospective nature of this study.
1. Baseline characteristics
A total of 889 patients were recruited in this study. The baseline characteristics of patients in each cohort were summarized in Table 1. Among all patients, the mean tumor size was 6.8 cm, with 506 (56.9%) having tumor diameter larger than 5 cm. A large proportion of patients (n=682, 76.7%) were with solitary tumor. According to the BCLC staging system, more than half of the patients (60.6%) were classified into stage 0/A, 10.2% in stage B and the remaining (29.1%) within stage C. And most of the patients (96.0%) were with Child-Pugh liver function class A. There was no significant difference between the training and the internal validation cohorts, except for the ALT level. However, some characteristics in the external cohort such as peripheral parameters (platelet, haemoglobin, AST, GGT, PT, and INR), Child-Pugh score, tumor features (tumor stage, tumor number, tumor diameter, resection margin, and tumor differentiation), and most inflammation-related markers were significantly different compared to those in the training cohort (p < 0.05).
2. Survival outcomes
In the training cohort, the median follow-up was 38.2 months. The 1-, 2-, and 3-year RFS and OS rates were 51.31%, 41.80%, 37.11%, and 81.51%, 71.16%, 63.17%, respectively. In the internal and external validation cohorts, the median follow-up was 37.8 months and 45.8 months, respectively. The 1-, 2-, and 3-year RFS rates were 52.07%, 41.73%, and 37.55% in the internal cohort and 55.34%, 44.00%, 34.88% in the external cohort. The corresponding 1-, 2-, and 3-year OS rates were 79.32%, 68.82%, and 65.33% in the internal cohort and 91.10%, 81.36%, and 70.86% in the external cohort, respectively.
3. Univariate and multivariate analysis in the training cohort
Univariate and multivariate Cox regression analyses were performed in 457 patients from the training cohort for both RFS and OS. Results were shown in S2 Table. The optimal cut-off values of inflammation-related markers were determined as mentioned above (S3 Table). Finally, NLR, GPR, INR, microvascular invasion, satellite lesions, tumor number, tumor diameter, and macrovascular invasion were selected to build nomogram for RFS. GPR, TBIL, INR, AFP, microvascular invasion, satellite lesions, and tumor diameter as well as macrovascular invasion were used to build nomogram for OS. All of these variables were independent prognostic factors of RFS and OS (Tables 2 and 3).
4. Prognostic nomogram for RFS
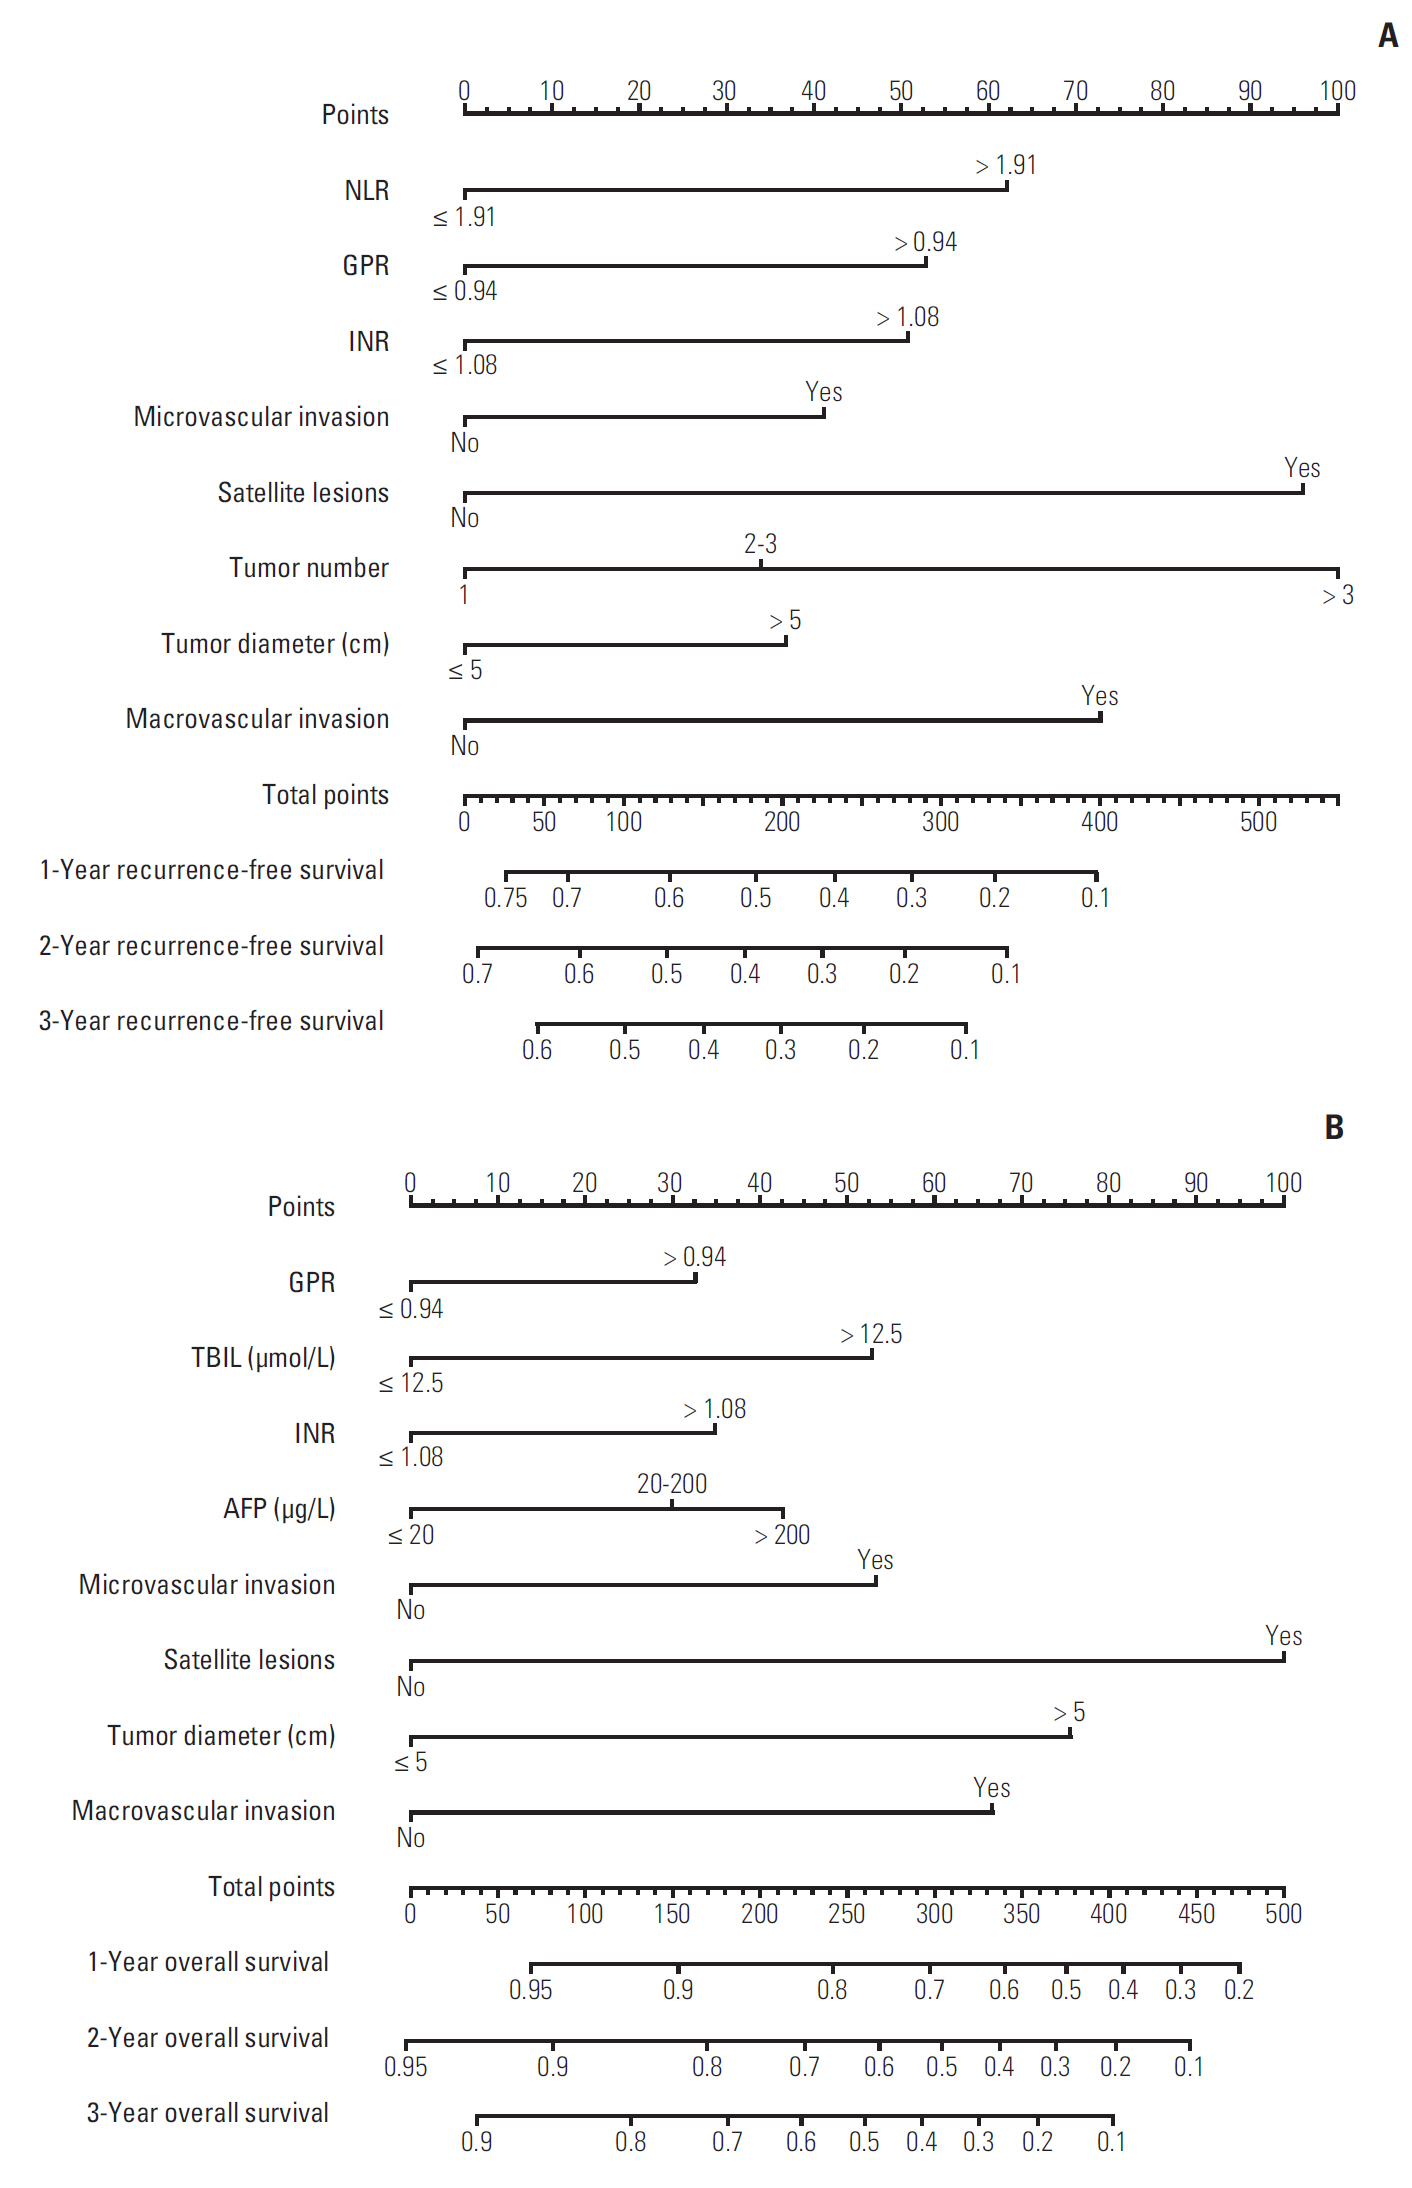
Based on the eight significant prognostic factors (NLR, GPR, INR, microvascular invasion, satellite lesions, tumor number, tumor diameter, and macrovascular invasion) demonstrated in the multivariate analysis, a nomogram was established to predict 1-, 2-, and 3-year RFS rates of HBV-related HCC patients who underwent resection (Fig. 2A).
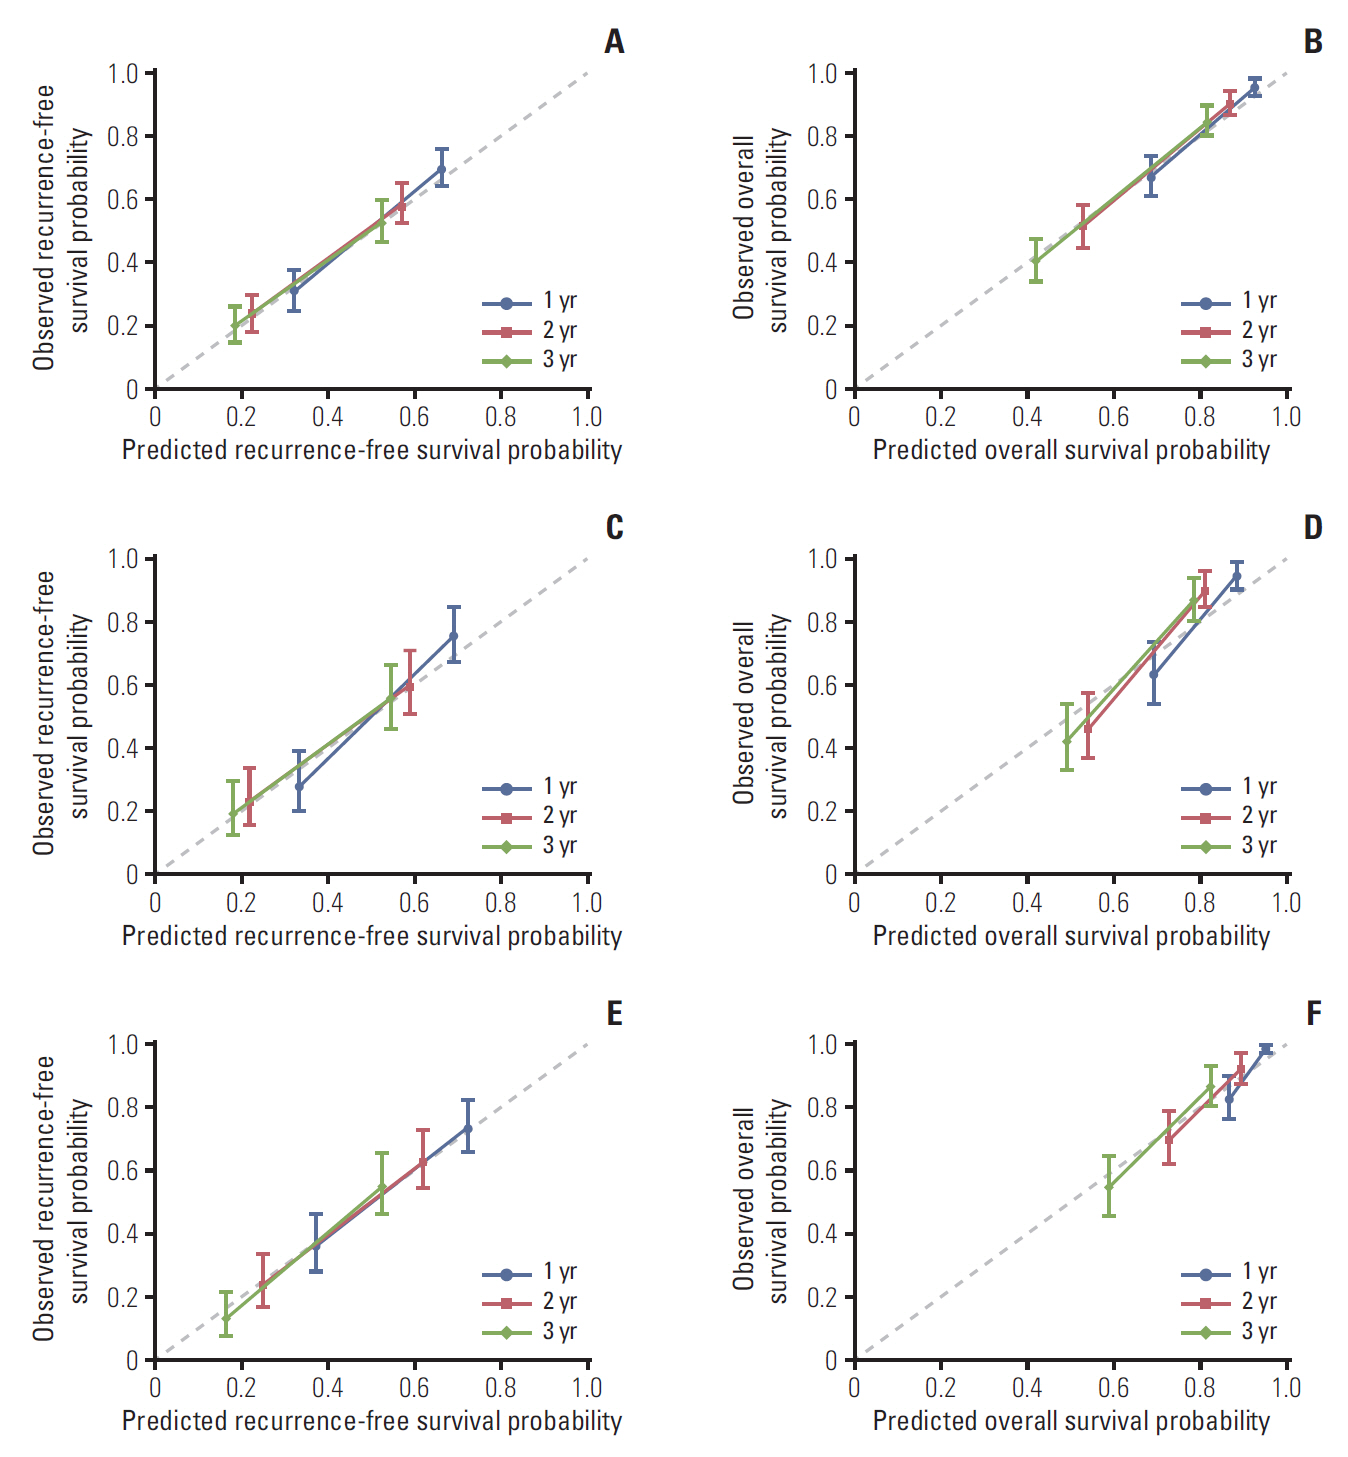
This model exhibited good efficacy in estimating postoperative recurrence with a higher C-index of 0.701 (95% confidence interval [CI], 0.669 to 0.732) in the training cohort, and 0.701 (95% CI, 0.647 to 0.755) and 0.707 (95% CI, 0.657 to 0.756) in the internal and external validation cohorts, respectively. The calibration curves for 1-, 2- and 3-year RFS rates in the training (A), internal validation (B), and external validation (C) cohorts were largely overlapped with its standard lines (Fig. 3). The predictive value of our nomograms for RFS were significantly higher than that of the BCLC staging system (0.629 [95% CI, 0.599 to 0.658], p < 0.001; 0.626 [95% CI, 0.579 to 0.673], p < 0.001; 0.599 [95% CI, 0.575 to 0.623], p < 0.001) and 7th AJCC system (0.620 [95% CI, 0.590 to 0.649], p < 0.001; 0.604 [95% CI, 0.558 to 0.650], p < 0.001; 0.600 [95% CI, 0.574 to 0.626], p < 0.001).
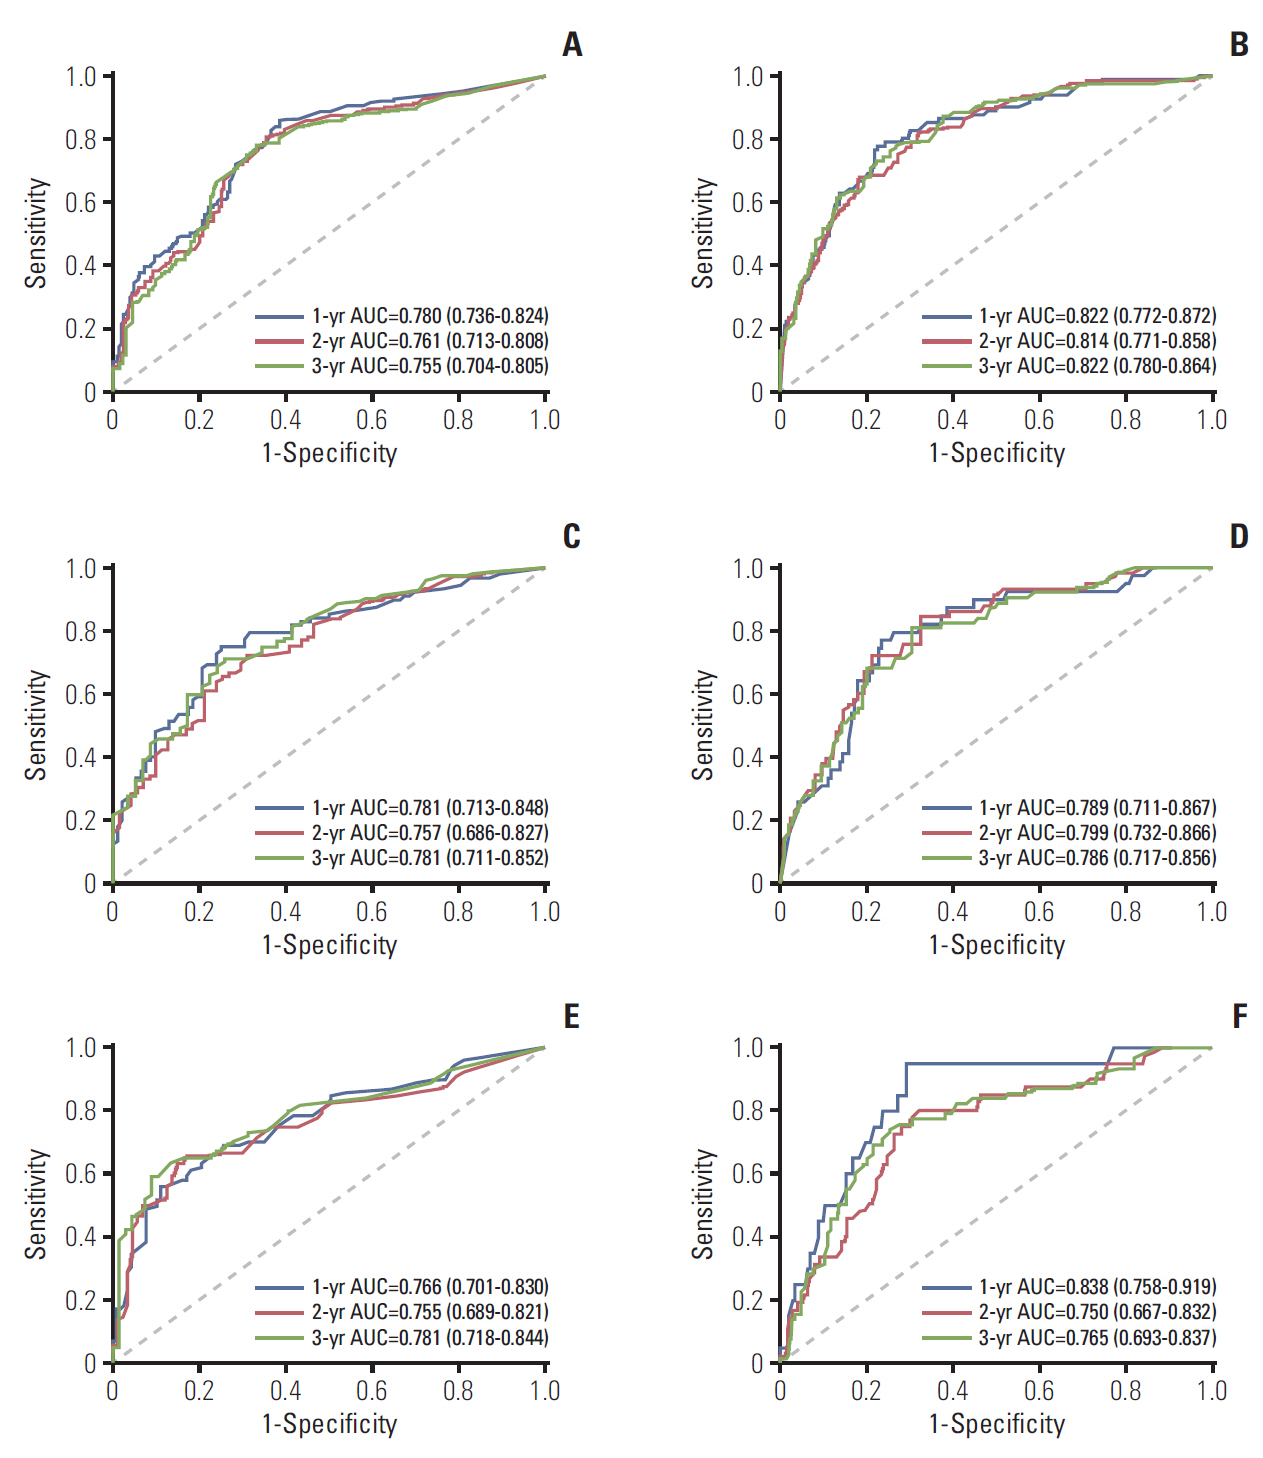
The area under the ROC curves (AUC) of the nomogram in predicting 1-, 2-, and 3-year RFS in the training cohort was 0.780, 0.761, and 0.755, respectively (Fig. 4A). In addition, the AUC of this nomogram in predicting 1-, 2-, and 3-year RFS was 0.781, 0.757, and 0.781 in the internal validation cohort and 0.766, 0.755, and 0.781 in the external validation cohort (Fig. 4B and C).
The model was capable of stratifying patients into three subgroups (low-, medium-, and high-risk groups) by their individual risk scores. In all the three cohorts, the RFS curves were broadly separated among these three subgroups of different risks (p < 0.001) with poorer survival in high-risk patients, which further indicated the good discriminatory ability of this prognostic model (Fig. 5A-C).
5. Prognostic nomogram for OS
The nomogram used to evaluate the probability of 1-, 2-, and 3-year OS was built on the following variants: GPR, TBIL, INR, AFP, microvascular invasion, satellite lesions, tumor diameter, and macrovascular invasion (Fig. 2B). The nomogram also revealed better performance in the training cohort with a higher C-index of 0.761 (95% CI, 0.728 to 0.795) than the BCLC criteria (0.665 [95% CI, 0.629 to 0.701], p < 0.001) and 7th AJCC system (0.652 [95% CI, 0.616 to 0.689], p < 0.001) did. The C-index value in the internal and external validation cohorts reached 0.706 (95% CI, 0.640 to 0.772) and 0.708 (95% CI, 0.646 to 0.771), respectively, which were also greater than the conventional BCLC staging system (0.636 [95% CI, 0.578 to 0.694], p < 0.01; 0.602 [95% CI, 0.567 to 0.637], p < 0.001) and 7th AJCC system (0.623 [95% CI, 0.567 to 0.680], p < 0.01; 0.596 [95% CI, 0.559 to 0.633], p < 0.001). As shown in the calibration plots, the calibration curves for 1-, 2-, and 3-year OS were all well-matched with the standard lines (Fig. 3D-F).
In this nomogram, the AUC of 1-, 2-, and 3-year OS in the training cohort was 0.822, 0.814, and 0.822, respectively (Fig. 4D). In addition, the AUC of this nomogram in predicting 1-, 2-, and 3-year OS was 0.789, 0.799, and 0.786 in the internal validation cohort and 0.838, 0.750, and 0.765 in the external validation cohort (Fig. 4E and F). Similar to RFS, patients were also classified into low-, medium- and high-risk subgroups according to scores derived from nomogram for OS. The OS rates were significantly different among the risk groups, with lower OS rate in the subgroup of higher risk of death (p < 0.001) (Fig. 5D-F).
Our study constructed novel prognostic nomograms for HCC patients treated with surgery by combining inflammation-related markers and conventional risk parameters (tumor features and patient characteristics), and further validated them in an independent external cohort. The models showed better predictive performance than conventional BCLC and 7th AJCC staging systems. Moreover, our results suggested NLR and GPR were the two inflammation-related marker that independently associated with prognosis.
Emerging evidence demonstrated that inflammation status involved in the development of malignant cancers through promoting angiogenesis and inhibiting apoptosis [26]. Inflammatory markers made up by inflammation-related hematologic and biochemical factors have been created to reflect the status of systemic inflammation. While various markers were closely connected to the survival, it is of great potential to build inflammatory markers-based models to predict the prognosis of HCC patients [9-16,18]. Yet, it remains unknown which one had a relatively superior prognostic significance among these inflammatory markers, due to that few studies did the comparison. In this study, we did an overview analysis of the overall reported inflammation-related markers for the first time in a large Chinese population. Multivariate analysis identified that NLR and GPR were the independent prognostic factors for RFS of surgically treated HCC when all the reported inflammatory markers were enrolled into analysis. NLR was the firstly formed inflammation-based factor using to reflect the systemic inflammation response. It has been widely recommended as a potential predictor of survival in various malignancies [9]. GPR was initially introduced by Lemoine et al. [27] as an indicator with high accuracy for the degree of liver fibrosis and cirrhosis in patients with chronic HBV infection. As the presence of cirrhosis is a known risk factor for HCC, it can possibly explain why GPR could be used to evaluate the survival of HCC patients. Consistent with the result in Gomez et al.'s [9] and Wang et al.’s [12] studies, we found that NLR and GPR have superior capacity in predicting prognosis than other inflammation-related scores. Our results in OS also revealed that GPR has the highest prognostic value, and the higher GPR indicated a poorer survival. Although the molecular mechanism of NLR and GPR in HCC progression was unclear, they were still selected to establish our nomograms.
The prognosis of HCC cannot completely depend on inflammation, since patients’ general condition, pathological characteristics (microvascular invasion and satellite lesions) and tumor burden (tumor number, tumor diameter, and macrovascular invasion) have also been recognized as significant factors influencing survival [28,29]. Other variants included in the RFS nomogram were INR, microvascular invasion, satellite lesions, tumor number, tumor diameter, and macrovascularinvasion. Those included in the OS nomogram were TBIL, INR, AFP, microvascular invasion, satellite lesions, tumor diameter, and macrovascular invasion. These variants identified in multivariate analysis were independently correlated with prognosis. Conventional BCLC staging systems commonly used to classify HCC patients into different stages, provide optimal clinical management and corresponding survival outcomes [3]. However, it did not take the above important factors which have been stressed the value of prognosis in HCC, such as microvascular invasion, satellite lesions, AFP level as well as inflammation-related markers into consideration. Therefore, our nomograms could be regarded as a modified system by incorporating the above independent risk factors and showed significantly better prognostic performance (p < 0.001).
It remains controversy whether patients within intermediate (BCLC B) or advanced (BCLC C) stage should receive curative surgery. Several studies have demonstrated that some HCC patients in either of these two stages can benefit more from surgical resection than from the BCLC criteria recommended therapies [30]. Since many Chinese HCC patients beyond the BCLC criteria still received surgical resection, we took patients in BCLC stage B and C into analysis to extend the applied range of our nomograms. Although we included nearly a third of patients within BCLC stage C, we did an additional analysis to show that both models performed well for these patients, with a C-index of 0.743 (95% CI, 0.671 to 0.816) for OS and 0.652 (95% CI, 0.599 to 0.705) for RFS in the training cohort.
Strengths of the study were not only on the integration of inflammatory markers and specialized population, but also on its personalized predictive value of survival at early time. All the variables composited in our models are common and accurate, given that nomogram is a graphical tool generally used to integrate many independent variables according to its weight meanwhile in an easy-to-operate way. As shown in our results, the nomograms possessed great discriminatory ability which can separately stratify patients with different risks. With the nomograms, clinicians can choose to perform personalized additional interventions and shorten the interval of postoperative follow-ups if patients are evaluated to have a higher risk of recurrence and poorer survival.
Moreover, most previous studies were conducted in a single medical center. In our study, we enlarged our study population by recruiting patients from another hospital and further validated our models in this group of people. It is notable that the baseline characteristics between the training cohort and external cohort had disparity, and patients from FAHSYSU showed worsen tumor features. The possible reason is the difference in making treatment choice in these two centers. SYSUCC tended to send patients in intermediate or advanced stage to receive transcatheter arterial chemoembolization or palliative treatments, while general hospitals like FAHSYSU frequently performed surgery. Despite of the differences in baseline characteristics, our models also exhibited good prognostic value in the external cohort, with a C-index of 0.707 for RFS and 0.708 for OS, which implies that the nomograms are stable and can be adopted in different populations with high generalizability.
There are limitations in this study. First, our nomograms established using the data from HBsAg-positive HCC patients because China is an HBV prevalent region. Thus, it may restrict the application of the two nomograms in HCC patients with other aetiological backgrounds. Another one was that some inflammation-related markers are composed by overlapped hematologic and biochemical factors. Although it might possibly bias the results to some extent, we did not take the interaction among these markers into consideration while doing the analysis. Moreover, there was lack of a prospective cohort to further confirm the predictive value of our models in prognosis.
In conclusion, our study established and validated two novel prognostic nomograms which incorporated specific preoperative inflammatory markers and clinical risk variables to estimate the RFS and OS rates in HBV-related patients who underwent curative hepatectomy in a large Chinese population. The user-friendly models can be helpful to clinicians in predicting individual prognosis and deciding nextstep therapeutic interventions.
Supplementary materials are available at Cancer Research and Treatment website (https://www.e-crt.org).
S1 Table.
Formulas of inflammation-related markers
crt-2018-657-suppl1.pdf
S2 Table.
Univariate analysis of recurrence-free survival and overall survival
crt-2018-657-suppl2.pdf
S3 Table.
Cut-off values of inflammation-related markers
crt-2018-657-suppl3.pdf

Conflict of interest relevant to this article was not reported.

Acknowledgements
This study was supported by grants from the National Science Fund for Distinguished Young Scholars of China (81825013), National Natural Science Foundation of China (81771958, 81770608) and the Guangdong Medical Science and Technology Foundation (2016-1192364982).
Fig. 1.
The workflow diagram of patient selection. HCC, hepatocellular carcinoma; HBsAg, hepatitis B virus surface antigen; FAHSYSU, First Affiliated Hospital of Sun Yat-sen University; SYSUCC, Sun Yat-sen University Cancer Center.
crt-2018-657f1.jpg
Fig. 2.
Nomograms for predicting recurrence-free survival (A) and overall survival (B). NLR, neutrophil to lymphocyte ratio; GPR, gamma-glutamyl transpeptidase to platelet ratio; INR, international normalized ratio; TBIL, total bilirubin; AFP, α-fetoprotein.
crt-2018-657f2.jpg
Fig. 3.
The calibration curves for predicting the 1-, 2-, and 3-year recurrence-free survival and overall survival in the training (A, B), internal validation (C, D), and external validation (E, F) cohorts.
crt-2018-657f3.jpg
Fig. 4.
Receiver operating characteristic curves for recurrence-free survival and overall survival in the training (A, B), internal validation (C, D), and external validation (E, F) cohorts, respectively.
crt-2018-657f4.jpg
Fig. 5.
Patients’ recurrence-free survival and overall survival rates according to the nomogram model in the training (A, B), internal validation (C, D), and external validation (E, F) cohorts. Green line for high-risk, red line for medium-risk, blue line for low-risk.
crt-2018-657f5.jpg
Table 1.
Baseline characteristics
Variable Total (n=889) Training cohort (n=457) Internal cohort (n=197) p-valuea) External cohort (n=235) p-valueb)
Age (yr) 50.4 (42.9-59.0) 51.5 (43.3-58.7) 49.0 (42.4-58.6) 0.291 50.2 (42.4-59.7) 0.799
Sex, female/male 98/791 (11.0/89.0) 55/402 (12.0/88.0) 25/172 (12.7/87.3) 0.814 18/217 (7.7/92.3) 0.076
Leukocyte (×109/L) 6.1 (4.9-7.5) 6.2 (5.0-7.6) 6.2 (5.0-7.8) 0.706 5.9 (4.8-7.1) 0.095
Neutrophil ratio 0.6 (0.5-0.6) 0.6 (0.5-0.6) 0.6 (0.5-0.7) 0.605 0.6 (0.5-0.6) 0.543
Monocyte ratio 0.1 (0.1-0.1) 0.1 (0.1-0.1) 0.1 (0.1-0.1) 0.841 0.1 (0.1-0.1) < 0.001
Lymphocyte ratio 0.3 (0.2-0.4) 0.3 (0.2-0.4) 0.3 (0.2-0.3) 0.372 0.3 (0.2-0.4) 0.107
Haemoglobin (≤ 128 g/L/> 128 g/L) 184/705 (20.7/79.3) 107/350 (23.4/76.6) 44/153 (22.3/77.7) 0.764 33/202 (14.0/86.0) 0.004
Platelet (×109/L) 181.0 (135.0-225.0) 186.0 (142.0-230.0) 191.0 (150.0-235.0) 0.367 161.6 (122.4-201.9) < 0.001
Albumin (g/L) 40.2 (37.2-42.9) 39.8 (36.7-42.1) 40.0 (37.0-42.4) 0.388 41.9 (38.9-44.0) < 0.001
AST (U/L) 39.0 (29.0-60.0) 39.0 (29.0-63.0) 42.0 (32.0-62.0) 0.154 37.5 (27.8-51.4) 0.045
ALT (U/L) 39.0 (27.3-58.0) 38.0 (26.0-56.0) 42.0 (31.0-65.0) 0.024 40.4 (27.6-57.9) 0.345
GGT (U/L) 68.3 (41.0-129.0) 71.0 (43.0-134.0) 81.0 (46.0-172.0) 0.155 52.4 (34.7-88.5) < 0.001
TBIL (> 12.5 μmol/L/≤ 12.5 μmol/L) 522/367 (58.7/41.3) 270/187 (59.1/40.9) 119/78 (60.4/39.6) 0.751 133/102 (56.6/43.4) 0.530
PT (> 12.8 sec/≤ 12.8 sec) 330/559 (37.1/62.9) 198/259 (43.3/56.7) 91/106 (46.2/53.8) 0.498 41/194 (17.4/82.6) < 0.001
INR (> 1.08/≤ 1.08) 403/486 (45.3/54.7) 222/235 (48.6/51.4) 103/94 (52.3/47.7) 0.384 78/157 (33.2/66.8) < 0.001
Alpha-fetoprotein (μg/L)c)
 ≤ 20 267 (30.0) 136 (29.8) 52 (26.4) 0.654 79 (33.6) 0.297
 20-200 212 (23.8) 104 (22.8) 49 (24.9) 59 (25.1)
 > 200 410 (46.1) 217 (47.5) 96 (48.7) 97 (41.3)
Performance status (0/≥ 1) 849/40 (95.5/4.5) 431/26 (94.3/5.7) 185/12 (93.9/6.1) 0.840 233/2 (99.1/0.9) 0.002
Child-Pugh score (A/B) 853/36 (96.0/4.0) 427/30 (93.4/6.6) 190/7 (96.4/3.6) 0.057 233/2 (99.1/0.9) 0.001
BCLC stagec)
 0/A 539 (60.6) 240 (52.5) 101 (51.3) 0.658 198 (84.3) < 0.001
 B 91 (10.2) 55 (12.0) 20 (10.2) 16 (6.8)
 C 259 (29.1) 162 (35.4) 76 (38.6) 21 (8.9)
Tumor number
 1 682 (76.7) 335 (73.3) 145 (73.6) 0.728 202 (86.0) 0.001
 2-3 117 (13.2) 69 (15.1) 26 (13.2) 22 (9.4)
 > 3 90 (10.1) 53 (11.6) 26 (13.2) 11 (4.7)
Tumor diameter (≤ 5 cm/> 5 cm) 383/506 (43.1/56.9) 177/280 (38.7/61.3) 77/120 (39.1/60.9) 0.932 129/106 (54.9/45.1) < 0.001
Tumor differentiation (I-II/III-IV) 736/153 (82.8/17.2) 368/89 (80.5/19.5) 163/34 (82.7/17.3) 0.506 205/30 (87.2/12.8) 0.027
Cirrhosis (yes/no) 586/303 (65.9/34.1) 280/177 (61.3/38.7) 122/75 (61.9/38.1) 0.874 184/51 (78.3/21.7) < 0.001
Satellite lesions (yes/no) 148/741 (16.6/83.4) 90/367 (19.7/80.3) 45/152 (22.8/77.2) 0.361 13/222 (5.5/94.5) < 0.001
Microvascular invasion (yes/no) 378/511 (42.5/57.5) 180/277 (39.4/60.6) 80/117 (40.6/59.4) 0.056 102/133 (43.4/56.6) 0.308
Macrovascular invasion (yes/no) 224/665 (25.2/74.8) 137/320 (30.0/70.0) 66/131 (33.5/66.5) 0.371 21/214 (8.9/91.1) < 0.001
Tumor capsulec)
 Complete 646 (72.7) 381 (83.4) 152 (77.2) 0.129 113 (48.1) < 0.001
 Incomplete 167 (18.8) 68 (14.9) 42 (21.3) 57 (24.3)
 Absence 76 (8.5) 8 (1.8) 3 (1.5) 65 (27.7)
Resection margin (> 1 cm /≤ 1 cm) 731/158 (82.2/17.8) 363/94 (79.4/20.6) 152/45 (77.2/22.8) 0.050 216/19 (91.9/8.1) < 0.001
NLR (≤ 1.91/> 1.91) 409/480 (46.0/54.0) 206/251 (45.1/54.9) 84/113 (42.6/57.4) 0.565 119/116 (50.6/49.4) 0.165
PLR (≤ 108.56/> 108.56) 520/369 (58.5/41.5) 254/203 (55.6/44.4) 106/91 (53.8/46.2) 0.676 160/75 (68.1/31.9) 0.001
LMR (≤ 3.79/> 3.79) 477/412 (53.7/46.3) 261/196 (57.1/42.9) 116/81 (58.9/41.1) 0.674 100/135 (42.6/57.4) < 0.001
GPR (≤ 0.94/> 0.94) 491/398 (55.2/44.8) 250/207 (54.7/45.3) 101/96 (51.3/48.7) 0.419 140/95 (59.6/40.4) 0.221
SII (≤ 202.14/> 202.14) 213/676 (24.0/76.0) 110/347 (24.1/75.9) 35/162 (17.8/82.2) 0.075 68/167 (28.9/71.1) 0.165
PNI (≤ 48.69/> 48.69) 406/483 (45.7/54.3) 233/224 (51.0/49.0) 91/106 (46.2/53.8) 0.261 82/153 (34.9/65.1) < 0.001
APRI (≤ 0.24/> 0.24) 444/445 (49.9/50.1) 233/224 (51.0/49.0) 98/99 (49.7/50.3) 0.771 113/122 (48.1/51.9) 0.470
ANRI (≤ 12.82/> 12.82) 480/409 (54.0/46.0) 240/217 (52.5/47.5) 107/90 (54.3/45.7) 0.672 133/102 (56.6/43.4) 0.308
ALRI (≤ 24.41/> 24.41) 467/422 (52.5/47.5) 242/215 (53.0/47.0) 94/103 (47.7/52.3) 0.219 131/104 (55.7/44.3) 0.486

Values are presented as median (interquartile range) or number (%). AST, aspartate aminotransferase; ALT, alanine aminotransferase; GGT, gamma-glutamyl transpeptidase; TBIL, total bilirubin; PT, prothrombin time; INR, international normalized ratio; BCLC, Barcelona Clinic Liver Cancer; NLR, neutrophil to lymphocyte ratio; PLR, platelet to lymphocyte ratio; LMR, lymphocyte to monocyte ratio; GPR, GGT to platelet ratio; SII, systemic immune-inflammation index; PNI, prognostic nutritional index; APRI, AST to platelet ratio index; ANRI, AST to neutrophil ratio index; ALRI, AST to lymphocyte ratio index.

a) p-value between training and internal validation cohorts,

b) p-value between training and external validation cohorts,

c) Percentage may not total 100 because of rounding.

Table 2.
Multivariate analysis of recurrence-free survival in the training cohort
Variable Recurrence-free survival
Hazard ratio (95% CI) p-value
NLR (> 1.91:≤ 1.91) 1.42 (1.10-1.82) 0.006
GPR (> 0.94:≤ 0.94) 1.34 (1.04-1.74) 0.025
INR (> 1.08:≤ 1.08) 1.33 (1.04-1.70) 0.025
No. of tumors
 1 1.00
 2-3 1.21 (0.88-1.66) 0.241
 > 3 1.75 (1.23-2.48) 0.002
Tumor diameter (> 5 cm:≤ 5 cm) 1.23 (1.01-1.45) 0.031
Satellite lesions (yes:no) 1.71 (1.27-2.29) < 0.001
Microvascular invasion (yes:no) 1.26 (1.06-1.46) 0.027
Macrovascular invasion (yes:no) 1.50 (1.12-2.00) 0.006

CI, confidence interval; NLR, neutrophil to lymphocyte ratio; GPR, gamma-glutamyl transpeptidase to platelet ratio; INR, international normalized ratio.

Table 3.
Multivariate analysis of overall survival in the training cohort
Variable Overall survival
Hazard ratio (95% CI) p-value
GPR (> 0.94:≤ 0.94) 1.35 (1.01-1.69) 0.025
TBIL (> 12.5 μmol/L:≤ 12.5 μmol/L) 1.58 (1.15-2.17) 0.005
INR (> 1.08:≤ 1.08) 1.31 (1.02-1.60) 0.026
α-Fetoprotein (μg/L)
 ≤ 20 1.00
 20-200 1.32 (0.83-2.08) 0.238
 > 200 1.48 (1.01-2.17) 0.044
Tumor diameter (> 5 cm:≤ 5 cm) 1.92 (1.33-2.77) 0.001
Microvascular invasion (yes:no) 1.55 (1.12-2.16) 0.009
Macrovascular invasion (yes:no) 1.77 (1.26-2.50) 0.001
Satellite lesions (yes: no) 2.32 (1.64-3.29) < 0.001

CI, confidence interval; GPR, gamma-glutamyl transpeptidase to platelet ratio; TBIL, total bilirubin; INR, international normalized ratio.

  • 1. Bray F, Ferlay J, Soerjomataram I, Siegel RL, Torre LA, Jemal A. Global cancer statistics 2018: GLOBOCAN estimates of incidence and mortality worldwide for 36 cancers in 185 countries. CA Cancer J Clin. 2018;68:394–424. ArticlePubMed
  • 2. Portolani N, Coniglio A, Ghidoni S, Giovanelli M, Benetti A, Tiberio GA, et al. Early and late recurrence after liver resection for hepatocellular carcinoma: prognostic and therapeutic implications. Ann Surg. 2006;243:229–35. ArticlePubMedPMC
  • 3. European Association for the Study of the Liver. EASL clinical practice guidelines: management of hepatocellular carcinoma. J Hepatol. 2018;69:182–236. ArticlePubMed
  • 4. de Martel C, Ferlay J, Franceschi S, Vignat J, Bray F, Forman D, et al. Global burden of cancers attributable to infections in 2008: a review and synthetic analysis. Lancet Oncol. 2012;13:607–15. ArticlePubMed
  • 5. Mantovani A, Allavena P, Sica A, Balkwill F. Cancer-related inflammation. Nature. 2008;454:436–44. ArticlePubMedPDF
  • 6. Trepo C, Chan HL, Lok A. Hepatitis B virus infection. Lancet. 2014;384:2053–63. ArticlePubMed
  • 7. Berasain C, Castillo J, Perugorria MJ, Latasa MU, Prieto J, Avila MA. Inflammation and liver cancer: new molecular links. Ann N Y Acad Sci. 2009;1155:206–21. ArticlePubMed
  • 8. Sasaki A, Iwashita Y, Shibata K, Matsumoto T, Ohta M, Kitano S. Prognostic value of preoperative peripheral blood monocyte count in patients with hepatocellular carcinoma. Surgery. 2006;139:755–64. ArticlePubMed
  • 9. Gomez D, Farid S, Malik HZ, Young AL, Toogood GJ, Lodge JP, et al. Preoperative neutrophil-to-lymphocyte ratio as a prognostic predictor after curative resection for hepatocellular carcinoma. World J Surg. 2008;32:1757–62. ArticlePubMedPDF
  • 10. Smith RA, Bosonnet L, Raraty M, Sutton R, Neoptolemos JP, Campbell F, et al. Preoperative platelet-lymphocyte ratio is an independent significant prognostic marker in resected pancreatic ductal adenocarcinoma. Am J Surg. 2009;197:466–72. ArticlePubMed
  • 11. Lin ZX, Ruan DY, Li Y, Wu DH, Ma XK, Chen J, et al. Lymphocyte-to-monocyte ratio predicts survival of patients with hepatocellular carcinoma after curative resection. World J Gastroenterol. 2015;21:10898–906. ArticlePubMedPMC
  • 12. Wang WL, Zheng XL, Zhang ZY, Zhou Y, Hao J, Tang G, et al. Preoperative gamma-glutamyl transpeptidase to platelet ratio (GPR) is an independent prognostic factor for HBV-related hepatocellular carcinoma after curative hepatic resection. Medicine (Baltimore). 2016;95:e4087ArticlePubMedPMC
  • 13. Chan AW, Chan SL, Wong GL, Wong VW, Chong CC, Lai PB, et al. Prognostic Nutritional Index (PNI) predicts tumor recurrence of very early/early stage hepatocellular carcinoma after surgical resection. Ann Surg Oncol. 2015;22:4138–48. ArticlePubMedPDF
  • 14. Yang Z, Zhang J, Lu Y, Xu Q, Tang B, Wang Q, et al. Aspartate aminotransferase-lymphocyte ratio index and systemic immune-inflammation index predict overall survival in HBV-related hepatocellular carcinoma patients after transcatheter arterial chemoembolization. Oncotarget. 2015;6:43090–8. ArticlePubMedPMC
  • 15. Shen SL, Fu SJ, Chen B, Kuang M, Li SQ, Hua YP, et al. Preoperative aspartate aminotransferase to platelet ratio is an independent prognostic factor for hepatitis B-induced hepatocellular carcinoma after hepatic resection. Ann Surg Oncol. 2014;21:3802–9. ArticlePubMedPDF
  • 16. Ji F, Fu S, Guo Z, Pang H, Chen D, Wang X, et al. Prognostic significance of preoperative aspartate aminotransferase to neutrophil ratio index in patients with hepatocellular carcinoma after hepatic resection. Oncotarget. 2016;7:72276–89. ArticlePubMedPMC
  • 17. Pinato DJ, Stebbing J, Ishizuka M, Khan SA, Wasan HS, North BV, et al. A novel and validated prognostic index in hepatocellular carcinoma: the inflammation based index (IBI). J Hepatol. 2012;57:1013–20. ArticlePubMed
  • 18. Hu B, Yang XR, Xu Y, Sun YF, Sun C, Guo W, et al. Systemic immune-inflammation index predicts prognosis of patients after curative resection for hepatocellular carcinoma. Clin Cancer Res. 2014;20:6212–22. ArticlePubMed
  • 19. Shim JH, Jun MJ, Han S, Lee YJ, Lee SG, Kim KM, et al. Prognostic nomograms for prediction of recurrence and survival after curative liver resection for hepatocellular carcinoma. Ann Surg. 2015;261:939–46. ArticlePubMed
  • 20. Yang P, Qiu J, Li J, Wu D, Wan X, Lau WY, et al. Nomograms for pre- and postoperative prediction of long-term survival for patients who underwent hepatectomy for multiple hepatocellular carcinomas. Ann Surg. 2016;263:778–86. ArticlePubMed
  • 21. Shen J, He L, Li C, Wen T, Chen W, Lu C, et al. Prognostic nomograms for patients with resectable hepatocelluar carcinoma incorporating systemic inflammation and tumor characteristics. Oncotarget. 2016;7:80783–93. ArticlePubMedPMC
  • 22. He W, Peng B, Tang Y, Yang J, Zheng Y, Qiu J, et al. Nomogram to predict survival of patients with recurrence of hepatocellular carcinoma after surgery. Clin Gastroenterol Hepatol. 2018;16:756–64. e10ArticlePubMed
  • 23. Strasberg SM. Nomenclature of hepatic anatomy and resections: a review of the Brisbane 2000 system. J Hepatobiliary Pancreat Surg. 2005;12:351–5. ArticlePubMedPDF
  • 24. Shi J, Lai EC, Li N, Guo WX, Xue J, Lau WY, et al. Surgical treatment of hepatocellular carcinoma with portal vein tumor thrombus. Ann Surg Oncol. 2010;17:2073–80. ArticlePubMedPDF
  • 25. European Association For the Study of the Liver; European Organisation for Research and Treatment of Cancer. EASL-EORTC clinical practice guidelines: management of hepatocellular carcinoma. J Hepatol. 2012;56:908–43. ArticlePubMed
  • 26. Pinato DJ, North BV, Sharma R. A novel, externally validated inflammation-based prognostic algorithm in hepatocellular carcinoma: the prognostic nutritional index (PNI). Br J Cancer. 2012;106:1439–45. ArticlePubMedPMCPDF
  • 27. Lemoine M, Shimakawa Y, Nayagam S, Khalil M, Suso P, Lloyd J, et al. The gamma-glutamyl transpeptidase to platelet ratio (GPR) predicts significant liver fibrosis and cirrhosis in patients with chronic HBV infection in West Africa. Gut. 2016;65:1369–76. ArticlePubMed
  • 28. Imamura H, Matsuyama Y, Tanaka E, Ohkubo T, Hasegawa K, Miyagawa S, et al. Risk factors contributing to early and late phase intrahepatic recurrence of hepatocellular carcinoma after hepatectomy. J Hepatol. 2003;38:200–7. ArticlePubMed
  • 29. Kluger MD, Salceda JA, Laurent A, Tayar C, Duvoux C, Decaens T, et al. Liver resection for hepatocellular carcinoma in 313 Western patients: tumor biology and underlying liver rather than tumor size drive prognosis. J Hepatol. 2015;62:1131–40. ArticlePubMed
  • 30. Zhong JH, Ke Y, Gong WF, Xiang BD, Ma L, Ye XP, et al. Hepatic resection associated with good survival for selected patients with intermediate and advanced-stage hepatocellular carcinoma. Ann Surg. 2014;260:329–40. ArticlePubMed

Figure & Data

REFERENCES

    Citations

    Citations to this article as recorded by  
    • Predictive value of the FIB-4 index, APRI, ALBI score, and GPR for overall survival in treatment-naïve metastatic colorectal cancer patients
      Mehmet Serdar Yıldırım, Yunus Güzel, Canan Can, İhsan Kaplan, Veysi Şenses, İhsan Solmaz, Bilgin Bahadır Başgöz, Ömer Faruk Alakuş, Serdar İleri, Halil Kömek
      BMC Gastroenterology.2025;[Epub]     CrossRef
    • Machine learning-based integration reveals immunological heterogeneity and the clinical potential of T cell receptor (TCR) gene pattern in hepatocellular carcinoma
      Zewei Zhuo, Huihuan Wu, Lingli Xu, Yuran Ji, Jiezhuang Li, Liehui Liu, Hong Zhang, Qi Yang, Zhongwen Zheng, Weijian Lun
      Apoptosis.2025;[Epub]     CrossRef
    • A Dynamic Online Nomogram Based on Gd-EOB-DTPA-Enhanced MRI and Inflammatory Biomarkers for Preoperative Prediction of Pathological Grade and Stratification in Solitary Hepatocellular Carcinoma: A Multicenter Study
      Fei Wang, Yuan Qin, Zheng ming Wang, Chun yue Yan, Ying He, Dan Liu, Li Wen, Dong Zhang
      Academic Radiology.2024; 31(10): 4021.     CrossRef
    • Development and comprehensive validation of a predictive prognosis model for very early HCC recurrence within one year after curative resection: a multicenter cohort study
      Lei Liu, Shangdong Qin, Kongying Lin, Qingguo Xu, Yuan Yang, Jinzhen Cai, Yongyi Zeng, Shengxian Yuan, Bangde Xiang, Wan Yee Lau, Weiping Zhou
      International Journal of Surgery.2024; 110(6): 3401.     CrossRef
    • Prognostic nomogram based on the gamma-glutamyl transpeptidase-to-platelet ratio for patients with compensated cirrhotic hepatocellular carcinoma after local ablation
      Wenying Qiao, Jiashuo Li, Peiyi Wang, Yuanyuan Zhang, Ronghua Jin, Jianjun Li
      Frontiers in Oncology.2024;[Epub]     CrossRef
    • A Novel Risk-Predicted Nomogram for Perioperative Ischemic Complications of Endovascular Treatment Among Ruptured Anterior Communicating Artery Aneurysms
      Wei Shang, Xiaoting Chang, Yousong Xu, Bin Dong
      World Neurosurgery.2023; 173: e391.     CrossRef
    • Time to surgery is not an oncological risk factor in HCC patients undergoing liver resection
      Carlos Constantin Otto, Guanwu Wang, Anna Mantas, Daniel Heise, Philipp Bruners, Sven Arke Lang, Tom Florian Ulmer, Ulf Peter Neumann, Lara Rosaline Heij, Jan Bednarsch
      Langenbeck's Archives of Surgery.2023;[Epub]     CrossRef
    • Inflammation-related nomogram for predicting survival of patients with unresectable hepatocellular carcinoma received conversion therapy
      Jia-Lin Wu, Jun-Yang Luo, Zai-Bo Jiang, Si-Bo Huang, Ge-Run Chen, Hui-Ying Ran, Qi-Yue Liang, Ming-Sheng Huang, Li-Sha Lai, Jun-Wei Chen
      World Journal of Gastroenterology.2023; 29(20): 3168.     CrossRef
    • Prognostic impact of gamma-glutamyl transpeptidase to platelets ratio on hepatocellular carcinoma patients who have undergone surgery: a meta-analysis and systematic review
      Yang Zhang, Fangfang Jin, Yuan Wu, Bingyu Wang, Jingri Xie, Yu Li, Yujia Pan, Zhaolan Liu, Wenjuan Shen
      European Journal of Gastroenterology & Hepatology.2023; 35(8): 803.     CrossRef
    • Estimating surgical probability: Development and validation of a prognostic model for patients with lumbar disc herniation treated with acupuncture
      Di Chen, Zimeng Lv, Yicheng Wu, Panfu Hao, Liu Liu, Bin Pan, Haiping Shi, Youlu Che, Bo Shen, Peng Du, Xiaohua Si, Zhongling Hu, Guorui Luan, Mingxin Xue
      Medicine.2023; 102(48): e36425.     CrossRef
    • Clinical significance of Osaka prognostic score based on nutritional and inflammatory status in patients with esophageal squamous cell carcinoma
      Jifeng Feng, Lifen Wang, Liang Wang, Xun Yang, Guangyuan Lou
      BMC Cancer.2022;[Epub]     CrossRef
    • Pathologic Complete Response Prediction to Neoadjuvant Immunotherapy Combined with Chemotherapy in Resectable Locally Advanced Esophageal Squamous Cell Carcinoma: Real-World Evidence from Integrative Inflammatory and Nutritional Scores
      Jifeng Feng, Liang Wang, Xun Yang, Qixun Chen, Xiangdong Cheng
      Journal of Inflammation Research.2022; Volume 15: 3783.     CrossRef
    • Serum levels of inflammatory markers CRP, ESR and albumin in relation to survival for patients with hepatocellular carcinoma
      Hikmet Akkiz, Brian I. Carr, Harika G. Bag, Ümit Karaoğullarından, Kendal Yalçın, Nazim Ekin, Ayşegül Özakyol, Engin Altıntaş, Hatice Y. Balaban, Halis Şimşek, Ahmet Uyanıkoğlu, Ayhan Balkan, Sedef Kuran, Oğuz Üsküdar, Yakup Ülger, Burak Güney, Anil Delik
      International Journal of Clinical Practice.2021;[Epub]     CrossRef
    • Development and validation of a nomogram to predict the mortality risk in elderly patients with ARF
      Junnan Xu, Jie Weng, Jingwen Yang, Xuan Shi, Ruonan Hou, Xiaoming Zhou, Zhiliang Zhou, Zhiyi Wang, Chan Chen
      PeerJ.2021; 9: e11016.     CrossRef
    • A new model based on gamma-glutamyl transpeptidase to platelet ratio (GPR) predicts prognostic outcome after curative resection of solitary hepatocellular carcinoma
      Dongye Yang, Hongliang Wu, Wenxiong Nong, Min Zheng, Angui Li, Yang Wang, Mu Li, Qian Chen, Shengguang Yuan, Junxiong Yu, Weijia Liao
      Clinics and Research in Hepatology and Gastroenterology.2021; 45(5): 101509.     CrossRef
    • Naples Prognostic Score: A Novel Prognostic Score in Predicting Cancer-Specific Survival in Patients With Resected Esophageal Squamous Cell Carcinoma
      Ji-Feng Feng, Jian-Ming Zhao, Sheng Chen, Qi-Xun Chen
      Frontiers in Oncology.2021;[Epub]     CrossRef
    • Development of pre and post‐operative nomograms to predict individual survival for ideal liver resection candidates with hepatocellular carcinoma
      Jinshu Zeng, Jianxing Zeng, Jingfeng Liu, Jinhua Zeng
      Liver International.2021; 41(12): 2974.     CrossRef
    • Development and validation of prognostic nomograms in patients with hepatocellular carcinoma: a population-based study
      Youya Zang, Peiyun Long, Ming Wang, Shan Huang, Chuang Chen
      Future Oncology.2021; 17(36): 5053.     CrossRef
    • Albumin-Bilirubin (ALBI) and Monocyte to Lymphocyte Ratio (MLR)-Based Nomogram Model to Predict Tumor Recurrence of AFP-Negative Hepatocellular Carcinoma
      Shuqi Mao, Xi Yu, Yuying Shan, Rui Fan, Shengdong Wu, Caide Lu
      Journal of Hepatocellular Carcinoma.2021; Volume 8: 1355.     CrossRef
    • Prognostic Nomogram for Patients with Radical Surgery for Non-Metastatic Colorectal Cancer Incorporating Hematological Biomarkers and Clinical Characteristics


      Peiyun Long, Youya Zang, Huan Wang, Xiumei Liang, Xuekun Xie, Zhiwei Han, Dongyi Lin, Zongyu Wang, Shan Huang, Chuang Chen
      OncoTargets and Therapy.2020; Volume 13: 2093.     CrossRef
    • Novel Prognostic Nomograms for Predicting Early and Late Recurrence of Hepatocellular Carcinoma After Curative Hepatectomy


      Wei Xu, Ruineng Li, Fei Liu
      Cancer Management and Research.2020; Volume 12: 1693.     CrossRef
    • Dynamic Changes in the Neutrophil-to-Lymphocyte Ratio Predict the Prognosis of Patients with Hepatocellular Carcinoma Undergoing Transarterial Chemoembolization


      Hongyu Wang, Chuyang Lin, Wenzhe Fan, Jiang Zhang, Yingqiang Zhang, Wang Yao, Jiaping Li
      Cancer Management and Research.2020; Volume 12: 3433.     CrossRef
    • Combination of preoperative neutrophil-lymphocyte ratio, platelet-lymphocyte ratio and monocyte-lymphocyte ratio: a superior prognostic factor of endometrial cancer
      Rong Cong, Fanfei Kong, Jian Ma, Qing Li, Qijun Wu, Xiaoxin Ma
      BMC Cancer.2020;[Epub]     CrossRef
    • Predictive value of preoperative and postoperative peripheral lymphocyte difference in hepatitis B virus‐related hepatocellular cancer patients: Based on the analysis of dynamic nomogram
      Dingan Luo, Haoran Li, Heng Yu, Mao Zhang, Jianchong Hu, Cheng Jin, Meisze Chua, Bing Han
      Journal of Surgical Oncology.2020; 122(8): 1553.     CrossRef
    • Development and validation of a prognostic model based on the albumin-to-fibrinogen ratio (AFR) and gamma-glutamyl transpeptidase-to-platelet ratio (GPR) in hepatocellular carcinoma patients
      Jinfu Zhang, Tao Wang, Liangliang Xu, Peng Wang, Ming Zhang, Mingqing Xu
      Clinica Chimica Acta.2020; 511: 107.     CrossRef
    • Prognostic Nomograms for Patients with Hepatocellular Carcinoma After Curative Hepatectomy, with a Focus on Recurrence Timing and Post-Recurrence Management


      Wei Xu, Fei Liu, Xianbo Shen, Ruineng Li
      Journal of Hepatocellular Carcinoma.2020; Volume 7: 233.     CrossRef
    • Platelets and Hepatocellular Cancer: Bridging the Bench to the Clinics
      Quirino Lai, Alessandro Vitale, Tommaso Manzia, Francesco Foschi, Giovanni Levi Sandri, Martina Gambato, Fabio Melandro, Francesco Russo, Luca Miele, Luca Viganò, Patrizia Burra, Edoardo Giannini
      Cancers.2019; 11(10): 1568.     CrossRef

    • PubReader PubReader
    • ePub LinkePub Link
    • Cite
      CITE
      export Copy Download
      Close
      Download Citation
      Download a citation file in RIS format that can be imported by all major citation management software, including EndNote, ProCite, RefWorks, and Reference Manager.

      Format:
      • RIS — For EndNote, ProCite, RefWorks, and most other reference management software
      • BibTeX — For JabRef, BibDesk, and other BibTeX-specific software
      Include:
      • Citation for the content below
      Novel Prognostic Nomograms Based on Inflammation-Related Markers for Patients with Hepatocellular Carcinoma Underwent Hepatectomy
      Cancer Res Treat. 2019;51(4):1464-1478.   Published online March 11, 2019
      Close
    • XML DownloadXML Download
    Novel Prognostic Nomograms Based on Inflammation-Related Markers for Patients with Hepatocellular Carcinoma Underwent Hepatectomy
    Image Image Image Image Image
    Fig. 1. The workflow diagram of patient selection. HCC, hepatocellular carcinoma; HBsAg, hepatitis B virus surface antigen; FAHSYSU, First Affiliated Hospital of Sun Yat-sen University; SYSUCC, Sun Yat-sen University Cancer Center.
    Fig. 2. Nomograms for predicting recurrence-free survival (A) and overall survival (B). NLR, neutrophil to lymphocyte ratio; GPR, gamma-glutamyl transpeptidase to platelet ratio; INR, international normalized ratio; TBIL, total bilirubin; AFP, α-fetoprotein.
    Fig. 3. The calibration curves for predicting the 1-, 2-, and 3-year recurrence-free survival and overall survival in the training (A, B), internal validation (C, D), and external validation (E, F) cohorts.
    Fig. 4. Receiver operating characteristic curves for recurrence-free survival and overall survival in the training (A, B), internal validation (C, D), and external validation (E, F) cohorts, respectively.
    Fig. 5. Patients’ recurrence-free survival and overall survival rates according to the nomogram model in the training (A, B), internal validation (C, D), and external validation (E, F) cohorts. Green line for high-risk, red line for medium-risk, blue line for low-risk.
    Novel Prognostic Nomograms Based on Inflammation-Related Markers for Patients with Hepatocellular Carcinoma Underwent Hepatectomy
    Variable Total (n=889) Training cohort (n=457) Internal cohort (n=197) p-valuea) External cohort (n=235) p-valueb)
    Age (yr) 50.4 (42.9-59.0) 51.5 (43.3-58.7) 49.0 (42.4-58.6) 0.291 50.2 (42.4-59.7) 0.799
    Sex, female/male 98/791 (11.0/89.0) 55/402 (12.0/88.0) 25/172 (12.7/87.3) 0.814 18/217 (7.7/92.3) 0.076
    Leukocyte (×109/L) 6.1 (4.9-7.5) 6.2 (5.0-7.6) 6.2 (5.0-7.8) 0.706 5.9 (4.8-7.1) 0.095
    Neutrophil ratio 0.6 (0.5-0.6) 0.6 (0.5-0.6) 0.6 (0.5-0.7) 0.605 0.6 (0.5-0.6) 0.543
    Monocyte ratio 0.1 (0.1-0.1) 0.1 (0.1-0.1) 0.1 (0.1-0.1) 0.841 0.1 (0.1-0.1) < 0.001
    Lymphocyte ratio 0.3 (0.2-0.4) 0.3 (0.2-0.4) 0.3 (0.2-0.3) 0.372 0.3 (0.2-0.4) 0.107
    Haemoglobin (≤ 128 g/L/> 128 g/L) 184/705 (20.7/79.3) 107/350 (23.4/76.6) 44/153 (22.3/77.7) 0.764 33/202 (14.0/86.0) 0.004
    Platelet (×109/L) 181.0 (135.0-225.0) 186.0 (142.0-230.0) 191.0 (150.0-235.0) 0.367 161.6 (122.4-201.9) < 0.001
    Albumin (g/L) 40.2 (37.2-42.9) 39.8 (36.7-42.1) 40.0 (37.0-42.4) 0.388 41.9 (38.9-44.0) < 0.001
    AST (U/L) 39.0 (29.0-60.0) 39.0 (29.0-63.0) 42.0 (32.0-62.0) 0.154 37.5 (27.8-51.4) 0.045
    ALT (U/L) 39.0 (27.3-58.0) 38.0 (26.0-56.0) 42.0 (31.0-65.0) 0.024 40.4 (27.6-57.9) 0.345
    GGT (U/L) 68.3 (41.0-129.0) 71.0 (43.0-134.0) 81.0 (46.0-172.0) 0.155 52.4 (34.7-88.5) < 0.001
    TBIL (> 12.5 μmol/L/≤ 12.5 μmol/L) 522/367 (58.7/41.3) 270/187 (59.1/40.9) 119/78 (60.4/39.6) 0.751 133/102 (56.6/43.4) 0.530
    PT (> 12.8 sec/≤ 12.8 sec) 330/559 (37.1/62.9) 198/259 (43.3/56.7) 91/106 (46.2/53.8) 0.498 41/194 (17.4/82.6) < 0.001
    INR (> 1.08/≤ 1.08) 403/486 (45.3/54.7) 222/235 (48.6/51.4) 103/94 (52.3/47.7) 0.384 78/157 (33.2/66.8) < 0.001
    Alpha-fetoprotein (μg/L)c)
     ≤ 20 267 (30.0) 136 (29.8) 52 (26.4) 0.654 79 (33.6) 0.297
     20-200 212 (23.8) 104 (22.8) 49 (24.9) 59 (25.1)
     > 200 410 (46.1) 217 (47.5) 96 (48.7) 97 (41.3)
    Performance status (0/≥ 1) 849/40 (95.5/4.5) 431/26 (94.3/5.7) 185/12 (93.9/6.1) 0.840 233/2 (99.1/0.9) 0.002
    Child-Pugh score (A/B) 853/36 (96.0/4.0) 427/30 (93.4/6.6) 190/7 (96.4/3.6) 0.057 233/2 (99.1/0.9) 0.001
    BCLC stagec)
     0/A 539 (60.6) 240 (52.5) 101 (51.3) 0.658 198 (84.3) < 0.001
     B 91 (10.2) 55 (12.0) 20 (10.2) 16 (6.8)
     C 259 (29.1) 162 (35.4) 76 (38.6) 21 (8.9)
    Tumor number
     1 682 (76.7) 335 (73.3) 145 (73.6) 0.728 202 (86.0) 0.001
     2-3 117 (13.2) 69 (15.1) 26 (13.2) 22 (9.4)
     > 3 90 (10.1) 53 (11.6) 26 (13.2) 11 (4.7)
    Tumor diameter (≤ 5 cm/> 5 cm) 383/506 (43.1/56.9) 177/280 (38.7/61.3) 77/120 (39.1/60.9) 0.932 129/106 (54.9/45.1) < 0.001
    Tumor differentiation (I-II/III-IV) 736/153 (82.8/17.2) 368/89 (80.5/19.5) 163/34 (82.7/17.3) 0.506 205/30 (87.2/12.8) 0.027
    Cirrhosis (yes/no) 586/303 (65.9/34.1) 280/177 (61.3/38.7) 122/75 (61.9/38.1) 0.874 184/51 (78.3/21.7) < 0.001
    Satellite lesions (yes/no) 148/741 (16.6/83.4) 90/367 (19.7/80.3) 45/152 (22.8/77.2) 0.361 13/222 (5.5/94.5) < 0.001
    Microvascular invasion (yes/no) 378/511 (42.5/57.5) 180/277 (39.4/60.6) 80/117 (40.6/59.4) 0.056 102/133 (43.4/56.6) 0.308
    Macrovascular invasion (yes/no) 224/665 (25.2/74.8) 137/320 (30.0/70.0) 66/131 (33.5/66.5) 0.371 21/214 (8.9/91.1) < 0.001
    Tumor capsulec)
     Complete 646 (72.7) 381 (83.4) 152 (77.2) 0.129 113 (48.1) < 0.001
     Incomplete 167 (18.8) 68 (14.9) 42 (21.3) 57 (24.3)
     Absence 76 (8.5) 8 (1.8) 3 (1.5) 65 (27.7)
    Resection margin (> 1 cm /≤ 1 cm) 731/158 (82.2/17.8) 363/94 (79.4/20.6) 152/45 (77.2/22.8) 0.050 216/19 (91.9/8.1) < 0.001
    NLR (≤ 1.91/> 1.91) 409/480 (46.0/54.0) 206/251 (45.1/54.9) 84/113 (42.6/57.4) 0.565 119/116 (50.6/49.4) 0.165
    PLR (≤ 108.56/> 108.56) 520/369 (58.5/41.5) 254/203 (55.6/44.4) 106/91 (53.8/46.2) 0.676 160/75 (68.1/31.9) 0.001
    LMR (≤ 3.79/> 3.79) 477/412 (53.7/46.3) 261/196 (57.1/42.9) 116/81 (58.9/41.1) 0.674 100/135 (42.6/57.4) < 0.001
    GPR (≤ 0.94/> 0.94) 491/398 (55.2/44.8) 250/207 (54.7/45.3) 101/96 (51.3/48.7) 0.419 140/95 (59.6/40.4) 0.221
    SII (≤ 202.14/> 202.14) 213/676 (24.0/76.0) 110/347 (24.1/75.9) 35/162 (17.8/82.2) 0.075 68/167 (28.9/71.1) 0.165
    PNI (≤ 48.69/> 48.69) 406/483 (45.7/54.3) 233/224 (51.0/49.0) 91/106 (46.2/53.8) 0.261 82/153 (34.9/65.1) < 0.001
    APRI (≤ 0.24/> 0.24) 444/445 (49.9/50.1) 233/224 (51.0/49.0) 98/99 (49.7/50.3) 0.771 113/122 (48.1/51.9) 0.470
    ANRI (≤ 12.82/> 12.82) 480/409 (54.0/46.0) 240/217 (52.5/47.5) 107/90 (54.3/45.7) 0.672 133/102 (56.6/43.4) 0.308
    ALRI (≤ 24.41/> 24.41) 467/422 (52.5/47.5) 242/215 (53.0/47.0) 94/103 (47.7/52.3) 0.219 131/104 (55.7/44.3) 0.486
    Variable Recurrence-free survival
    Hazard ratio (95% CI) p-value
    NLR (> 1.91:≤ 1.91) 1.42 (1.10-1.82) 0.006
    GPR (> 0.94:≤ 0.94) 1.34 (1.04-1.74) 0.025
    INR (> 1.08:≤ 1.08) 1.33 (1.04-1.70) 0.025
    No. of tumors
     1 1.00
     2-3 1.21 (0.88-1.66) 0.241
     > 3 1.75 (1.23-2.48) 0.002
    Tumor diameter (> 5 cm:≤ 5 cm) 1.23 (1.01-1.45) 0.031
    Satellite lesions (yes:no) 1.71 (1.27-2.29) < 0.001
    Microvascular invasion (yes:no) 1.26 (1.06-1.46) 0.027
    Macrovascular invasion (yes:no) 1.50 (1.12-2.00) 0.006
    Variable Overall survival
    Hazard ratio (95% CI) p-value
    GPR (> 0.94:≤ 0.94) 1.35 (1.01-1.69) 0.025
    TBIL (> 12.5 μmol/L:≤ 12.5 μmol/L) 1.58 (1.15-2.17) 0.005
    INR (> 1.08:≤ 1.08) 1.31 (1.02-1.60) 0.026
    α-Fetoprotein (μg/L)
     ≤ 20 1.00
     20-200 1.32 (0.83-2.08) 0.238
     > 200 1.48 (1.01-2.17) 0.044
    Tumor diameter (> 5 cm:≤ 5 cm) 1.92 (1.33-2.77) 0.001
    Microvascular invasion (yes:no) 1.55 (1.12-2.16) 0.009
    Macrovascular invasion (yes:no) 1.77 (1.26-2.50) 0.001
    Satellite lesions (yes: no) 2.32 (1.64-3.29) < 0.001
    Table 1. Baseline characteristics

    Values are presented as median (interquartile range) or number (%). AST, aspartate aminotransferase; ALT, alanine aminotransferase; GGT, gamma-glutamyl transpeptidase; TBIL, total bilirubin; PT, prothrombin time; INR, international normalized ratio; BCLC, Barcelona Clinic Liver Cancer; NLR, neutrophil to lymphocyte ratio; PLR, platelet to lymphocyte ratio; LMR, lymphocyte to monocyte ratio; GPR, GGT to platelet ratio; SII, systemic immune-inflammation index; PNI, prognostic nutritional index; APRI, AST to platelet ratio index; ANRI, AST to neutrophil ratio index; ALRI, AST to lymphocyte ratio index.

    p-value between training and internal validation cohorts,

    p-value between training and external validation cohorts,

    Percentage may not total 100 because of rounding.

    Table 2. Multivariate analysis of recurrence-free survival in the training cohort

    CI, confidence interval; NLR, neutrophil to lymphocyte ratio; GPR, gamma-glutamyl transpeptidase to platelet ratio; INR, international normalized ratio.

    Table 3. Multivariate analysis of overall survival in the training cohort

    CI, confidence interval; GPR, gamma-glutamyl transpeptidase to platelet ratio; TBIL, total bilirubin; INR, international normalized ratio.


    Cancer Res Treat : Cancer Research and Treatment
    Close layer
    TOP