Introduction
Gastric cancer (GC) is the fifth most common cancer worldwide, and the third leading cause of cancer-related death [1]. It is also the third leading cause of cancer-related death in Korea, where it is the second most common malignancy [2]. Despite progress in cancer therapies, treatment for unresectable or metastatic/recurrent GC remains a significant challenge. Palliative chemotherapy is considered as a cornerstone of treatment for patients with metastatic or recurrent GC [3]. Both quality of life (QOL) and survival have shown improvement as a result of palliative chemotherapy [4,5]. Recently, targeted agents and cancer immunotherapy have led to better outcomes for patients with metastatic or recurrent GC [6,7].
QOL is an exceedingly important issue in the palliative setting. Indeed, a major barrier to palliative chemotherapy is a worry about decreased QOL due to the chemotherapy. Early integration of palliative care has been found to improve QOL and survival in patients with metastatic cancer [8]. However, there is little evidence on the real-world QOL changes during chemotherapy in patients with unresectable or metastatic/recurrent GC.
Korea and Japan both have effective screening programs and clinical practice guidelines for patients with GC [9]. The practice guidelines for palliative chemotherapy are based on evidence collected globally and domestically, and are adopted to harmonize the medical practices within individual countries. Despite the availability of these country-specific clinical practice guidelines, there is still no consensus on a standard chemotherapy for patients with GC, as demonstrated by the global registry of GC treatment evaluation (REGATE) study [10,11]. Specifically, the REGATE study revealed that the disease characteristics and treatment patterns for GC varied across countries.
Therefore, in this prospective observational study, we investigated the chemotherapy patterns and QOL changes during first-line palliative chemotherapy among Korean patients with unresectable or metastatic/recurrent GC.
Materials and Methods
1. Study design and patients
This was a non-interventional, multi-center, prospective, observational study of chemotherapy and QOL in patients with unresectable locally advanced or metastatic/recurrent GC. The formal title of the study is Registry of Chemotherapy and Quality of Life in Unresectable Locally Advanced and Metastatic Gastric Cancer (REQUEST). From September 2010 to December 2012, 532 patients at 26 sites in Korea were enrolled. The inclusion criteria for patients (who were all aged > 20 years) were having histologically confirmed unresectable locally advanced or metastatic/recurrent gastric adenocarcinoma, an Eastern Cooperative Oncology Group (ECOG) performance status of 0-2, an expected survival of > 3 months, and no prior palliative chemotherapy for GC. The exclusion criteria were having participated in a clinical trial with any investigational drug within the 30 days prior to study entry or having comorbidities or organ dysfunctions unsuitable for systemic chemotherapy.
2. Data collection and assessment
All the chemotherapy regimens were chosen at the discretion of each medical oncologist. Patient management was conducted in line with the investigator’s medical judgment, given that this was a non-interventional, observational study. Clinical information on the patients, tumor, applied chemotherapy, response to chemotherapy, and survival was collected prospectively. The QOL assessments were conducted using the European Organization for Research and Treatment of Cancer (EORTC) Quality of Life Questionnaires (QLQ)-C30 and QLQ-STO22 [12,13]. Patients’ tumor response was evaluated using the Response Evaluation Criteria in Solid Tumors guideline ver. 1.1 [14]. Both the QOL assessment and collection of other data were conducted before the initiation of chemotherapy as well as 3, 6, 9, and 12 months after (±2 weeks). After 12 months, patient survival was followed up by telephone every 3 months up to 24 months.
The QLQ-C30 comprises a single global health status/QOL scale, five functional scales, and nine symptom scales. The QLQ-STO22 comprises 22 items evaluating patients’ disease and treatment-related symptoms, nutritional aspects, and emotional problems. All the scales and single-item measures had scores ranging from 0 to 100, which were the result of standardizing the raw scores via linear transformation. Higher scores indicated a greater response—in other words, a higher score on a functional scale indicates a more healthy level of functioning, a higher score on the global health status/QOL scale indicates a higher QOL, and a higher score on a symptom scale indicates more severe symptomatology or problems.
3. Statistical analysis
Based on the annual report of the Korean National Health Insurance Corporation, there were 90,023 patients with GC in 2008, of which 22,491 were newly diagnosed. Based on this population, we calculated the minimum sample size by applying a 5% margin of error at 95% confidence interval (CI), and using simple random sampling; assuming a 100% response rate, at least 380 patients would be needed for sufficient power. We expected a drop-out rate of at least 10%, so approximate 500 patients were considered as a sufficient sample for this study.
The continuous variables were summarized using descriptive statistics such as the mean, standard deviation, median, and range, whereas categorical variables were summarized using frequencies and percentages. Changes in QOL were determined by subtracting the baseline QOL score from the QOL score measured after treatment, and the results were assessed in line with Osoba et al.’s method [15]: a change of less than 5 points from the baseline was considered as “no change,” a change of 5-10 points was considered “a little,” a change of 11-20 points was considered “moderate,” and a change of greater than 20 was considered “very much.” The difference between baseline and best QOL scores was analyzed using the paired t-test and the Wilcoxon signed rank test. A patient’s overall survival (OS) was defined as the time from enrolment until death, regardless of the cause of death. All patients who were lost to follow up or were alive by the end of the study were censored at the date of their last confirmed survival. We also measured progression-free survival (PFS), which was defined as the time from enrolment until confirmed progressive disease (PD) to first-line palliative chemotherapy or death regardless of cause. Patients who were lost to follow up or who switched to a different chemotherapy without progression to first-line palliative chemotherapy were censored at the last visit date during the firstline palliative chemotherapy. Finally, patients who showed no PD or were not dead at the end of the study were censored at the end-of-study visit. The Kaplan-Meier method was used to analyze the OS and PFS, and the median survival time and 95% CI are reported.
4. Ethical statement
This study was conducted in compliance with the Good Epidemiological Practice guidelines and this report was prepared in accordance with the “strengthening the reporting of observational studies in epidemiology (STROBE)” statement. All patients gave their written informed consent, and the institutional review board at each participating center approved this study.
Results
1. Patient disposition
A total of 532 patients were enrolled. Five of these patients were ultimately excluded because they were participating in other investigational studies, so 527 patients were included in the analysis. The survival and tumor progression of one patient could not be verified; as such, the analyses on PFS and OS were conducted for 526 patients. As of the date of the data cut-off (December 13, 2014), 54.2% (285/526) patients were reported to be alive; the rest were dead.
2. Patients and chemotherapy
The patient characteristics are shown in Table 1. Patients’ median age was 60 years (range, 25 to 86 years) and their median body mass index was 21.0 kg/m2 (range, 14.7 to 33.1 kg/m2). Most patients were male (72.1%) and had an ECOG performance status of 0 or 1 (95.1%). The majority of the patients had a primary tumor location in the body (49.4%) or antrum (43.0%). Of the 527 analyzed patients, 210 (39.9%) had undergone previous gastrectomy.
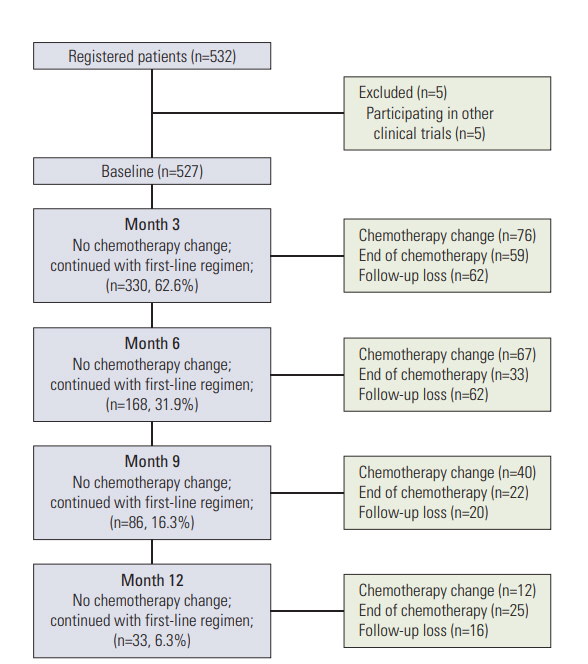
First-line palliative chemotherapy began in all 527 patients. The changes to second-line palliative chemotherapy at 3, 6, 9, and 12 months are shown in Fig. 1. At 3, 6, 9, and 12 months, 330 (62.6%), 168 (31.9%), 86 (16.3%), and 33 (6.3%) patients, respectively, continued first-line palliative chemotherapy. Of the 527 patients, a total of 195 (37.0%) began second-line palliative chemotherapy over the 12-month study period. The details of the first- and second-line palliative chemotherapy regimens are shown in Table 1. During first-line palliative chemotherapy, combination chemotherapy was more common than monotherapy (93.2% vs. 6.8%, respectively). Of the 491 patients who received combination chemotherapy, the fluoropyrimidine plus platinum doublet regimens were the most common (401/491, 81.7%), and among these regimens, the most popular was 5-fluorouracil plus oxaliplatin and capecitabine plus oxaliplatin. The 36 patients who received monotherapy as their first-line palliative chemotherapy predominately received fluoropyrimidine (22/36, 61.1%).
Although monotherapy was more frequently used as a second-line palliative chemotherapy (36.4%) than as a first-line one (6.8%), combination chemotherapy regimens were still the most popular (63.6%). The most commonly used combination chemotherapy regimens for second-line treatment were irinotecan plus 5-fluorouracil and fluoropyrimidine plus platinum. Among the monotherapy regimens, fluoropyrimidine alone was most frequently used, followed by taxane monotherapy.
3. Efficacy of first-line palliative chemotherapy
During the first-line palliative chemotherapy, tumor response could be evaluated in 385 patients (Table 2). Among these response-evaluable patients, 3.1% (12/385) and 27.0% (104/385) showed a complete response (CR) and a partial response (PR), respectively; therefore, the objective response rate was 30.1% (116/385). In addition, 53.8% (207/385) and 16.1% (62/385) of patients showed stable disease (SD) and PD, respectively. The disease control rate was 83.9% (323/385).
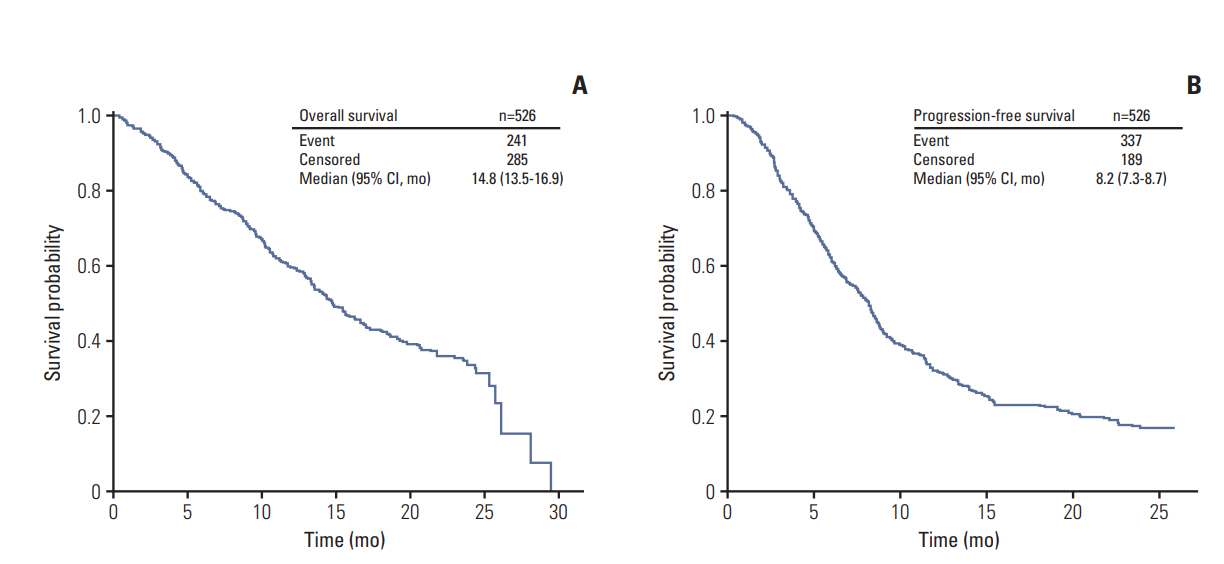
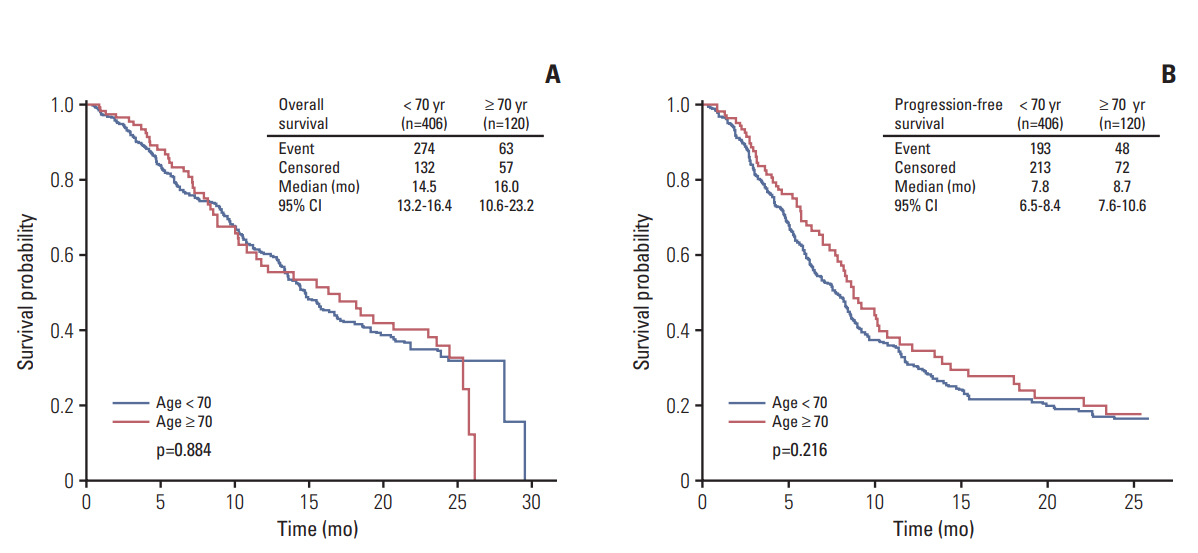
The median OS and PFS following first-line palliative chemotherapy were 14.8 months (95% CI, 13.5 to 16.9) and 8.2 months (95% CI, 7.3 to 8.7), respectively (Fig. 2). A comparison of survival outcomes between patients aged < 70 and ≥ 70 years is shown in Fig. 3; the results showed no difference in either OS or PFS between patients aged < 70 and ≥ 70 years (p=0.884 and p=0.216, respectively). According to the presence of previous gastrectomy history, the median OS and PFS of patients who have undergone gastrectomy were longer than those without gastrectomy (p < 0.001 and p=0.001, respectively) (S1 Fig.).
4. QOL during first-line palliative chemotherapy
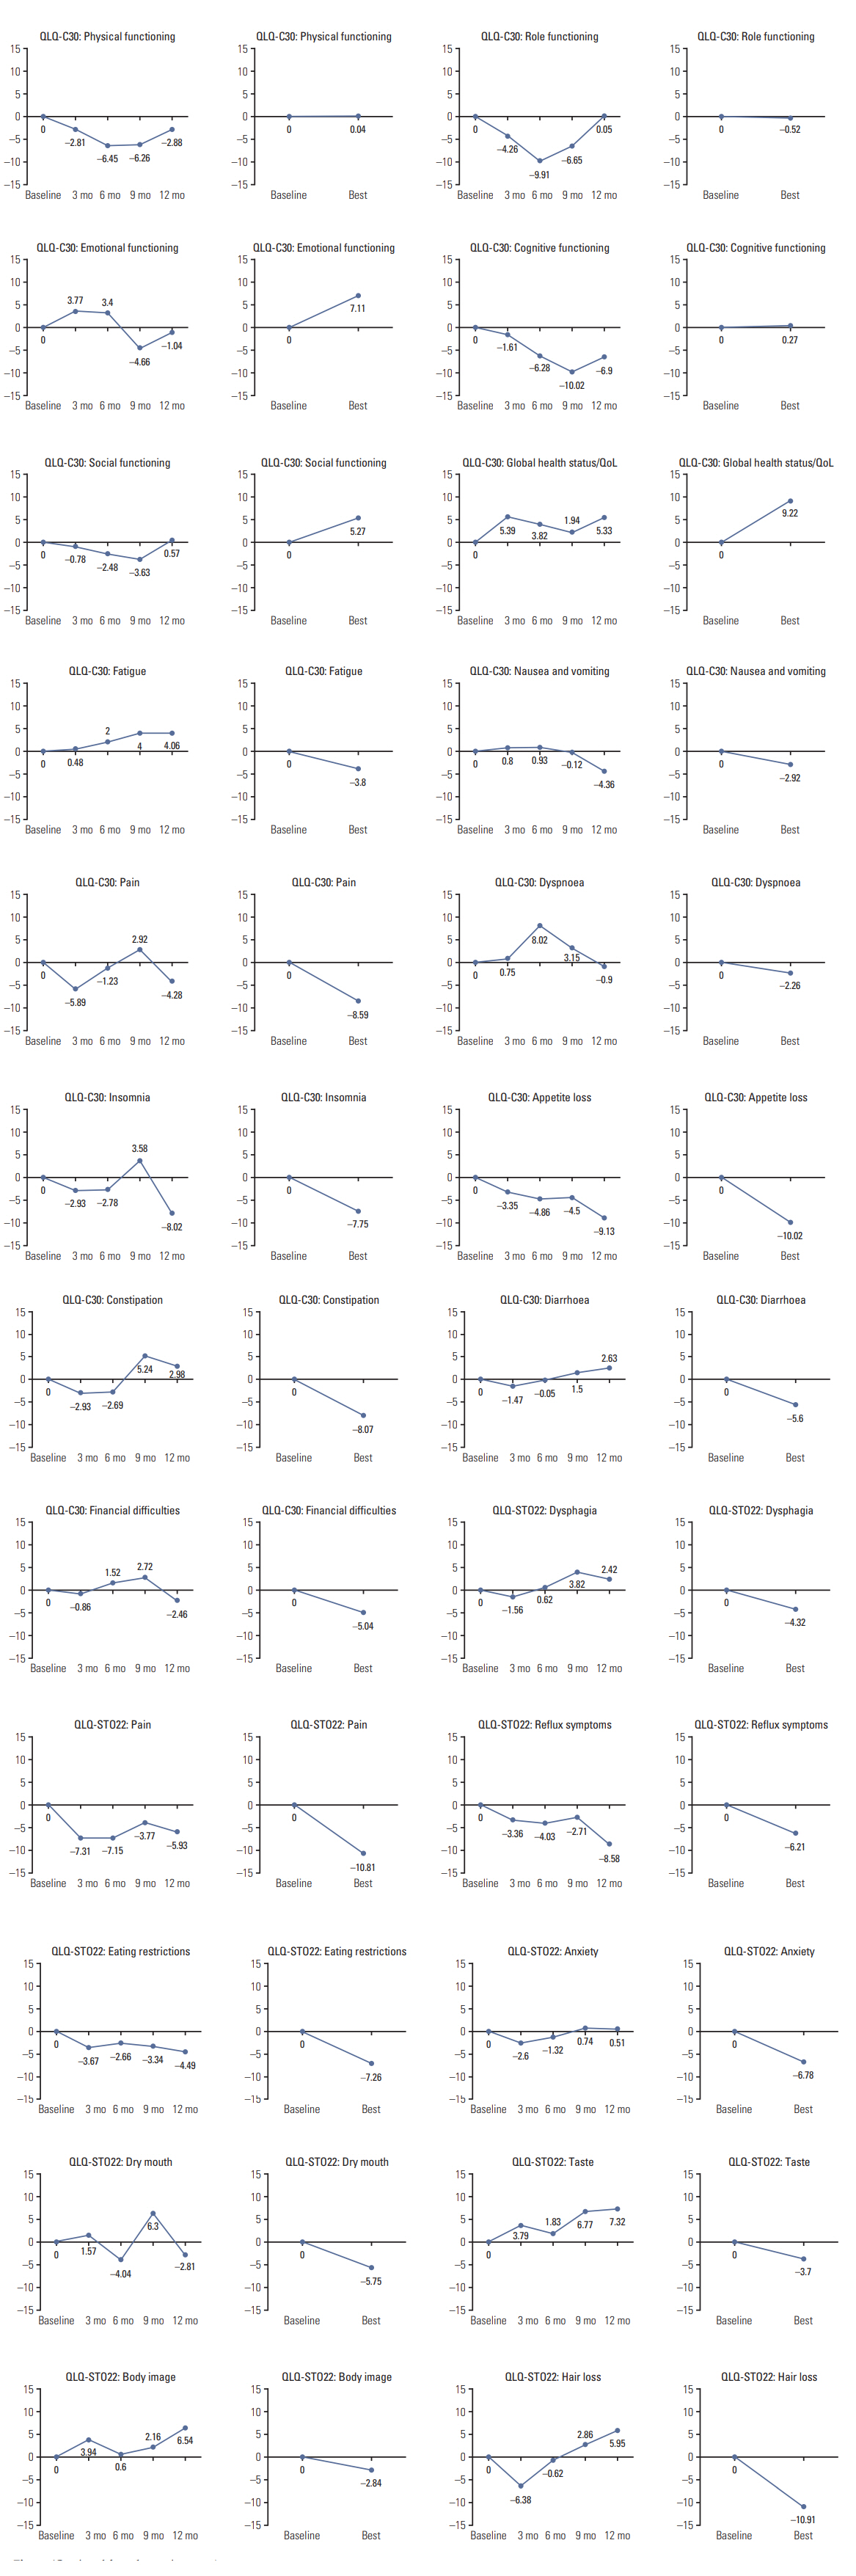
The change in QOL during the first-line palliative chemotherapy is shown in Fig. 4 and S2 Table. When using Osoba et al.’s method [15], we observed no “moderate” or “very much” changes (i.e., a change of ≥ 11 points from baseline) in QOL during first-line palliative chemotherapy. “A little” change (5-10 points from baseline) was observed in physical functioning, role functioning, cognitive functioning, global health status, pain, dyspnea, insomnia, appetite loss, constipation, reflux symptoms, dry mouth, taste, body image, and hair loss. The physical, role, and cognitive functioning domains were somewhat worse at certain time points compared to baseline, whereas the other aspects of functioning did not change. Global health status/QOL showed “a little” improvement over the baseline value. As for the symptoms, pain, insomnia, appetite loss, reflux symptoms, and hair loss showed “a little” improvements at some time points during the 12 months. Dyspnea, constipation, dry mouth, taste, body image, and hair loss showed “a little” worsening at some time points.
As for the change in the best QOL scores compared with the baseline during first-line palliative chemotherapy, emotional functioning, social functioning, and global health status/QOL showed “a little” improvements with statistical significance (p < 0.05; Wilcoxon signed-rank test). Additionally, most symptoms showed significant, but "a little" improvements (p < 0.05), except for fatigue, nausea and vomiting, diarrhea, dysphagia, taste, and body image, none of which showed significant alterations (p > 0.05).
We compared changes in QOL during first-line palliative chemotherapy between responders (i.e., patients with CR or PR) and non-responders (patients with SD or PD) (Table 3). When the analysis was conducted in patients who received first-line chemotherapy including all chemotherapy regimens, we found no significant differences in any of the QOL parameters between the two groups (Table 3). When the same analyses were conducted for patients who received oxaliplatin plus fluoropyrimidine (5-fluorouracil or capecitabine) as first-line chemotherapy, eating restrictions by QLQ-STO22 was found to be significantly improved in responders compared with non-responders (S3 Table). In addition, we compared changes in QOL between diseasecontrolled group (i.e., patients with CR, PR, or SD) and disease-uncontrolled group (patients with PD). In patients who received first-line therapy including all chemotherapy regimens, we found that pain and anxiety by QLQ-STO22 were significantly improved in disease-controlled group compared with uncontrolled group (S3 Table). In patients who received oxaliplatin plus fluoropyrimidine as first-line chemotherapy, however, the number of patients who had PD and answered the follow-up QOL questionnaires (in diseaseuncontrolled group) was too small, and thus statistical analysis could not be carried out.
Discussion
This observational study, performed in a real-world setting, provides information on chemotherapy patterns and changes in chemotherapy-related QOL in Korean patients with GC. We found that combination therapy was the most commonly used during first- and second-line palliative chemotherapy. The most common regimen during first-line treatment was fluoropyrimidine plus platinum, which accords with the global treatment pattern for metastatic or recurrent GC [16]. Furthermore, the median PFS and OS after first-line palliative chemotherapy were 8.2 and 14.8 months, respectively. Age did not appear to influence survival outcomes. QOL did not show more than ”a little” change during first-line palliative chemotherapy, and some QOL domains (including various aspects of functioning, global health status/QOL, and symptoms) even showed improvements.
Doublet chemotherapy regimens were evidently preferred for first-line palliative chemotherapy in Korea. A recent retrospective analysis of de-identified patient-level data from medical charts confirmed this, and specified that fluoropyrimidine and platinum agents were most preferred [17]. A meta-analysis of randomized trials by Wagner et al. [18] showed that combination chemotherapy led to significantly better treatment outcomes compared to monotherapy. Several studies have shown that triplet therapy leads to better outcomes in terms of survival and disease response than doublet therapy [18,19]. However, these data need to be carefully interpreted because triplet therapies have also been found to have minimal survival benefit and profoundly increased toxicities compared with doublet therapy [20]. Accordingly, doublet chemotherapy regimens—which provide greater anticancer effects than monotherapy regimens and result in lower toxicity than triplet regimens—are preferred by both the National Comprehensive Cancer Network (NCCN) and European Society for Medical Oncology (ESMO) guidelines over triplet therapies [20]. Therefore, the present study verifies that Korean oncologists appear to follow these guidelines, as they predominantly use fluoropyrimidine plus platinum doublet therapy over monotherapy or triplet therapy as the first-line treatment. Additionally, in our study, oxaliplatin was more commonly used than cisplatin in the fluoropyrimidine plus platinum regimens. Similarly, capecitabine, an oral medication, was more commonly used than intravenous 5-flurouracil. Oxaliplatin plus 5-flurouracil was the most widely used first-line therapy in our study, which accords with the findings of several studies demonstrating the efficacy and safety of oxaliplatin, leucovorin, and 5-flurouracil combination therapy in Korean patients with advanced GC, irrespective of their age, for both first-line and salvage therapy [21,22]. Oxaliplatin plus capecitabine was also widely used, and might have been preferred in cases where 5-flurouracil infusion was inconvenient.
A recent randomized phase III study showed that secondline therapy leads to increased OS when compared to supportive care alone [23,24]. In these phase III studies, a single agent (taxane or irinotecan) was used. While there are no solid data showing that combination chemotherapy is superior to monotherapy in second-line therapy for GC, it is interesting that Korean oncologists still prescribed combination chemotherapy more frequently than monotherapy during the second-line treatment as was found for the first-line treatment. However, the prescription frequency of combination therapy decreased to 63.6% for second-line therapy from the 93.2% for first-line therapy. This is possibly because of the increased number of patients found to be intolerant to combination chemotherapy in the second-line therapy setting.
There is an overall lack of research on QOL in patients with GC treated with first-line palliative chemotherapy in realworld settings, although there have been several previous clinical trials showing that both OS and QOL in patients with advanced GC can be improved via first-line palliative chemotherapy [4,5]. In our study, GC patients were given various chemotherapy agents and we focused on the QOL outcomes thereof. During first-line palliative chemotherapy, we observed no “moderate” or “very much” changes from the baseline. However, global health status/QOL showed maintained or slightly improved scores. Some domains of functioning and symptoms also showed slight improvements. When comparing the best QOL score with the baseline score, we observed that some domains of functioning, global health, and nearly all symptoms showed improvements. These findings indicate that, overall, QOL did not deteriorate in patients with GC during first-line palliative chemotherapy, and was in fact well-maintained.
In addition, when we compared changes in QOL according to tumor response, more improvement in a few QOL parameters was observed in patients whose tumors were shrunk or controlled by palliative chemotherapy than in those whose tumors were not (S3 and S4 Tables). However, changes in most QOL parameters did not significantly differ according to tumor response (Table 3, S3 and S4 Tables). Because we collected the QOL data for first-line chemotherapy every 3 months instead of collecting data at the time point of tumor progression or afterward, most QOL data were gathered while first-line chemotherapy was actively conducted and tumors were well controlled. Therefore, our observation suggests that QOL might be well-maintained regardless of the magnitude of the tumor response if the tumor is effectively controlled by first-line palliative chemotherapy. The changes in QOL might be also different according to the type of administered chemotherapy regimens. In our analyses, the changes in QOL according to tumor response seemed to be a little bit dependent on chemotherapy regimens (all regimens [Table 3] vs. oxaliplatin plus fluoropyrimidine [S3 Table]), although this finding is not conclusive. As sample size in each chemotherapy regimen was not large enough, we could not analyze the changes in QOL per each chemotherapy regimen.
In a previous population-based outcomes study, we identified several barriers for older patients in seeking out highquality medical resources or receiving appropriate treatment. That study showed that age was not an independent prognostic factor for survival in metastatic GC [25]. Furthermore, in older patients with GC, combination chemotherapy might be more effective than monotherapy [26]. Chemotherapy is generally recommended for older cancer patients who have good performance status [27]. In our study, there was no difference in OS or PFS between patients aged < 70 and ≥ 70 years. This finding suggests that older patients with GC who have adequate performance status and medical conditions for receiving chemotherapy will derive roughly the same benefit from first-line palliative chemotherapy as younger patients. In addition, patients with prior gastrectomy had longer OS and PFS than those without gastrectomy. This finding is in accordance with previous studies, which showed the tendency of better prognosis in patients with previous gastrectomy [28,29]. This could be attributed to leadtime bias for early detection of metastatic disease following regular surveillance after radical gastrectomy or different biological characteristics between recurrent disease and initially metastatic disease.
This study has some limitations. First, QOL might differ according to chemotherapy regimens. However, to ensure that the conditions of this study were as realistic as possible, we did not limit the chemotherapy regimens included. Second, participants’ compliance with completing the QOL questionnaires decreased from 95.07% (501/527 patients) to 75.76% (25/33 patients) by the end of the 12-month study period. This trend was similar to the compliance observed for the QLQ-C30 scale in the RAINBOW study [30]. Therefore, patients’ compliance with QOL questionnaires until the end of the observational study should be carefully monitored to assess QOL-related study outcomes. Third, there were no independent reviews of tumor response or disease progression. In addition, tumor evaluation interval using imaging studies was not predefined in this study. These could have influenced the outcome measures. However, we tried to avoid administrative barriers to be able to enroll all patients consecutively because we wanted to represent real-world practice. Lastly, according to the prior use of adjuvant chemotherapy, types of adjuvant chemotherapy regimens and disease-free interval in cases with recurrent GC after curative gastrectomy, the selection of first-line chemotherapy regimens would be different. But, information on adjuvant chemotherapy was not collected in this study.
This study gives some insight into the actual treatment patterns and outcomes among patients with unresectable or metastatic/recurrent GC. By providing data on palliative chemotherapy used in real-world settings in Korea, we hope to improve available guidelines on the treatment of GC. Our study also showed that QOL is well maintained or at least does not deteriorate during first-line palliative chemotherapy. The best QOL scores for most parameters also showed improvement during chemotherapy compared with baseline. This study will help physicians in determining whether chemotherapy will be conducted and which chemotherapy regimens would be selected in patients with advanced GC.