Introduction
The epidemiological features of nasopharyngeal carcinoma (NPC) are unique. Although the incidence is low in most regions of the world, NPC is commonly observed in southern China, with a peak incidence of 50 per 100,000 [1]. Radiotherapy is the principal treatment for non-disseminated NPC due to its radiosensitivity and anatomical location [2,3]. Recent advances in diagnostic imaging based on magnetic resonance imaging (MRI) and the introduction of intensity-modulated radiation therapy (IMRT) have improved survival outcomes in NPC [4-6].
However, longer survival durations mean more patients may suffer secondary primary malignancies (SPMs), which are probably the most devastating late complication after successful treatment for NPC. Although the incidence is relatively low, SPMs represent true clinical entities in cancer management and can be life-threatening. In the conventional radiotherapy era, the incidence of SPMs among patients with NPC varied from 2.0% to 5.6% after a median follow-up of 2.3 to 5.7 years [7-14]. A study conducted by Zhao et al. [15] in 2016 reported the incidence of SPMs among patients treated with IMRT was 2.3% after a median follow-up of 3.8 years. Although this result was concordant with the research conducted in the conventional radiotherapy era, the number of cases assessed by Zhao et al. [15] was too small for a reliable conclusion to be drawn, especially as incidence of SPMs is relatively low. In addition, a previous study [16] concluded that IMRT doubled the risk of radiation-induced SPMs compared to conventional radiotherapy.
Therefore, further large-scale research of the risk of SPMs among patients with NPC treated using IMRT is warranted. As a late complication, the issue of SPMs is most relevant to long-term survivors. However, previous studies did not exclude patients who died shortly after treatment; this may conceal the true incidence of SPMs as patients with short survival durations may not live long enough to be at risk of this late complication.
To address these questions, we conducted a retrospective study of a large cohort of 8,032 patients from an area where NPC is endemic who were treated between 2003 and 2013. We examined the incidence, risk factors and survival impact of SPMs among survivors of NPC in long-term survivors treated with IMRT with or without chemotherapy. This study may assist patient counseling or guide clinicians in the development of more individualized follow-up strategies for patients with NPC.
Materials and Methods
1. Data source
The Intelligence Platform for Cancer Research was established at Sun Yat-sen University Cancer Center, Guangzhou, China in 2015; this big-data platform has been described in detail in our pervious study [17]. Data on 8,032 patients with newly diagnosed, pathologically proven, non-metastatic, previously untreated NPC treated with IMRT±chemotherapy at Sun Yat-sen University Cancer Center between January 2003 and June 2013 was extracted.
The eligibility criteria were: (1) no previous malignancy before NPC or other concomitant malignancy (211 patients were excluded); (2) complete clinicopathologic and treatment data available (209 patients were excluded); and (3) overall survival time and follow-up duration greater than 36 months (1,235 patients were excluded). In total, 6,377 of the 8,032 patients meet these inclusion criteria. All patients were restaged according to the 7th edition of the International Union against Cancer/American Joint Committee on Cancer (UICC/AJCC) system [18]. The baseline clinical and treatment characteristics of the 6,377 patients are listed in Table 1.
2. Clinical treatment
Each patient underwent definitive IMRT. All 6,377 patients underwent a baseline workup before treatment including a medical history, biochemistry and hematology profiles, physical examinations, MRI scan of the neck and nasopharynx, abdominal sonography, and chest radiography. Treatment strategies followed standard protocols, selected on the basis of clinical stage and the general health of the patient. According to institutional guidelines during the study period, we recommended no chemotherapy for stage I, concurrent chemoradiotherapy (CCRT) for stage II and CCRT with or without neoadjuvant chemotherapy/adjuvant chemotherapy for stage III to IVA-B. IMRT was administered using a linear accelerator at 6-8 MV at daily fractions of 2.0 Gy, 5 days per week, as previously described [19].
Neoadjuvant/adjuvant chemotherapy consisted of 2-3 cycles of a platinum-based regimen of two or three drugs. Concurrent chemotherapy consisted of cisplatin weekly or on week 1, 4, and 7 of radiotherapy.
3. Follow-up
Patients were followed-up every 3-6 months during the first 3 years and every 6-12 months thereafter until death or June 31, 2017. Conventional examinations included clinical symptoms, a physical examination, MRI of the neck and nasopharynx, abdominal ultrasonography, or computed tomography (CT), chest radiography or CT, single photon emission computed tomography bone scan, as well as positron emission tomography CT if indicated. Patients were followed-up by telephone interview if their recent examination or test data could not be extracted from the medical records. Response to treatment was assessed 3 months after the end of treatment for NPC in accordance with established guidelines for patients with solid tumors [20].
4. Statistical analysis
Statistical Package for the Social Sciences ver. 22.0 software (IBM Corp., Armonk, NY) was used for all calculations. Follow-up duration was calculated from the date of diagnosis of NPC to date of last contact. Cumulative incidence of SPMs in the corresponding observed years was calculated using Kaplan-Meier method, and log-rank test was used to compare differences in the cumulative incidence rates among the subgroups. The person-time incidence rate of SPMs was defined as the number of counts divided by the total person-years of observation [21]. A p-value of 0.05 or less (in a two-sided test) was considered statistically significant.
All factors with a p-value < 0.05 in univariate logistic regression analysis were included in a multivariate logistic regression analysis to identify independent factors for SPMs. Factors assessed were sex (male vs. female), age (≤ 50 years, > 50 years), history of smoking (yes vs. no), history of alcohol consumption (yes vs. no), T category (T1-2 vs. T3-4), N category (N0-1 vs. N2-3), chemotherapy (yes vs. no), total dose of radiation to primary site (< 70 Gy, ≥ 70 Gy), and re-irradiation (yes vs. no).
Overall survival was calculated using the Kaplan-Meier method and compared with log-rank test. Then Cox proportional hazards model univariate and multivariate analysis were used to assess significant prognostic factors associated with overall survival after adjustment other confounders in patients with NPC. Factors assessed in Cox proportional hazards model univariate analysis were sex (male vs. female), age (≤ 50 years, > 50 years), history of smoking (yes vs. no), history of alcohol consumption (yes vs. no), T category (T1-2 vs. T3-4), N category (N0-1 vs. N2-3), chemotherapy (yes vs. no), total dose of radiation to primary site (< 70 Gy, ≥ 70 Gy), re-irradiation (yes vs. no), and SPM (yes vs. no). Variables achieving significance at a level of p < 0.05 in univariate analysis were included in multivariate analysis for selection of independent prognostic factors for overall survival.
5. Ethical statement
As this was a retrospective study of routine clinical information, a waiver of the requirement for individual informed consent was granted by the institutional ethics committee (approve number: YB2018-48). The authenticity of this article has been validated by uploading the key raw data onto the Research Data Deposit (RDD) public platform (http://www.researchdata.org.cn), with the approval RDD number as RDDA2018000821.
Results
1. Patient characteristics
Median and mean follow-up duration were 62 and 65.37 months, respectively (range, 36 to 154 months); median age at diagnosis of NPC was 50 years old (range, 12 to 85 years) and the male (n=4,728)-to-female (n=1,649) ratio was 2.9:1. Most patients did not have a history of smoking (4,333/6,377, 67.9%) or alcohol consumption (5,646/6,377, 88.5%). The majority of patients (4,596/6,377, 72.1%) received IMRT with chemotherapy and 1,781/6,377 (27.9%) received IMRT alone. Among those patients who received platinum-based chemotherapy, 50.9% patients (2,339/4,596) received neoadjuvant chemotherapy, 81.4% patients (3,741/4,596) received concurrent chemotherapy, 5.3% patients (244/4,596) received adjuvant chemotherapy. A total of 2.4% patients (155/6,377) received re-irradiation due to local or regional recurrence. The characteristics of the patients with NPC are presented in Table 1.
2. Incidence of SPMs
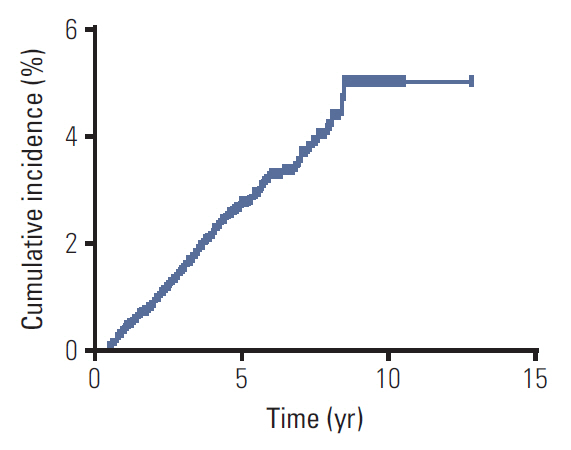
Diagnostic criteria for SPMs were established using a previous report [22]: (1) pathologically proven distinct malignancies distant to the primary tumor or hepatocellular carcinoma diagnosed by imaging and elevated serum alpha-fetoprotein; (2) elimination of the possibility of recurrence or metastasis from the primary tumor; and (3) interval between the end of treatment for NPC and the diagnosis of SPM greater than 6 months. Of the 6,377 patients, 189 (3.0%) developed SPMs after a median follow-up duration of 62 months. Person-time incidence rate of SPMs was 0.55%/yr. The 1-, 2-, 3-, 4-, and 5-cumulative risks of SPMs were 0.4%, 0.9%, 1.6%, 2.2%, and 2.6%, respectively. The cumulative incidence of SPMs is summarized in Fig. 1. Incidence of SPMs in different time periods were detailed in Table 2.
The median age of patients with SPMs at diagnosis of SPMs was 54 years old (range, 27 to 83 years) and the male/female ratio was 5.3:1. The median latency from the first day of IMRT to diagnosis of SPMs was 37 months (range, 6 to 102 months). Lung cancer was the most common SPM (50/6,377, 0.78%), followed by oral cancer (34/6,377, 0.53%), hepatocellular carcinoma (15/6,377, 0.24%), colorectal cancer (12/6,377, 0.19%), and thyroid cancer (12/6,377, 0.19%). The incidence of SPMs at other anatomic locations was relatively low (< 0.15) (Table 3).
3. Risk factors for SPMs
We explored the risk factors for development of SPMs among long-term survivors of NPC using logistic regression analysis. Factors included in univariate logistic regression analysis were as follows: sex (male vs. female), age (≤ 50 years, > 50 years), history of smoking (yes vs. no), history of alcohol consumption (yes vs. no), T category (T1-2 vs. T3-4), N category (N0-1 vs. N2-3), chemotherapy (yes vs. no), total dose of radiation to primary site (< 70 Gy, ≥ 70 Gy), and re-irradiation (yes vs. no). The results of univariate analysis demonstrated sex (p=0.002; hazard ratio [HR], 1.878; 95% confidence interval [CI], 1.266 to 2.786), age (p < 0.001; HR, 1.739; 95% CI, 1.294 to 2.337), N category (p=0.043; HR, 1.351; 95% CI, 1.010 to 1.809), and a history of smoking (p=0.001; HR, 1.651; 95% CI, 1.232 to 2.212) were significantly associated with the development of SPMs. T category (p=0.067; HR, 1.351; 95% CI, 0.979 to 1.863), history of alcohol consumption (p=0.440; HR, 1.184; 95% CI, 0.771 to 1.816), chemotherapy (p=0.054; HR, 1.412; 95% CI, 0.995 to 2.004), re-irradiation (p=0.253; HR, 1.570; 95% CI, 0.725 to 3.398), and total dose of radiation to the primary site (p=0.755; HR, 1.047; 95% CI, 0.784 to 1.399) were not significantly associated with SPMs
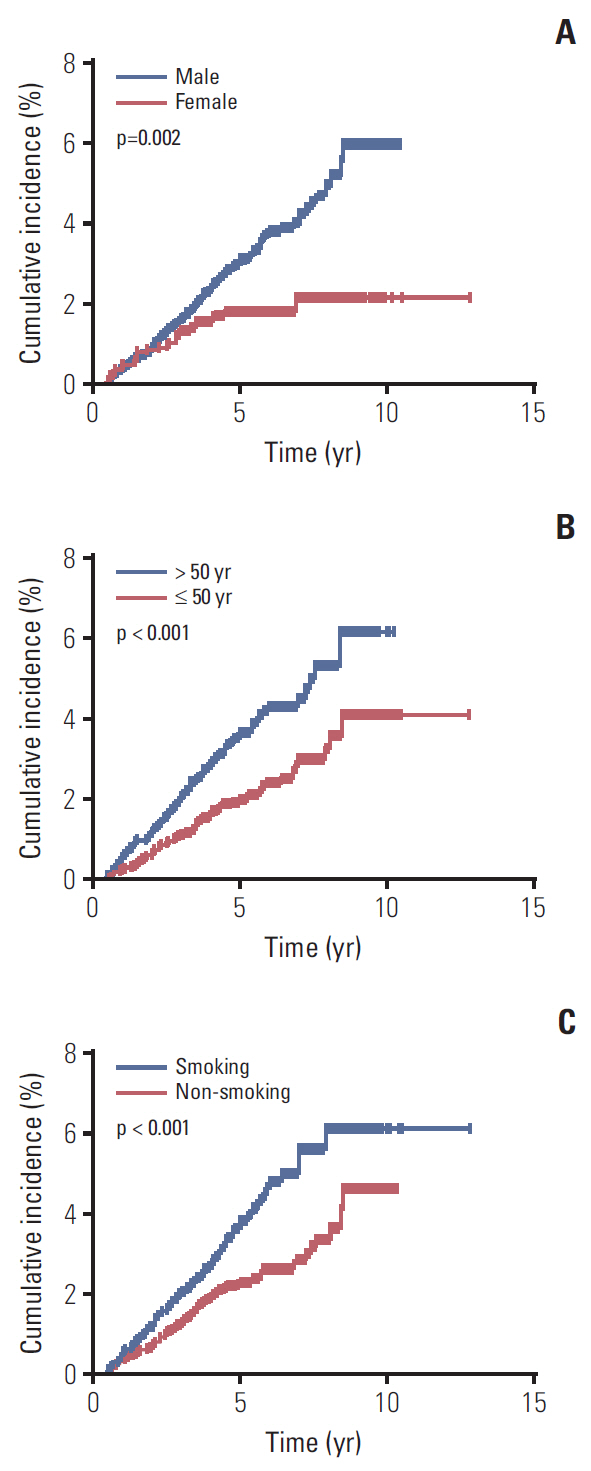
All factors with a p-value of < 0.05 in univariate logistic regression analysis were included in a multivariate logistic regression analysis. The results demonstrated that sex (p=0.018; HR, 1.639; 95% CI, 1.090 to 2.465), age (p=0.001; HR, 1.679; 95% CI, 1.247 to 2.260), and a history of smoking (p=0.027; HR, 1.408; 95% CI, 1.039 to 1.908) were independent risk factors for the development of SPMs (Table 4). Males had a 64% higher risk of developing SPMs than females; patients aged over 50 years had a 68% higher risk of developing SPMs than patients ≤ 50 years old. A history of smoking was associated with a 41% increase in the risk of developing SPMs compared to patients who never smoked. The cumulative incidence of SPMs according to sex, age, and history of smoking is presented in Fig. 2.
4. Survival analysis
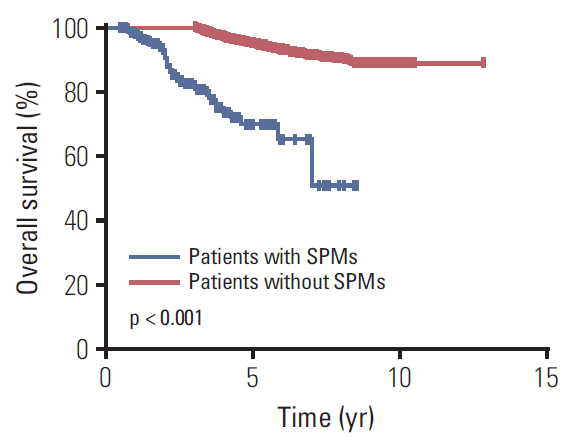
Overall survival was calculated from the date of diagnosis of NPC to the date of either last contact or death. Median overall survival from first diagnosis of NPC was 56 months (range, 36 to 113 months) for patients with SPMs and 62 months (range, 36 to 154 months) for patients without SPMs. The 5-year overall survival rates for patients with and without SPMs were 70.0% and 95.0%, respectively. Kaplan-Meier analysis confirmed the development of a SPM was associated with poorer overall survival in long-term survivors of NPC (p < 0.001) (Fig. 3).
Seven factors including sex (p=0.042; HR, 1.285; 95% CI, 1.009 to 1.638), age (p=0.001; HR, 1.414; 95% CI, 1.159 to 1.725), T category (p < 0.001; HR, 3.246; 95% CI, 2.461 to 4.281), N category (p=0.001; HR, 1.397; 95% CI, 1.143 to 1.706), chemotherapy (p < 0.001; HR, 2.156; 95% CI, 1.641 to 2.834), re-irradiation (p=0.005; HR, 2.008; 95% CI, 1.235 to 3.266), and SPMs (p < 0.001; HR, 4.022; 95% CI, 2.889 to 5.600) were significantly associated with overall survival among long-term survivors in univariate analysis (Table 5). A history of smoking (p=0.790; HR, 1.029; 95% CI, 0.833 to 1.271) and alcohol consumption (p=0.754; HR, 0.950; 95% CI, 0.687 to 1.312) had no influence on overall survival.
Multivariate analysis of overall survival (Table 5) confirmed that age (p=0.003; HR, 1.361; 95% CI, 1.114 to 1.663), T category (p < 0.001; HR, 2.904; 95% CI, 2.197 to 3.839), N category (p=0.024; HR, 1.260; 95% CI, 1.030 to 1.541), chemotherapy (p < 0.001; HR, 1.716; 95% CI, 1.301 to 2.263), re-irradiation (p=0.008; HR, 1.934; 95% CI, 1.188 to 3.149), and SPMs (p < 0.001; HR, 3.560; 95% CI, 2.552 to 4.967) were significantly associated with overall survival.
Discussion
Recent advances in treatment modalities have improved the prognosis of patients with NPC. Thus, more attention is now focused on late complications. Though IMRT minimizes exposure of the surrounding normal tissues to high-dose radiation compared with conventional radiotherapy, an increased volume of the surrounding normal tissues receives low-dose exposure during IMRT [23]. This has led to concerns that SPMs may become a dreaded late complication among long-term survivors of NPC treated with IMRT±chemotherapy. Several large-scale analysis regarding SPMs developing among long-term survivors of NPC after two-dimensional conventional radiotherapy (2D-CRT) and/or three-dimensional conventional radiotherapy was published. However, limited data on SPMs in available from the modern IMRT era [16]. To our knowledge, this is the largest analysis of the risk of SPMs after IMRT in long-term survivors from an area where NPC is endemic to date.
The pathogenesis of SPMs among NPC survivors remains obscure, the occurred of SPMs may attributed to the exposure of radiotherapy or chemotherapy which administrated for NPC, the effect of shared genetic predisposition, or shared environment risk such as smoking. Therefore, the purpose of this study was to investigate the incidence of SPMs following NPC, rather than the incidence of treatment-induced SPMs. In the current study, the incidence of SPMs was 3.0% after a median follow-up of 62 months. In 2016, Zhao et al. [15] reported the incidence of SPMs in a cohort of 527 patients with primary NPC treated with IMRT between 2007 and 2011 was 2.3% after a median follow-up of 3.8 years. Compared to the work by Zhao et al. [15], this study assessed a larger cohort of patients with a longer follow-up duration. In addition, we only included patients who had survived for more than 3 years post-IMRT; as with all late complications, SPMs have a more significant impact on long-term survivors than patients who die shortly after treatment. Therefore, we consider our conclusions are reliable. In the 2D-CRT era, the incidence of SPMs in patients with NPC ranged from 2.0%-5.6% after follow-up durations of 2.3-5.7 years [7-14]. Our study suggests the incidence of SPMs in the modern IMRT is similar to that of the conventional radiotherapy era. The median latency from the first day of IMRT to diagnosis of SPMs in this study was 3.1 years, in agreement with Zhao et al. [15], who reported a median latency of 2.7 years. In corroboration of findings of 2D-CRT studies and the previous IMRT study [15,20], in our cohort of patients, we found lung cancer was the most common SPM.
Our multivariate analysis demonstrated old age (> 50-years-old) was associated with a 68% (HR, 1.679; 95% CI, 1.247 to 2.260) increase in the risk of developing SPMs compared to younger patients (≤ 50-years-old), consistent with Kong et al. [12], who reported a lower HR for the same association. These observations reflect the relationship between the incidence of most primary cancers and age. In addition, a history of smoking was identified as a significant risk factor for SPMs in survivors of NPC (HR, 1.408; 95% CI, 1.039 to 1.908), as previously demonstrated in patients treated with 2D-CRT and IMRT [10,15]. Smoking is strongly associated with the development of numerous cancers, including head and neck cancer, lung cancer and esophageal cancer. Moreover, males had a 64% increase in the risk of SPMs compared to females, in agreement with previous 2D-CRT‒based studies [24]. Interestingly, smoking is significantly more prevalent among males than females in China; this may be one reason for the significantly higher incidence of SPMs in males than females. This assessment of the risk factors for developing SPMs among survivors of NPC treated with IMRT highlights the importance of close follow-up for older male patients with a history of smoking, as this subgroup have the highest risk of developing SPMs.
Another critical issue is whether SPMs have an adverse impact on overall survival in NPC. Our survival curves suggest survivors who develop SPMs have poorer overall survival than survivors without SPMs, consistent with Chen et al. [14]. However, this is the first study to identify SPMs as an adverse independent prognostic factor for overall survival in NPC. Both our data and the study by Chen et al. [14] indicate development of a SPM has an adverse survival impact in NPC; therefore, clinicians need to gain more insight into SPMs as a late complication.
While this was big-data analysis, the limitations of this study need to be addressed. Firstly and most importantly, due to the lack of detail data about cancer incidence among general Chinese population, we cannot quantify standardized incidence ratios of SPMs among NPC survivors. However, our large-scale real word data confirm the actual high SPMs risk experienced by NPC survivors in the era of IMRT. Secondly, inherent biases are unavoidable in retrospective studies; however, our large number of 6,377 patients is definitely a strength for big-data analysis which may minimize the biases as much as possible. Thirdly, the follow-up duration was relatively short. Thus, a prospective study with a longer follow-up duration is warranted to validate the results of this study.
This large-scale retrospective study demonstrates that SPMs as a dreadful complication for long-term survivors of NPC treated with IMRT±chemotherapy, and SPMs negatively impact overall survival in NPC. Physicians should recognize older male patients with a history of smoking have a high risk of developing SPMs. Anatomic locations and risk factors for SPMs in survivors of NPC may help clinicians to design individualized follow-up plans, with specific attention on survivors at high-risk of developing SPMs.