Introduction
Cancer is a global public health concern and the second leading cause of death in the United States and most developed countries [1]. Despite a slight decrease in cancer incidence over the last two decades, cancer prevalence continues to increase due to improved treatment and earlier diagnosis [2].
Historically, advanced or end-stage oncological and hematological patients were, due to their limited prognosis, frequently not referred to intensive care units (ICU). Novel and more efficient anti-neoplastic treatments have resulted in prolonged progression-free and overall survival of oncological and hemato-oncological patients [1]. Consequently, a growing number of cancer patients is at risk of admission to ICU [3]. A recent study from the Netherlands estimates that approximately 6.4% of cancer patients require ICU admission, with admission rates varying considerably by cancer types [4].
Concurrently, the average prognosis of oncological patients remains less than that of the general population, thereby frequently resulting in controversy whether an ICU admission is an appropriate medical choice [3]. While several studies have described the characteristics of oncological patients admitted to ICU, few have investigated trends in hematological and oncological ICU admissions in the United Kingdom [5] and the Netherlands [6,7].
In both settings, the absolute number of oncologic patients admitted to ICU has increased. In the Netherlands, the odds of admission increased by an annualized 6% between 2004 and 2012, while the proportion of oncological patients admitted to British ICUs remained almost unchanged between 1997 and 2013. Of note, the Acute Physiology and Chronic Health Evaluation (APACHE-II) score for hematological patients at admission were the same in the Dutch and British cohorts (24 points). At the same time, both hospital (47% vs. 54%) and ICU mortality (34% vs. 41%) were approximately 7% points lower in the Dutch ICU cohort compared to the UK cohort, possibly indicating differences in referral pattern, aggressiveness of treatment or other patient characteristics. In both cohorts, hospital and ICU mortality for hematological patients decreased, while mortality rates of oncological patients did not change. Regardless, the average prognosis of oncological patients remains less than that of the general population. For instance, hematological patients in the Netherlands had twice as high ICU mortality rates than patients without malignancy (34% vs. 17%).
While prior studies have described oncological patient characteristics and outcomes in the United States [8], no published longitudinal analysis for trends in ICU mortality for the United States is available. In the following, we therefore aim to describe trends in admission numbers and patient characteristics for cancer patients admitted to the ICU. Furthermore, we aim to establish if 28-day and 1-year mortality changed over the 10-year period, after adjusting for covariates.
Materials and Methods
Patient information was extracted from a de-identified version of the MIMIC-III (v1.4) database using PostgreSQL (The PostgreSQL Global Development Group, https://www.postgresql.org). MIMIC-III is an open-access ICU database jointly administered by the Massachusetts Institute of Technology (MIT) and the Beth Israel Deaconess Medical Center (BIDMC) [9]. The database comprises over 58,000 hospital admissions for 38,645 adults and 7,875 neonates, spanning from June 2001 to October 2012. Year of admission is not available in this limited, de-identified dataset due to privacy concerns. Therefore, we obtained a supplementary dataset from the administrators. Previously established code from the MIMIC Code Repository was used to generate comorbidity scores and risk scores [10].
1. Cohort selection
All adult patients aged 18 years or older with a diagnosis of any cancer type as identified by International Classification of Diseases, 9th revision (ICD-9) codes 140-199 (solid malignancies) and 209.0-3 (neuroendocrine carcinomas) or 200-208 (hematological malignancy) were included in this study. Patients with incomplete data on admission year, length of stay or severity of illness were excluded during data analysis. Since no complete annual data for 2001 and 2012 was available, all patients admitted in this period were excluded from the base population. If patients were admitted multiple times to the ICU, only their first admission was used for this analysis.
2. Covariates
Patient data on the following variables were extracted from the database: age at admission, sex, race, Elixhauser Comorbidity Index scores (30 components based on ICD-9 codes [11]), duration of vasopressor use, duration of ventilation, Sepsis Related Organ Failure Assessment (SOFA) scores (arterial partial pressure of oxygen or PaO2, fraction of inspired oxygen, platelet count, Glasgow Coma Score or GCS, serum bilirubin, level of hypotension, serum creatinine [12]), APACHE-III scores (heart rate, mean blood pressure, temperature, respiratory rate, PaO2, hematocrit, white blood cell count, serum creatinine, urine output, acute renal failure, serum blood urea nitrogen, serum sodium, serum albumin, serum bilirubin, serum glucose, age, comorbidities, arterial partial pressure of carbon dioxide or PaCO2, pH, GCS [13]), renal replacement therapy, do not resuscitate order (DNR) at admission, ICU mortality, non-hospital mortality (from the Social Security death records). SOFA scores were interpreted as being low (0-5), medium (6-10), and high risk (≥ 11 points), respectively. Duration of ventilation and duration of vasopressor use were converted from continuous to binary variables. Race was categorized into a white and non-white category.
Cancer diagnoses were clustered anatomically according to ICD-9 codes into oral malignancies (1400-1499), gastrointestinal (1500-1599), respiratory and thoracic (1600-1659), connective tissue malignancy and others (1700-1769 and 17300-17399), genitourinary (1800-1899), other solid malignancies (1900-1992 and 20900-20936), lymphoma (20000-20208 and 20270-20288), leukemia (20310-20892), and other hematological malignancies (20210-20268, 20302-20382, and 20290-20302). Metastatic cancers were identified independent of anatomic site based on ICD-9 codes (1960-1991 and 20970-20975).
Information on whether an admission was elective, urgent or emergency was extracted from the admission documentation. Patients with a primary diagnosis of sepsis were identified using the Angus methodology [14], which is based on ICD-9 codes for either a bacterial or fungal infection in combination with acute organ dysfunction.
3. Outcomes
The primary study outcomes were (1) trends in the number and relative frequency of oncological patients admitted to the ICU, (2) all-cause mortality within 28 days and 1 year after ICU admission, and (3) adjusted changes in mortality between 2002-2011. Secondary outcomes were (1) changes in clinical severity scores and (2) mortality rates by cancer type.
4. Statistical analysis
All analyses were performed using the open-access software R (ver. 3.4.2, http://www.R-project.org/) and the following packages: tableone, ggplot2, dplyr, MIMICbook, epitools, sjplot, and MASS. Multiple logistic regression was used to adjust for covariate levels in the longitudinal trend analysis for 28-day and 1-year mortality. Model building was based on expert opinion including the most important confounders and predictors of mortality (C.M.S. and L.A.C.). An alpha-level of 0.05 was used as the cutoff value to reject the null hypotheses. Collinearity analyses were performed. We checked the final model for interaction terms, however did not find any interaction terms that were statistically significant after Bonferroni adjustment.
Results
By restricting our analysis to the first ICU stay for each patient, a total unique patient cohort of 41,468 ICU admissions was obtained. Of these, 4,330 had an oncologic malignancy, 1,083 had a hematological malignancy and 66 patients had a diagnosis of both a hematological and solid malignancy (Table 1, Fig. 1).
Baseline patient characteristics differed considerably between subgroups (Table 1). Hematological patients had highest mean clinical severity scores (APACHE-III) and a higher rate of DNR orders on admission, however were less likely to be ventilated or to receive vasopressors. Furthermore, mean length of ICU and hospital stay for hematological patients was longer than that of non-cancer patients. Oncological patients had patient characteristics that were more similar to those of non-cancer patient, having comparable clinical severity scores and only slightly longer length of ICU and hospital stays. Of note, oncological patients less frequently received vasopressors or ventilation. Both 28-day and 1-year mortality rates of cancer patients were more than two-fold higher than those of non-cancer patients.
Between 2002 and 2011, the overall number of patients admitted to the ICU increased from 3,110 to 5,076, while the number of patients with cancer more than double from 324 to 738 (Fig. 1). 28-Day and 1-year mortality of cancer patients decreased considerably, with 28-day mortality decreasing from 33.3% in 2002 to 23.6% in 2011 (S1 Table). Over the 10-year period, use of vasopressors and ventilators decreased significantly, while clinical severity scores remained overall unchanged, and comorbidity scores increased from 15 to 20.
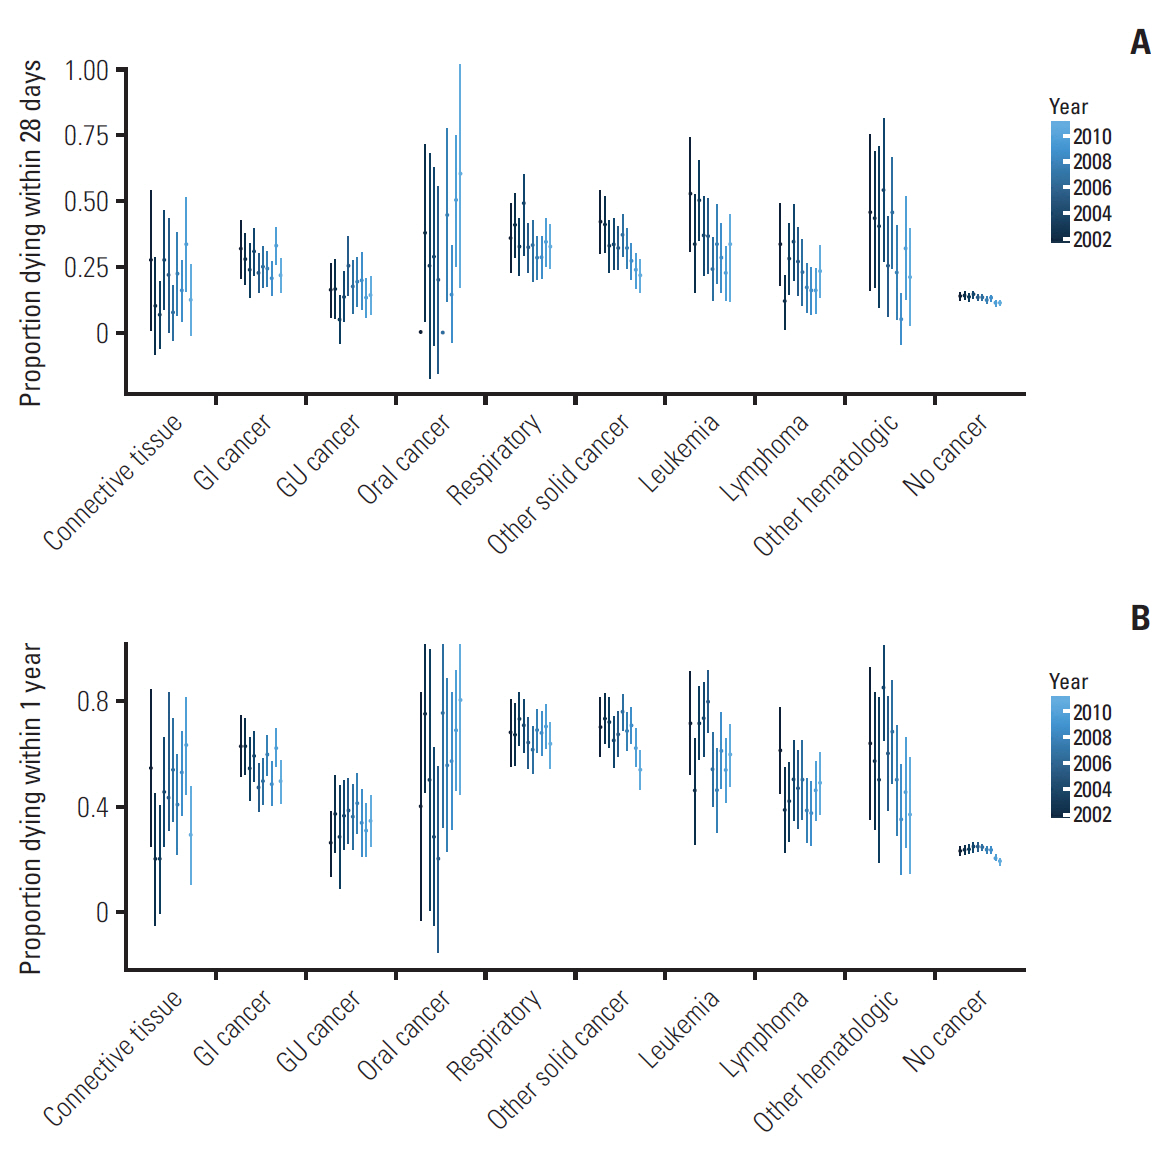
Over the study period, both crude 28-day and 1-year mortality rates decreased for most cancer types (Fig. 2). While overall mortality rates are similar for oncologic and hematologic malignancies, there is considerable variation in mortality rates depending on cancer subtype. 28-Day mortality rates are highest for oral cancers, while genitourinary and connective tissue malignancies have the lowest mortality rates. Among hematologic patients, lymphoma patients sustained highest 28 days mortality rates. 1-Year mortality rates overall follow this trend; however, differences between cancer subtypes are even more pronounced.
Mortality rates are closely associated with clinical severity scores (S2 Fig.). Nearly uniformly, cancer patients across all SOFA score categories had higher probabilities of dying within 28-days than non-cancer patients. This trend is even more pronounced for the 1-year mortality, whereby cancer patients have significantly higher odds of dying than non-cancer patients.
Multivariate logistic regression analysis adjusting for changes in baseline patient characteristics over time confirmed the observed unadjusted trends in mortality. Even after adjustment for covariates, the odds of dying within 28 days was approximately twice as high for cancer patients than comparable non-cancer patients. These differences were more pronounced for 1-year mortality, whereby solid cancer patients had a 4.02 (95% confidence interval, 3.69 to 4.38) times higher odds of dying than non-cancer patients. Between 2002 and 2011, survival for both cancer and non-cancer patients improved considerably (Table 2). Both the short-term and long-term odds of dying of hematologic patients decreased faster than that of oncologic and non-cancer patients. The decrease in the odds of dying over time were similar for oncologic patients and non-cancer patients. However, there was considerable variation by cancer type. While all cancer types had a trend towards lower odds of dying, case numbers were limited for most subgroups, thus affecting precision of the estimate.
Discussion
In this manuscript we report on trends in patient characteristics and outcomes of oncological patients admitted to the ICU in a U.S. teaching hospital. More than 58,000 ICU admissions were analyzed and 41,468 patients were included in the final analysis, among which were 1,083 hematological and 4,330 oncological patients. Cancer patients had comparable clinical severity scores compared to non-cancer patients, yet were more likely to die within 28 days (risk ratio [RR], 2.23) and within 1 year (RR, 2.58). Mortality rates decreased significantly over the study period for all patients, with hematologic patients having a bigger decrease in mortality rates than non-cancer patients. There is considerable variability in survival rates between cancer types, with hematologic malignancies showing strong decreases in adjusted mortality rates. For solid cancers, overall improved survival is primarily driven by a decrease in genitourinary cancers, while no improvements for respiratory cancers could be observed.
While no information on treatment regimens is available in MIMIC-III, it is tempting to speculate that the observed differences in 1-year survival are secondary to improved oncological outcomes from novel, less toxic and more efficient treatment regimens. This claim is supported by the introduction of targeted small-molecule inhibitors, such as imatinib, for hematologic malignancies during the early 2000s, which substantially improved survival [15]. In contrast, targeted therapies for other cancer types were only introduced more recently, which might therefore not be captured in this study.
Overall, our findings confirm the previously reported decrease in mortality rates observed in the United Kingdom [5] and the Netherlands [4] since the millennium change. Interestingly, we observed unchanged clinical severity scores over time, while mortality rates decreased substantially between 2002 and 2011. While 28-day survival of oncological patients (72.3%) was comparable with 30-day survival in the Dutch cohort (73.1%), survival of hematological patients (72.6%) differed considerably from the Netherlands (55%).
Crude 1-year mortality rates for patients with high SOFA scores and gastrointestinal, genitourinary, connective tissue cancer, leukemia, lymphoma, or other solid cancers were exceeding 90%. Furthermore, these exceeded the mortality rates of non-cancer patients with high SOFA scores (74%). Mortality rates differed considerably between the ICU types and are possibly explained by different reasons for admission and long-term prognosis. The notable protective effect observed for cardiac surgical patients could be explained by selection bias, since primarily patients with a favorable oncologic diagnosis might undergoing surgery. In contrast, medical ICU patients might more likely be admitted due to reasons directly related with their underlying disease or treatment complications.
An interesting observation is that solid cancer patients were less likely to receive vasopressors and ventilation than non-cancer patients, even though their clinical severity scores were very similar. We therefore speculate that intensivists were more reluctant to initiate invasive treatment in the solid cancer population. The “less is more” principle has recently been championed in order to prevent overtreatment and subsequent iatrogenic harm [16]. A less aggressive approach for critically ill cancer patients may have contributed to improved outcomes. However, no survival difference was detected, likely due to the worse prognosis of cancer patients. As the adjusted model shows, difference in survival rates of cancer patients compared to non-cancer patients are not explained by differences at baseline, including DNR orders.
Clinicians are frequently faced with the difficult decision whether patients with serious chronic conditions that limit their life expectancy should be admitted to the ICU. This is particularly challenging for oncological patients, where long-term survival might more depend on their underlying malignancy than their acute health problem. Our findings together with previously published results [17-20] suggests that elderly patients with high clinical severity scores, multiple comorbidities and certain cancer types do not sustain long-term survival regardless of intensive treatment. Concurrently, the presence of any malignancy alone is an insufficient predictor of both 28-day and 1-year mortality and treatment decisions should not be based on oncological prognosis alone.
Analysis of over 40,000 admitted patients, including more than 5,000 (hemato-)oncological patients allowed for precise and stratified analysis of patient characteristics, outcomes and predictive factors. Data was retrieved from clinical databases that were compiled at the time of treatment, thereby minimizing bias that may occur due to the retrospective study design. The high resolution of the clinical data is another advantage of this study. Furthermore, we had sufficient statistical power to detect annual changes in mortality of cancer patients.
Major limitations of this study are a lack of important oncological predictive factors, including TNM classification, tumor size, histopathological features and clinical aggressiveness. Preferably, additional information on oncological treatment, including treatment type and time since last dose of chemotherapy should be included in the analysis. This is particularly important since the oncological status could bias the results. Further, no data was available on critically ill patients who were not admitted to the ICU and abstained. In addition, data on rare cancers (including oral cancer and respiratory cancers) was sparse, thus not allowing for a more detailed subgroup analysis. Another disadvantage is that data was obtained from a single-center teaching hospital and generalizability of findings might therefore be limited. Future analyses should preferably include larger cohorts from different hospitals across the United States and contain more oncologic outcomes measures.
Regardless of these shortcomings, the unchanged clinical severity scores over time and results of the multivariate logistic regression suggest that survival of oncologic patients has increased between 2002 and 2011 and is not due to confounding by other variables or selection bias. It is tempting to speculate that the absolute and relative increase in cancer patients admitted to the ICU could be interpreted as a consequence of better oncological survival, rendering more patients at risk of ICU admission. The alternative, namely that the observed increase in oncological patient admissions is due to a more lenient ICU admission policy, is not supported by unchanged clinical severity scores, increased comorbidity scores and another study showing a decrease in ICU utilization among cancer patients between 2002-2013 [8]. Interestingly, 28-day mortality for both cancer and non-cancer patients decreased approximately equally on the multiplicative scale. At the same time, the absolute improvement in survival is larger for cancer patients, due to an approximately two-times higher mortality rate at baseline.
In this descriptive, explanatory study, we recorded a steady and significant increase in the number and proportion of cancer patients admitted to the ICU, unchanged clinical severity scores, increased comorbidity score and a major decrease in mortality rates between 2002 and 2011. Future studies with more detailed cancer-specific information and larger cohorts should investigate whether these trends can be confirmed in other hospitals.