Introduction
Diffuse large B-cell lymphoma (DLBCL) is the most frequent B-cell non-Hodgkin lymphoma (NHL) subtype, accounting for one-third of all cases [1]. In the pre-rituximab era, the cyclophosphamide, doxorubicin, vincristine, and prednisone (CHOP) combination chemotherapy regimen administered every 3 weeks (CHOP-21) has been the gold standard treatment for DLBCL. Numerous randomized studies have investigated the efficacy of dose-intensified regimens and demonstrated that the CHOP regimen repeated every 2 weeks (CHOP-14) is superior to standard CHOP-21 [2,3].
Since rituximab, a human-mouse chimeric monoclonal antibody to the CD20 antigen located on B lymphocytes, was incorporated into combination chemotherapy, the outcome of DLBCL has substantially improved compared with chemotherapy alone in all age groups without additional serious toxicity. This finding has been confirmed by several international, multi-center, randomized studies, establishing rituximab-CHOP (R-CHOP) given every 3 weeks (R-CHOP-21) as the new standard, first-line chemotherapy for DLBCL [4-6]. However, the prognosis of high-risk patients, as indicated by the International Prognostic Index (IPI), is unfavorable, even under R-CHOP-21 therapy, with a 5-year overall survival (OS) rate of less than 50% [7].
Consequently, a series of studies have focused on whether the dose-dense R-CHOP regimen, which is administered every 2 weeks (R-CHOP-14), would offer an efficacy benefit compared with conventional R-CHOP-21 [8,9]. We initiated this prospective, multicenter, randomized, controlled, phase 3 clinical trial to compare the efficacy and safety of first-line treatment with R-CHOP-14 and R-CHOP-21 in adult Chinese patients with previously untreated DLBCL.
Materials and Methods
1. Patient population
Patients were eligible if they met the following criteria: were 18 years of age or older; had histologically confirmed DLBCL; did not undergo previous treatments, including radiotherapy, chemotherapy and surgery; had radiographically measurable disease; exhibited an Eastern Cooperative Oncology Group (ECOG) performance status of 3 or less; had a life expectancy longer than 3 months; and exhibited adequate organ function, including bone marrow (white blood cell ≥ 3.5×10⁹/L, hemoglobin > 100 g/L, platelet > 90×109/L), liver and renal function. Patients were excluded if they met any of the following criteria: had transformed lymphoma; primary central nervous system or testicular lymphoma; a history of other malignancies; other severe comorbidities; were lactating or pregnant; or exhibited any other positive viral markers (except hepatitis B virus [HBV]). For HBV infection, patients were eligible if: hepatitis B virus surface antigen (HBsAg) positive with serum HBV DNA levels less than 1×10⁵ copies/mL and normal liver function irrespective of the status of hepatitis B e antigen (HBeAg) and hepatitis B core antibody (HBcAb), or HBsAg and HBeAg negative, HBcAb positive with serum HBV DNA levels undetectable and normal liver function.
Histologic diagnosis was centrally reviewed by an expert hematopathologist according to the World Health Organization classification. Molecular phenotype was determined using the Hans criteria to classify cases into germinal center B-cell like (GCB) and non-germinal center B-cell like (non-GCB) groups [10].
2. Study design, randomization and masking
This multicenter, randomized, open-label, phase 3 study was conducted at 14 medical centers in China. The study was initially designed to compare the efficacies of CHOP-14, RCHOP-21, and R-CHOP-14 in treating newly diagnosed DLBCL, and eligible patients were centrally, randomly assigned to the three arms in a 1:1:1 ratio. Given that CHOP-14 had not been considered as a standard regimen for DLBCL since 2009, the enrollment of the CHOP-14 group was terminated in December 2010 with the approval of the Ethics Committee. Then, the protocol was updated in January 2011, and subsequent patients were centrally, randomly assigned to treatment with R-CHOP-14 or R-CHOP-21 in a 1:1 ratio by an independent statistician using a computer-generated randomization schedule. Randomization was stratified by participating center. The randomization code was provided in sealed envelopes. Investigators and patients were not blinded to treatment assignment. The data collection staff and the statistician were unaware of treatment assignment.
3. Treatment
The standard R-CHOP regimen consisted of rituximab (375 mg/m2 administered intravenously on day 1), cyclophosphamide (750 mg/m2 administered intravenously on day 2), doxorubicin (50 mg/m2 administered intravenously on day 2), vincristine (1.4 mg/m2 up to a maximal dose of 2 mg, administered intravenously on day 2), and prednisone (60 mg/m2/day for 5 days). R-CHOP-14 was administered every 2 weeks with prophylactic recombinant human granulocyte colony-stimulating factor (G-CSF) from day 7 of each cycle for 6 to 8 days at 1 to 2 μg/kg daily. R-CHOP-21 was administered every 3 weeks with G-CSF administered at the investigator’s discretion. If the neutrophil count was less than 1.5×10⁹/L or the platelet count was less than 100×109/L on the scheduled day, chemotherapy was postponed until recovery of neutrophils and platelets from the low ebb of myelosuppression to minimal values. Patients would be withdrawn from the study if treatment was delayed more than 21 days due to hematological toxicity.
Dosage modification of cytotoxic agents (cyclophosphamide and doxorubicin) was allowed if there was an 8- to 21-day delay due to neutropenia or thrombocytopenia. The doses of cyclophosphamide and doxorubicin were reduced by 25% in cases of an 8- to 14-day delay and 50% in cases of a 15- to 21-day delay, respectively. Non-hematologic toxicities were also taken into consideration for dosage modification at the investigator’s discretion.
For limited-stage DLBCL, patients with bulky disease or any adverse risk factors, including a high lactate dehydrogenase (LDH) level, stage II, age older than 60 years and ECOG ≥ 2, received 6 cycles of R-CHOP chemotherapy followed by involved field radiation therapy (IFRT), whereas patients without adverse risk factors received 3 to 4 cycles of R-CHOP chemotherapy followed by IFRT. For advanced-stage disease, patients received 6 to 8 cycles of R-CHOP with radiation therapy added to residual disease. The radiotherapy dose was 30 to 40 Gy. Prophylactic treatment for central nervous system relapse consisted of intrathecal 15 mg methotrexate and 30 mg cytarabine at each cycle of chemotherapy, which was recommended for patients with bone marrow, paranasal sinuses, orbit, or testis involvement.
For patients with HBV infection, prophylactic entecavir (0.5 mg/day) or lamivudine (100 mg/day) was administered 1 week before chemotherapy and withdrawn 6 months after completion of chemotherapy for those with positive HBsAg, serum HBV DNA levels less than 1×10³ copies/mL, and no prior antiviral therapy. Those who had serum HBV DNA levels higher than 1×10³ copies/mL and less than 1×10⁵ copies/mL were administered with entecavir 0.5 mg once daily. For those who have received prior anti-viral therapy, the previous anti-viral agent was continued. No anti-viral agents were administered to patients with negative HBsAg, HBeAg and positive HBcAb.
4. Assessments
Baseline assessments included the following: a medical history and physical examination; ECOG performance status; laboratory studies, including complete blood cell (CBC) counts, blood biochemistry, urinalysis and pregnancy test; electrocardiogram; contrast-enhanced computed tomography (CT) scanning of the neck, chest, abdomen and pelvis with or without positron emission tomography (PET), which was performed at the discretion of investigators; and a bone marrow biopsy. All assessments were performed within 14 days before randomization.
During treatment, efficacy assessment was performed after every two cycles of R-CHOP chemotherapy and after treatment completion by means of physical examination and contrast-enhanced CT scanning of neck, chest, abdomen and pelvis with or without PET at the discretion of the investigators. CBC counts were monitored every 2 to 3 days after each cycle. Blood biochemistry was repeated before each cycle. During the follow-up period, physical examination, laboratory tests and CT scanning were administered every 3 months for 2 years, then every 6 months for 3 years, and then every year.
Patients with HBV infection were monitored for HBVDNA levels at baseline, before each chemotherapy cycle, and at each follow-up visit.
5. Statistical analysis
The primary efficacy end point was disease-free survival (DFS). Secondary end points included OS, progression-free survival (PFS), response rate and safety. DFS was calculated from the time of complete response (CR) or unconfirmed complete response (CRu) until relapse, death from any cause, or date of last censoring, whichever came first. OS was calculated from the time of randomization until death from any cause or date of last censoring. PFS was calculated from the time of randomization until disease progression, relapse, death from any cause, or date of last censoring. Responses, classified as CR, CRu, partial response (PR), stable disease, and progressive disease, were evaluated according to CT scanning results using the standardized response criteria for non-Hodgkin's lymphomas [11]. Each adverse event was evaluated and graded according to the National Cancer Institute (NCI) Common Toxicity Criteria for Adverse Events (CTCAE) ver. 3.0 [12].
The study was designed to demonstrate an improvement of 12% in 5-year DFS from 50% for R-CHOP-21 compared with 62% for R-CHOP-14 with a hazard ratio (HR) of 0.69. Taking a 5% case drop into consideration, a total sample size of 454 patients was required to provide the study with 80% statistical power and a 2-sided significance level of 5% over 36 months of accrual and 60 months of follow-up.
The data were analyzed on an intention-to-treat analysis. All randomized patients whose intervention was discontinued were included in the analysis. All patients who received at least one dose of study treatment were included in the safety analysis.
Baseline characteristics were summarized and described in a frequency list. Pearson chi-square test or Fisher exact test was performed to compare the proportion of patients with CR, CRu, and PR for R-CHOP-14 vs. R-CHOP-21. The Kaplan-Meier method was used to estimate survival distributions, and the log-rank test was used to compare survival curves. Univariate and multivariate analysis using Cox regression were performed to assess the association of pretreatment factors with DFS and OS. Statistical analyses were performed by investigators at the Cancer Center of Sun Yatsen University using SPSS software ver. 16.0 (SPSS Inc., Chicago, IL). This study was registered with Clinical Trials. gov, number NCT01793844, and Chictr.org.cn, number Chi-CTR-TRC-11001687.
6. Ethical statement
This study complied with all provisions of the Declaration of Helsinki and was conducted in accordance with Good Clinical Practice guidelines. The protocol was approved by the Institutional Review Boards of the lead center, Sun-Yat Sen University Cancer Center (YP2011042), and every other participating center. All patients provided written informed consent.
Results
1. Patient characteristics
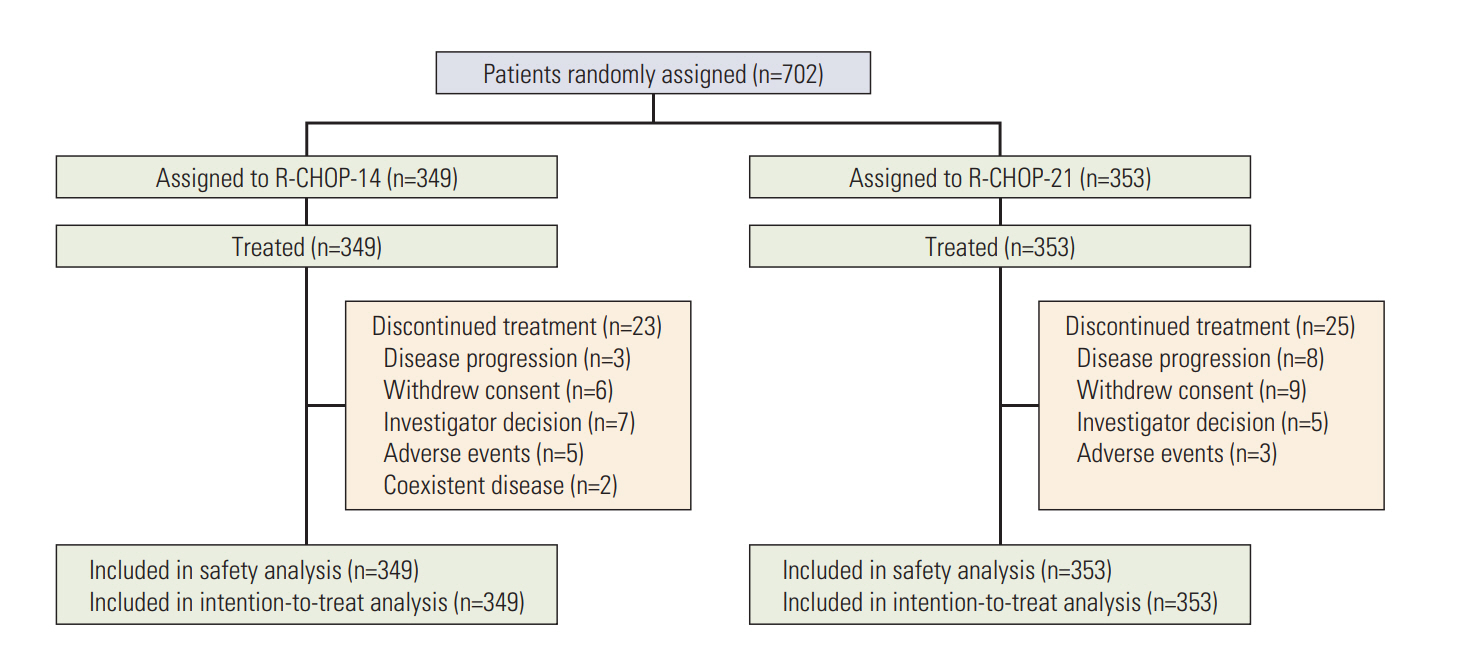
Between January 10, 2008 and December 22, 2014, a total of 702 newly diagnosed DLBCL patients were enrolled with 349 randomly assigned to R-CHOP-14 and 353 to R-CHOP-21 (Fig. 1). Baseline characteristics of patients, including sex, age, presence of B symptoms (fever with body temperature greater than 38 degrees, night sweat, or weight loss of greater than 10% in 6 months with unknown reason), ECOG performance status, LDH level, number of extranodal sites, presence of bulky disease (a mass that was at least 10 cm in diameter), Ann Arbor stage, IPI, and molecular phenotype (assessable for 608 patients), were well balanced between the two groups (Table 1).
Among the 349 patients in the R-CHOP-14 group, 326 (93.4%) patients completed the protocol treatment, and 23 patients discontinued treatment due to disease progression (n=3), consent withdrawal (n=6), investigator decision (n=7), adverse events (n=5) and coexistent disease (n=2). Among the 353 patients in the R-CHOP-21 group, 328 (92.9%) patients completed the protocol treatment, and 25 patients discontinued treatment due to disease progression (n=8), consent withdrawal (n=9), investigator decision (n=5), and adverse events (n=3).
2. Treatment delivery
The relative dose was calculated on the basis of the ratio of the agent doses actually administered over the intended doses. The median relative doses in the R-CHOP-14 and R-CHOP-21 groups were as follows: 98% (interquartile range, 94% to 101%) and 98% (94% to 103%) for rituximab, respectively; 98% (95% to 100%) and 97% (95% to 99%) for cyclophosphamide, respectively; 98% (96% to 101%) and 98% (95% to 100%) for doxorubicin, respectively; 100% (100% to 100%) and 100% (100% to 100%) for vincristine, respectively; and 98% (94% to 101%) and 98% (94% to 101%) for prednisone, respectively (Table 2). The relative dose intensity was calculated based on the ratio of the agent doses actually administered in the actual time over the intended dose in the intended time. The median relative dose intensities in the R-CHOP-14 and R-CHOP-21 groups were as follows: 92% (interquartile range, 88% to 97%) and 93 % (87% to 98%) for rituximab, respectively; 90% (87% to 93%) and 91% (87% to 95%) for cyclophosphamide, respectively; 90% (86% to 95%) and 92% (88% to 97%) for doxorubicin, respectively; 91% (88% to 95%) and 94% (90% to 97%) for vincristine, respectively; and 91% (86% to 97%) and 91% (86% to 97%) for prednisone, respectively (Table 3). One hundred fifty-nine patients (45.6%) in R-CHOP-14 group and 145 patients (41.1%) in R-CHOP-21 group received radiotherapy after chemotherapy.
3. Efficacy
In the R-CHOP-14 group, 241 patients achieved a CR or CRu (69.1%), and 72 patients achieved a PR (20.6%). In the R-CHOP-21 group, 255 patients achieved a CR or CRu (72.2%), and 64 patients achieved a PR (18.1%). No difference was observed in the CR and CRu rate (69.1% vs. 72.2%, p=0.294) or overall response rate (89.7% vs. 90.4%, p=0.588) between the two regimens (Table 4).
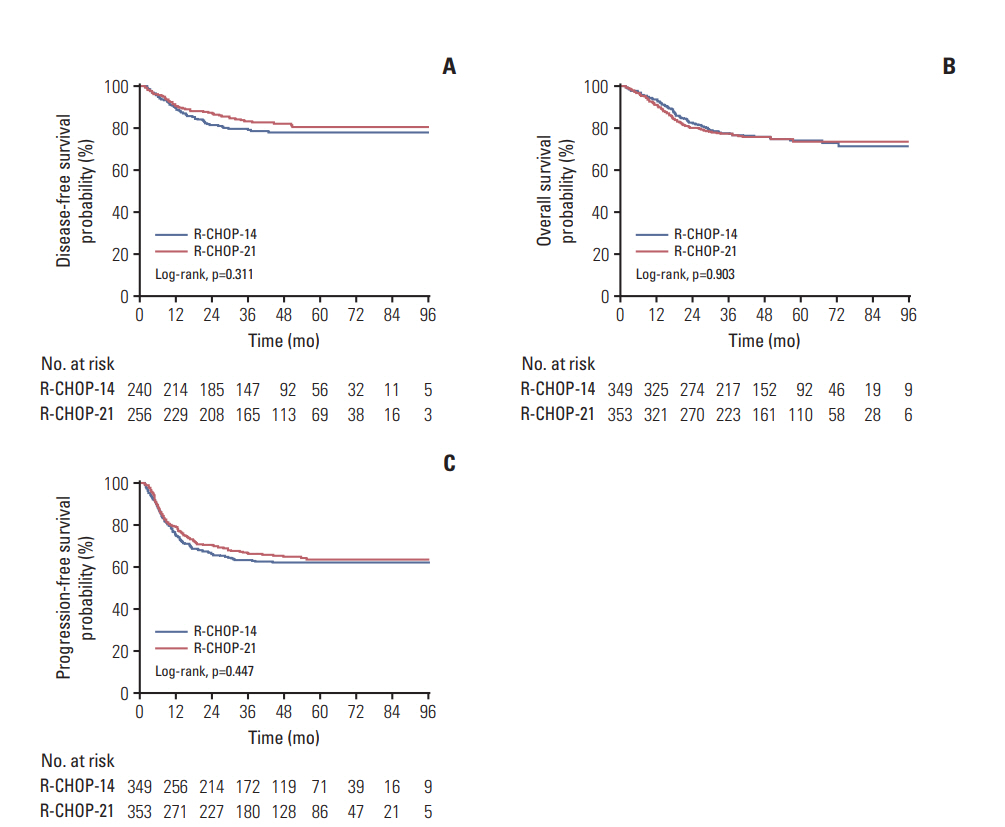
With a median follow-up of 45.6 months (interquartile range, 27.3 to 63.0 months), the estimated 3-year DFS was 79.6% for patients receiving R-CHOP-14 compared with 83.2% for those receiving R-CHOP-21 (HR, 1.230; 95% confidence interval [CI], 0.824 to 1.836; p=0.311). The 3-year OS were 77.5% with R-CHOP-14 vs. 77.6% with R-CHOP-21 (HR, 0.982; 95% CI, 0.728 to 1.324; p=0.903). The 3-year PFS were 63.2% for patients receiving R-CHOP-14 and 66.1% for those receiving R-CHOP-21 (HR, 1.101; 95% CI 0.859 to 1.413; p=0.447). No difference was noted between the two treatment groups with respect to DFS (Fig. 2A), OS (Fig. 2B), or PFS (Fig. 2C).
Subgroup analyses were performed to evaluate the effect of stratification factors (age, sex, B symptom, ECOG performance status, bulky disease, number of extranodal sites, LDH level, Ann Arbor stage, IPI, and subtype) on DFS (Fig. 3A) and OS (Fig. 3B). For DFS, patients with poor ECOG performance status (2-3) benefitted more from R-CHOP-21 treatment. For OS, no factors had predictive significance on the survival benefit of R-CHOP-14 or R-CHOP-21.
Univariate and multivariate analyses using Cox regression were performed to evaluate the prognostic significance of pre-treatment factors on DFS and OS, including sex, age, B symptom, ECOG performance status, bulky disease, extranodal sites, LDH, Ann Arbor stage, IPI, phenotype, and treatment assignment (Table 5). In univariate analysis, male, poor ECOG performance status (2-3), bulky disease, increased LDH, advanced Ann Arbor stage, and higher IPI (3-5) were associated with worse DFS. Male, age older than 60, poorer ECOG performance status (2-3), more than one extranodal site, increased LDH, advanced Ann Arbor stage, and higher IPI (3-5) were associated with worse OS. In multivariate analysis, male predicted worse DFS, and male, older age and increased LDH predicted worse OS. Female patients exhibited a better DFS and OS probably due to an increased proportion of high-risk (IPI 3-5) patients in the male population than in the female population (33.7% vs. 25.8%, p=0.025).
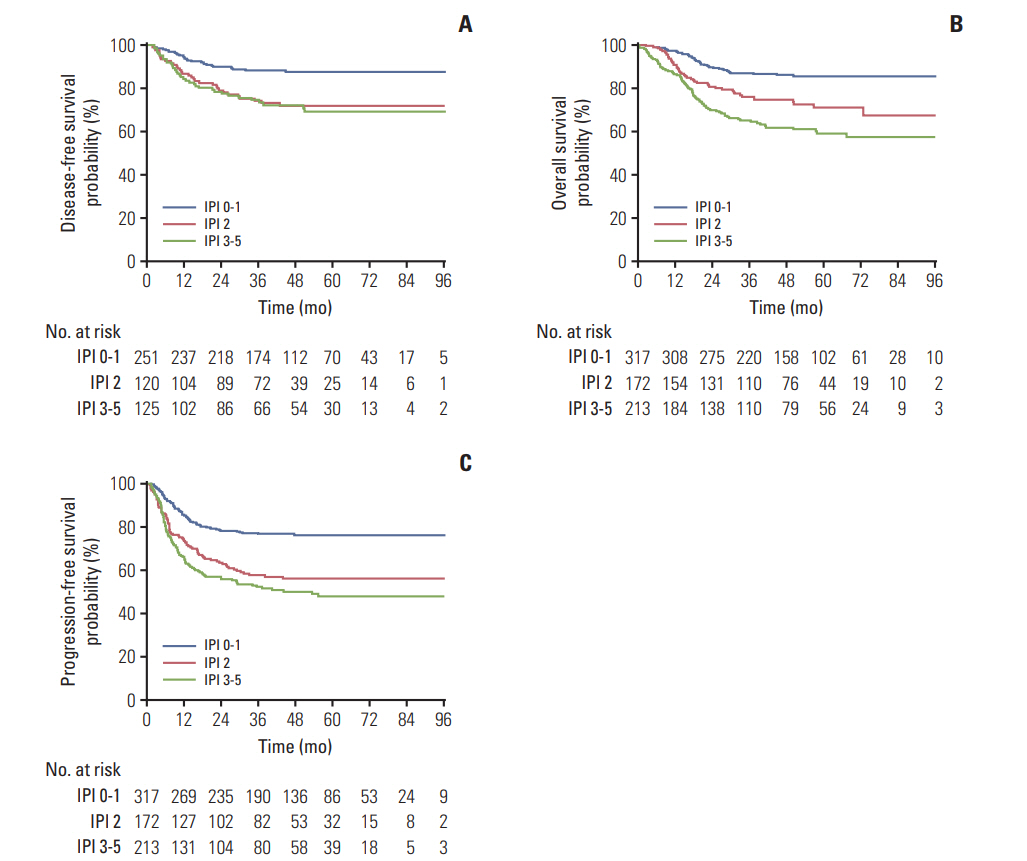
The estimated 3-year DFS (Fig. 4A) were 88.2% (95% CI, 84.1 to 92.3), 74.3% (95% CI, 66.3 to 82.3), and 73.4% (95% CI, 65.4 to 81.4) for patients with IPI scores of 0-1, 2, and 3-5, respectively. The 3-year OS (Fig. 4B) and PFS (Fig. 4C) rates were 86.8% (95% CI, 83.1 to 90.5), 76.0% (95% CI, 69.5 to 82.5), and 65.0% (95% CI, 58.5 to 71.5) and 76.5% (95% CI, 71.8 to 81.2), 57.5% (95% CI, 50.1 to 65.0), and 52.1% (95% CI, 45.0 to 59.2) for the three risk groups, respectively. Patients with IPI ≥ 2 exhibited poorer prognosis compared with IPI 0-1 (Table 6, Fig. 4).
4. Safety
The incidences of grade 3/4 leukopenia and neutropenia were slightly increased with R-CHOP-21 compared to R-CHOP-14, but this difference did not achieve significance. The frequencies of grade 3/4 anemia, thrombocytopenia, and non-hematologic toxicities were similar between the two groups (Table 7). In total, 85 patients in the R-CHOP-14 group died: 77 due to disease progression; four due to infection; 1 due to infectious shock induced by grade 4 neutropenia; one due to intracranial hemorrhage induced by grade 4 thrombocytopenia; one due to a second malignancy; and one due to unknown cause. In total, 87 patients in the R-CHOP-21 group died: 74 due to disease progression; four due to infection; three due to coexistent diseases; one due to a second malignancy; and five due to unknown causes.
Discussion
To our knowledge, this is the first prospective phase 3 study concerning the outcome of the R-CHOP regimen for the treatment of adult patients with newly diagnosed DLBCL in Asian areas. Asian populations presented similar response rates and survival to R-CHOP chemotherapy compared with the results previously reported in developed countries [9]. In spite of prophylactic recombinant human granulocyte colony-stimulating factor, patients in the R-CHOP-14 group developed more grade 3 to 4 neutropenia than reported previously [9]. With the exception of fewer cardiac and neurological toxicities, other hematologic and non-hematologic adverse events were similar to those in developed countries [5,9,13,14].
Patients in both the R-CHOP-14 and R-CHOP-21 groups exhibited good compliance. Our study demonstrated no benefit of the R-CHOP-14 regimen in all efficacy end points, including response rates, DFS, OS, or PFS, compared with the R-CHOP-21 regimen. With prophylactic recombinant human G-CSF, patients treated with R-CHOP-14 exhibited similar and manageable hematologic and non-hematologic toxicities compared with those treated with R-CHOP-21. Our results suggested that both regimens are suitable for Asian patients with DLBCL. Similar findings have been reported in two previous phase 3 clinical trials conducted in European-based Caucasian populations, both of which demonstrated that R-CHOP-14 was not superior to R-CHOP-21 in terms of response rate or survival [8,9].
In the pre-rituximab era, several randomized studies have demonstrated the benefit of dose-intensified chemotherapy compared with conventional chemotherapy. The intensified regimen of doxorubicin, cyclophosphamide, vindesine, bleomycin, and prednisone treatment (ACVBP) with sequential consolidation significantly improved event-free survival and OS in both young low-risk patients and elderly high-risk patients with aggressive lymphoma despite its relatively frequent toxicities compared with the standard CHOP regimen [15,16]. Similarly, the NHL-B1 and NHL-B2 trial demonstrated the survival benefit of CHOP-14 compared with CHOP-21 in young and elderly patients with aggressive lymphoma, respectively [2,3]. However, this benefit appears to be offset by the introduction of rituximab. Although intensified immunochemotherapy with R-ACVBP followed by subsequent consolidation substantially improved the survival of young low-intermediate risk DLBCL patients in contrast to standard R-CHOP in the LNH03-2B study, the significantly increased hematological toxic effects and serious adverse events limited its extensive use in the clinic [17]. Several studies revealed favourable survival of dose-intensive rituximabcontaining treatment followed by autologous hematopoietic stem cell transplantation in young high-risk patients [18-20]. However, prospective randomized studies are needed to compare the efficacy of the regimen with conventional immunochemotherapy. A limitation of this study is that treatment response was evaluated according to CT scanning results using the 1,999 criteria for non-Hodgkin's lymphomas without PET evaluation due to lack of conditions for high-quality PET-CT in some centers at the start of the study.
In this study, high-risk patients with IPI ≥ 2 exhibited a poorer prognosis compared to those with IPI 0-1. How to improve the outcome on the basis of R-CHOP for these patients deserves further investigation. New targeted agents, such as lenalidomide or ibrutinib, in combination with immunochemotherapy have achieved encouraging efficacy in newly diagnosed non-GCB subtype DLBCL, which should be investigated in the first-line treatment for high-risk patients [21,22].
This study demonstrated that the dose-intensive R-CHOP-14 regimen was not superior to R-CHOP-21 in Asian DLBCL patients. The incidences of hematologic and non-hematologic toxicities between two regimens were similar. Both treatments are suitable for Asian DLBLC patients. For high-risk patients with IPI ≥ 2, new combination regimens based on R-CHOP deserve further investigation to improve the outcome.