Introduction
The radical gastrectomy with D2 node dissection is a standard procedure in Asian countries that has significantly improved patient survival [1]. Nevertheless, locally advanced gastric cancer has a wide range of clinical outcomes after surgery, influenced by many factors [2,3]. A series of genomic profiling studies have also revealed considerable heterogeneity in gastric cancers, which can be classified into several subtypes on the basis of microsatellite instability, Epstein-Barr virus infection and chromosomal instability [4,5]. Each subtype has distinct survival outcomes, which suggests that innate biological attributes noticeably affect the prognosis of patients with gastric cancer [4]. Therefore, reliable biomarkers are needed to predict recurrence in gastric cancer patients.
Adjuvant chemotherapy after surgery, such as S-1 monotherapy or capecitabine plus oxaliplatin therapy, decreases recurrence and mortality among East Asian patients with locally advanced stage II-III gastric cancer [6-8]. Previous studies have also identified several metabolic enzymes that are involved in the response to chemotherapy. For example, thymidylate synthase (TS) catalyzes the conversion of dUMP to dTMP and plays a pivotal role in DNA biosynthesis and repair. TS activity in tumor tissues may influence the response to fluoropyrimidine-based chemotherapy, including TS-1 and capecitabine [9,10]. Excision repair cross-complementation group 1 (ERCC1) is another important enzyme that is involved in a rate-limiting step during nucleotide excision repair and double-strand DNA repair. Previous studies indicated that non-small cell lung cancers with high ERCC1 expression are resistant to platinum-based chemotherapy [11,12]. Based on these results, we suspect that expression of TS and ERCC1 may help predict response to adjuvant chemotherapy using capecitabine plus oxaliplatin among patients with gastric cancer.
The immune checkpoint pathway that involves programmed cell death-1 (PD-1) and its ligand (PD-L1) plays a major role in the immune evasion processes of malignant tumors [13]. Accumulating evidence suggests that PD-1 blockade using a monoclonal antibody is active in gastric cancers that express PD-L1 and the earliest clinical trial revealed an overall response rate of 22% in recurrent or metastatic gastric cancer patients [14]. Tumor expression of PD-L1 is associated with patient prognosis in many cancers [15,16] and several studies have indicated that PD-L1 has prognostic value in gastric cancer [17-20].
The present study involved a post-hoc analysis of patients with gastric cancer who were enrolled in a landmark adjuvant chemotherapy trial (the CLASSIC trial) [7,8] that evaluated the efficacy of capecitabine plus oxaliplatin after D2 gastrectomy. We also performed a subgroup analysis to evaluate the predictive values of each potential biomarker in the adjuvant chemotherapy plus surgery group (“the adjuvant chemotherapy group”) and in the surgery along group.
Materials and Methods
1. Study population and ethical statement
This post-hoc analysis evaluated patients with gastric cancer who were enrolled in a phase III open-label multi-center randomized controlled trial (the CLASSIC trial) that compared capecitabine plus oxaliplatin after D2 gastrectomy versus D2 gastrectomy alone. A consecutive subset of the CLASSIC trial participants (n=144, enrolled between May 2006 and April 2009 at the Yonsei Cancer Center) were selected for the present study. All patients had undergone radical gastrectomy with D2 lymph node dissection for their primary gastric tumors and were randomized to receive either adjuvant chemotherapy or surgery alone. Among the 144 patients, the present study excluded five patients because immunohistochemical (IHC) analysis of their tumors was not technically feasible. Thus, the present study evaluated 139 patients with a median follow-up duration of 98.5 months at April 2017. Data regarding age, sex, tumor stage, and pathological findings were retrospectively obtained from databases of the CLASSIC trial and Severance Hospital. Tumors were staged according to the sixth version of the American Joint Committee on Cancer (AJCC) criteria.
2. Immunohistochemistry
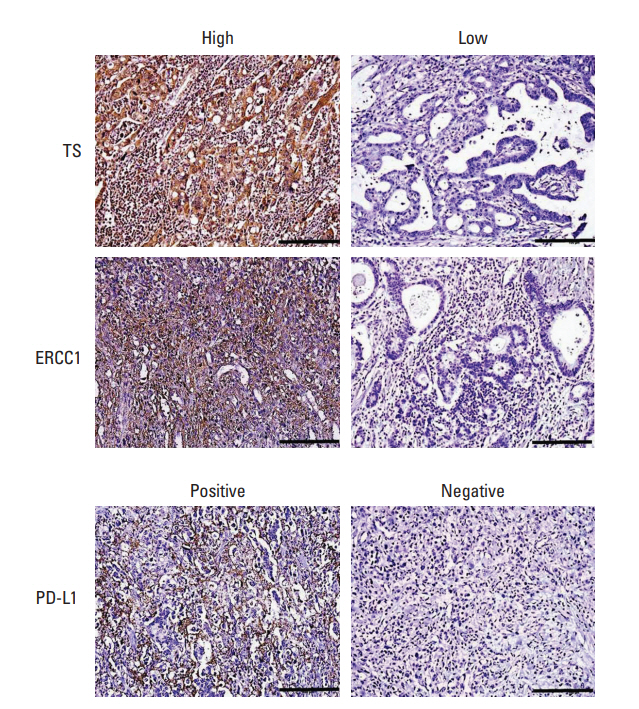
Stored formalin-fixed paraffin-embedded tissues from the patients’ primary gastric tumors were collected, and a microtome was used to create 4-μm sections for IHC. The presence of carcinoma in the sections was confirmed using a pathological review of hematoxylin and eosin staining results. The sections were de-paraffinized and rehydrated using xylene and ethanol, and antigen retrieval was performed using a target retrieval solution (citrate pH 6; Agilent, Santa Clara, CA). The IHC staining was performed using primary antibodies against TS (TS106, Thermo Scientific, Waltham, MA), ERCC1 (8F1, Abcam, Cambridge, UK), and PD-L1 (SP142, Spring Bioscience, Pleasanton, CA) with chromogenic detection that was performed using a peroxidase/DAB kit (EnVision Detection Systems, Agilent). We used the weighted histoscore method (H-score) to determine the TS and ERCC1 expression scores. For TS and ERCC1 expression, sections of HeLa cell blocks and the normal tonsil were used as positive controls for TS and ERCC1 antibody, respectively. Mouse IgG2a (Dako Cytomation, Glustrup, Denmark), excluding the primary antibody, was used as the negative control. For TS and ERCC1 expression, the staining intensity of tumor cells was classified as 0 (negative), 1 (light brown), 2 (brown), or 3 (dark brown). The protein expression was interpreted using the histoscore, calculated by the multiplying staining intensity and proportion of stained tumor cells as follows: (0×% of negative cells)+(1×% of light brown cells)+(2×% of brown cells)+(3×% of dark brown cells) [21]. For example, a specimen with 20% of cells classified as an intensity of 3, 20% as 2, 30% as 1, and 30% as 0 (unstained cells) would have a histoscore of (3×20)+(2×20)+(1×30)=130. Histoscores range from 0 to 300. Tumors with H-score ≥ 100 were defined as having high TS or ERCC1 expression, whereas tumors with H-score < 100 were defined as having low TS or ERCC1 expression. The proportion of membranous PD-L1 staining on tumor cells or intercalated inflammatory cells was evaluated, and tumors with ≥ 1% of cells expressing PD-L1 were defined as PD-L1-positive tumors [22]. Representative IHC images for TS, ERCC1, and PD-L1 are shown in Fig. 1. All pathological reviews were performed by pathology experts who were blinded to the patients’ clinical and survival data.
3. Statistical analysis
Fisher exact test or the chi-square test was used to compare clinical variables according to treatment group and biomarker status. Disease-free survival (DFS) was defined as the time from surgery to recurrence, second primary cancer, or death, and overall survival (OS) was defined as time from the date of the operation to the date of death from any cause. Data for patients who had not had an event were censored as of the date of final observation. DFS and OS after surgical resection were compared in each biomarker group using the Kaplan-Meier method and log-rank test. Cox regression analysis was performed to determine the hazard ratios (HR) and 95% confidence intervals (CIs) for DFS and OS according to the clinical variables and biomarkers. The biomarkers’ values for predicting DFS and OS were estimated using multivariate Cox regression analysis, which was adjusted for the T category and N category. Differences were considered statistically significant at two-tailed p-values < 0.05, and all data were analyzed using IBM SPSS software ver. 24.0 (IBM Corp., Armonk, NY). GraphPad Prism software (GraphPad Software Inc., San Diego, CA) was used to create the Kaplan-Meier curves.
4. Ethical statement
The present study’s protocol was approved by the institutional review board (IRB) of Severance Hospital (4-2017-1111). This study is the retrospective post-hoc analysis of CLASSIC trial, and the informed consent for CLASSIC trial enrollment was obtained from all patients. The requirement for additional informed consent for this study was waived by the IRB because this study was performed more than 5 years after the CLASSIC trial enrollment and acquisition of the tumor tissue.
Results
1. Baseline patient characteristics
The post-hoc analysis evaluated data from 139 patients with stage II-III gastric cancer who underwent radical gastrectomy with or without adjuvant chemotherapy (Table 1). Eightyfive patients (64%) underwent subtotal gastrectomy and 50 patients (36%) underwent total gastrectomy. The patients were randomized to the adjuvant chemotherapy subgroup (n=66) or the surgery alone subgroup (n=73). In the adjuvant chemotherapy subgroup, 52 patients (80.3%) completed eight cycles of capecitabine plus oxaliplatin chemotherapy and the remaining patients stopped adjuvant chemotherapy because of consent withdrawal (n=7), chemotherapy toxicity (n=3), or disease recurrence during chemotherapy (n=4). In accordance with previous reports regarding this population, the two treatment groups did not have any significant differences in their clinical variables and histological findings (Table 1).
2. Clinicopathological characteristics according to TS, ERCC1, and PD-L1 status
All tumors were analyzed for TS and ERCC1 expression, and the patients were dichotomized according to the IHC score (H-score ≥ 100 vs. H-score < 100). There were no differences in the clinicopathological characteristics of the patients with low TS expression and high TS expression (Table 2). Compared to cases with low ERCC1 expression, cases with high ERCC1 expression were more likely to involve female patients (p < 0.001), signet ring cell carcinoma (p=0.012), the diffuse type based on the Lauren classification (p=0.001), no lymphovascular invasion (p=0.017), and total gastrectomy (p=0.025). Positive tumor expression of PD-L1 was associated with non-signet ring cell carcinoma (p=0.01), the intestinal type based on the Lauren classification (p=0.003), and N2 category disease (p=0.003). There were no significant associations between the TS, ERCC1, and PD-L1 expression statuses in the patients’ tumors (S1 Table).
3. Values of TS, ERCC1, and PD-L1 expression for predicting DFS and OS among all patients
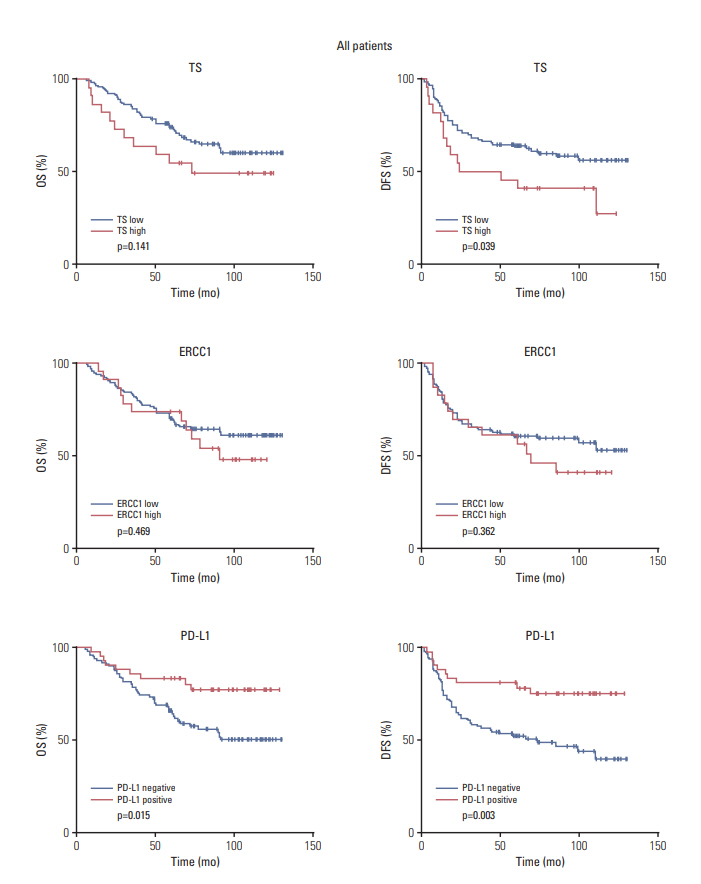
The values of TS, ERCC1, and PD-L1 expression for predicting DFS and OS after surgical resection were evaluated among all patients. Compared to low TS expression, high TS expression was associated with significantly worse DFS (p=0.039) but not OS (p=0.141) (Fig. 2). In contrast, ERCC1 expression was not associated with DFS or OS. Positive PD-L1 expression was associated with significantly better DFS (p=0.003) and OS (p=0.015) (Fig. 2). In the univariate Cox analysis of DFS and OS (Table 3), higher T category and N category tended to predict poorer DFS (T category, p=0.064; N category, p=0.070) and poorer OS (T category, p=0.051; N category, p=0.203). In the multivariate Cox analysis, which were adjusted for T category and N category (Table 4), high TS expression tended to be associated with poorer DFS (HR, 1.80; 95% CI, 0.99 to 3.28; p=0.053) but not poorer OS. Positive PD-L1 expression independently predicted favorable DFS (HR, 0.33; 95% CI, 0.17 to 0.65; p=0.001) and favorable OS (HR, 0.38; 95% CI, 0.18 to 0.78; p=0.009). The expression of ERCC1 was not associated with DFS or OS in the Cox regression analysis.
4. Values of the biomarkers for predicting survival in the adjuvant chemotherapy and surgery alone subgroups
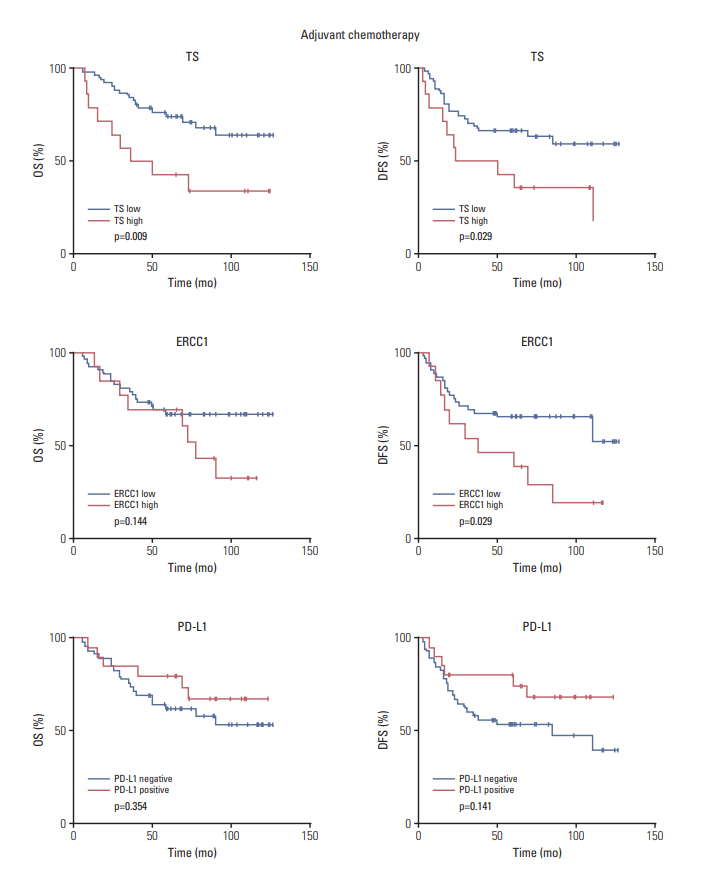
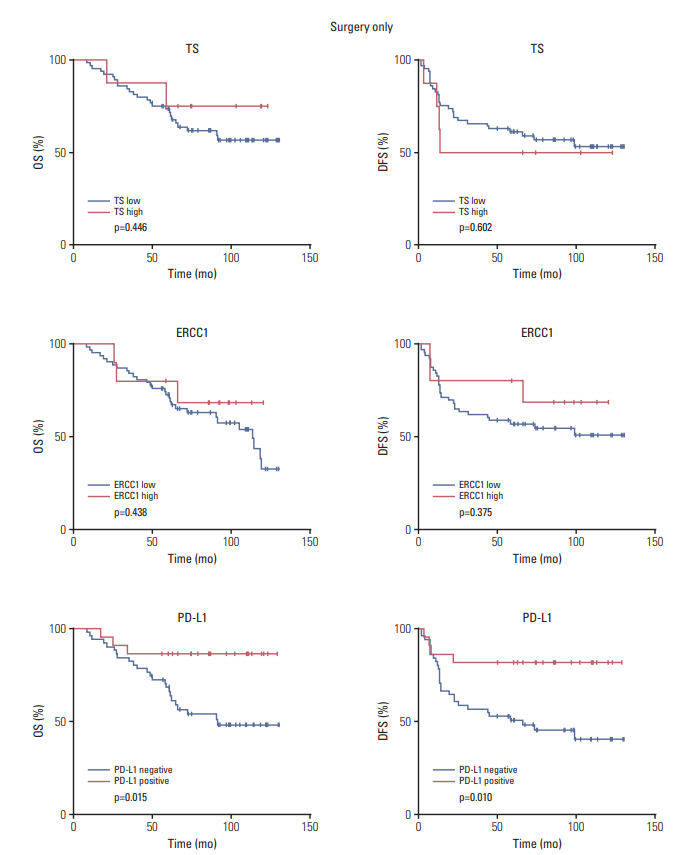
In the adjuvant chemotherapy subgroup, high TS expression was associated with significantly worse DFS (p=0.029) and OS (p=0.009), but it was not associated with survival in the surgery alone subgroup (Figs. 3 and 4). Similarly, high ERCC1 expression in the adjuvant chemotherapy subgroup was associated with significantly worse DFS (p=0.029) (Fig. 3). In the surgery alone subgroup, positive PD-L1 expression was associated with favorable DFS (p=0.010) and favorable OS (p=0.015) (Fig. 4), with the DFS and OS values being non-significantly higher than in the adjuvant chemotherapy subgroup (DFS, p=0.141; OS, p=0.354) (Fig. 3). In the multivariate Cox analysis, which was adjusted for T category and N category (Table 5), high TS expression in the adjuvant chemotherapy subgroup independently predicted worse DFS (HR, 2.51; 95% CI, 1.14 to 5.52; p=0.022) and worse OS (HR, 3.34; 95% CI, 1.42 to 7.87; p=0.006). However, high ERCC1 expression showed a trend of being associated with poor DFS, but it was not statistically significant on multivariate Cox analysis (HR, 2.08; 95% CI, 0.94 to 4.58; p=0.070). In the surgery alone subgroup, high PD-L1 expression significantly predicted favorable DFS (HR, 0.25; 95% CI, 0.09 to 0.73; p=0.011) and favorable OS (HR, 0.22; 95% CI, 0.07 to 0.57; p=0.015).
Discussion
The present study evaluated whether the expression of TS, ERCC1, or PD-L1 could predict survival after primary gastrectomy with or without adjuvant chemotherapy in gastric cancer patients from single center study of CLASSIC trial. The results indicated that high expression of TS significantly predicted poor DFS and OS in the adjuvant chemotherapy subgroup but not in the surgery only subgroup. PD-L1 expression predicted significantly better DFS and OS in the surgery alone subgroup but not in the adjuvant chemotherapy subgroup. Patients with high ERCC1 expression showed significantly shorter DFS in the adjuvant chemotherapy group compared to that of patients with low expression, but the prognostic impact of ERCC1 expression on DFS did not show statistical significance in the multivariate Cox regression analysis (p=0.070). These results suggest that high expression of TS predicts a poor response to adjuvant chemotherapy using capecitabine plus oxaliplatin, while PD-L1 expression is a general prognostic marker that predicts favorable tumor behavior. Therefore, these biomarkers may be useful for predicting recurrence risk and selecting appropriate therapeutic interventions after surgical resection of gastric cancer.
The prognosis of gastric cancer patients varies from patient to patient after surgery and adjuvant chemotherapy, which highlights the need for reliable biomarkers in this setting [6,8]. Furthermore, survival outcomes remain poor for recurrent or metastatic gastric cancer [23], although several novel agents have been approved as standard treatments, such as trastuzumab [24] and ramucirumab [25]. Therefore, biomarkers that can facilitate stratification of recurrence risk could help guide the selection of adjuvant chemotherapy. For example, a study reported that S-1 adjuvant chemotherapy provides more clinical benefit in gastric cancers with high TS and dihydropyrimidine dehydrogenase enzyme expression, and patients with carboxylesterase 2 gene polymorphisms were reported to show high capecitabine toxicity and antitumor response [10,26]. In addition, platinum-based chemotherapy agents are commonly combined with fluoropyrimidines for treating gastric cancer, and ERCC1 expression and XRCC1 and XPD polymorphisms were reported as significant prognostic factors in patients treated with platinumbased chemotherapy [12,27]. Previous studies have examined the prognostic significance of TS and ERCC1 expression in patients with gastric cancer who received adjuvant chemotherapy [28-31], although those studies were limited by their small sample size and retrospective design. Moreover, there is no validated marker for predicting response to adjuvant chemotherapy using capecitabine plus oxaliplatin. Our results suggest that high expression of TS could predict a poor response to this adjuvant chemotherapy among patients with gastric cancer. Therefore, alternative strategies with different chemotherapeutic agents should be considered for patients with high TS expression. It might also be useful to consider novel biological agents that can modulate TS activity.
The immune checkpoint pathway involving PD-1/PD-L1 plays a major role in the immune evasion mechanism of malignant tumors. Two monoclonal antibodies that block this pathway (pembrolizumab and nivolumab) have notable anti-tumor activity in patients with gastric cancer [14,32]. Interestingly, some studies have indicated that tumor expression of PD-L1 is associated with a favorable prognosis [17,20], while other studies have suggested that it is associated with a poor prognosis [18,19]. These contradictory results may be attributed to differences in the primary antibody to PD-L1, the IHC staining procedure, the PD-L1 scoring system, and the patients who were evaluated. Nevertheless, our results indicate that PD-L1 expression independently predicts a favorable prognosis in curatively resected gastric cancer patients without adjuvant chemotherapy. The major mechanism for PD-L1 expression is mediated by interferon γ in inflamed tumor tissues. Increased PD-L1 expression indicates an active T-cell response in the tumor tissues, which leads to favorable tumor behavior and clinical outcomes. In our study, the PD-L1 expression was not associated with survival in the adjuvant chemotherapy group. Two clinical trials are currently testing the efficacy of adjuvant therapy using anti-PD-1 blockade in gastric cancer after surgical resection (CheckMate-577 [NCT02743494] and KEYNOTE-585 [NCT03221426]), and their results should help clarify the predictive role of PD-L1 expression in the adjuvant setting.
The strength of the present study lies in its post-hoc analysis of prospectively collected data from patients with gastric cancer who were selected for a prospective trial and followed-up for a prolonged period of time. In addition, the present study included a sub-analysis of each treatment arm, which allowed us to clarify the prognostic value of the biomarkers among patients who received adjuvant chemotherapy or surgery alone.
However, the present study also has several limitations. First, the data were obtained from patients who participated in the CLASSIC trial at a single center, which limited the sample size. In addition, the portion of patients with high TS expression was small. Despite the prognostic significance of this marker, the result might be attributed to chance. To find the statistical significance, we performed a bootstrapping analysis using 1,000 re-samplings. The number of null hypothesis rejections was moderate to high (range, 276 to 851, data not shown). Therefore, the results for our prognostic factors were statistically significant, although the possibility that the results were attributed to chance could not be ruled out completely. In addition, the prognostic impact of AJCC stage was not statistically significant in our study population. However, the pathologic T category and N category were correlated with a poor prognosis. In addition, stage III patients showed shorter DFS and OS than stage II patients, although the difference was not statistically significant because of the small sample size (S2 Fig.). Therefore, more research with larger sample sizes is needed to validate our findings. Second, further studies are also needed to validate the cut-off criteria for interpreting the IHC results with the same primary antibodies that were used.
In conclusion, we performed a post-hoc analysis of prospectively collected clinical trial data to evaluate whether TS, ERCC1, and PD-L1 expression could predict survival among patients with gastric cancer. The results revealed that high tumor expression of TS predicted poor survival after adjuvant chemotherapy using capecitabine plus oxaliplatin, whereas PD-L1 expression was associated with favorable DFS and OS in the surgery only subgroup. We suggest that these biomarkers may be useful to perform stratification of recurrence risk after surgical resection of locally advanced gastric cancer and may facilitate the design of customized adjuvant therapies for individual patients.