Introduction
Prostate cancer (PC) is a highly prevalent disease that constitutes a significant proportion of cancer death and has a profound public health impact in Western countries [1]. Similarly, increasingly westernized diet habits, increased PC screening, and a rapidly aging population have contributed to greater PC prevalence in Asian countries including Korea. According to 2014 nationwide cancer statistics in Korea, PC is the fifth most common cancer in men and the most common urologic tumor in Korea, with 9,785 new cases reported in 2014 [2].
The number of PC patients diagnosed in early stages has been increasing mainly due to the PC screening test, although its clinical utility remains controversial [3]. Among treatment modalities, surgery is still the most commonly used for clinically localized PC, and radical prostatectomy (RP) cases have significantly increased over time in Korea, from 22.4% of active treatments in 2003 to 45.4% in 2013 [4]. Meanwhile, owing to the early detection and treatment of PC, long-term survival after RP has been increasing. Therefore, healthrelated quality of life (HRQOL) has become a critical issue for PC patients undergoing RP. HRQOL information related to RP may be particularly valuable for PC patients needing to make decisions about surgery vs. active surveillance or surgery vs. radiotherapy [5]. Furthermore, the association between patient quality of life (QOL) and different surgical techniques has become another important issue. Currently, minimally invasive surgery such as robot-assisted radical prostatectomy (RARP) and laparoscopic radical prostatectomy (LRP) is widely performed, along with open retropubic radical pro-statectomy (RRP). While all surgical modalities are reported to have comparable oncologic outcomes [6], a systematic review indicated that no surgical approach was superior to the others in terms of functional outcomes [7], although several studies have reported that LRP or RARP showed better functional outcomes compared to RRP [8].
While many studies have addressed QOL after definitive therapy for localized PC [9,10], no study has yet compared HRQOL based on validated QOL measurement tools among patients treated with three different surgical modalities. In this study, we aimed to investigate longitudinal changes in HRQOL of PC patients after each type of radical surgery and to compare their HRQOL with the age-matched general population.
Materials and Methods
1. Study design and population
This study was a multicenter, prospective longitudinal cohort study that included consecutive newly diagnosed PC patients who underwent RP (open, laparoscopic, and robotic) between October 2014 and December 2015. Patients were recruited at seven academic medical centers in Korea. Since patients’ QOL after RP can be affected by the level of surgical skill, we included patients treated by surgeons who had completed an uro-oncological fellowship, had more than 8 years of uro-oncology clinical experience after their fellowship, and had a minimum of 30 cases of RP per year. All participating surgeons had performed at least 100 cases of prior RPs. Surgery method was determined after shared treatment decision making between clinician and patients. Patients who provided written informed consent were asked to fill out a selfadministered questionnaire before surgery (after histologic confirmation and within 2 weeks of the date of surgery) and at 3 and 12 months postoperatively (with a window of 14 days). In the event of any difficulties understanding or completing the questions, nurse or research assistants assisted in the completion of the questionnaire.
Exclusion criteria included those patients (1) diagnosed with double primary cancer before or after PC; (2) with severe complications (grade 3 or higher according to the modified Clavien system); (3) who were undergoing adjuvant hormonal or radiation treatment; (4) who underwent salvage treatment due to biochemical recurrence; or (5) who refused to participate in the study or had communicational difficulties.
To compare the HRQOL levels of PC patients with those of general population, we used HRQOL data from the general population without a cancer history that had been collected previously [11,12]. The general population sample was selected from the nationwide survey, “Awareness of Quality of Cancer Treatment among the General Population in Korea," conducted between November and December in 2012. The questionnaire included the European Organization for Research and Treatment of Cancer Quality-of-Life Questionnaire (EORTC QLQ-C30), as well as the sociodemographic and medical information of the participants, making it comparable to the PC patient cohort. To ensure representativeness of the sample, a stratified probability sampling using a two-stage systematic sampling method was employed—after stratifying the population based on region, we systematically extracted samples based on the population ratio. The sampling error within a 95% confidence interval was ±2.2%. The participants were limited to those who were within an age range of 40-70 years (considering the purpose of the study) and those without a history of cancer.
Professionally trained interviewers visited the identified households and enrolled eligible participants. Absence of cancer history was confirmed by self-report. Among 4,851 eligible participants, a total of 2,000 individuals completed the survey questionnaire (response rate, 41.2%). The major reasons for refusal to participation were lack of time (54%), privacy concerns (25%), and inconvenience (17%). Details of the study design and procedures are described in detail elsewhere [11,12].
2. Measures of QOL
In this outcome study, HRQOL was the primary outcome of interest. The Korean version of the EORTC QLQ-C30 [13,14] and its prostate module (QLQ-PR25) [15,16] were used to measure HRQOL. EORTC QLQ-C30 [13,14] was designed as a multidimensional assessment of QOL using five scales of functional assessment (physical, role, emotional, cognitive, and social), three symptom scales (fatigue, nausea and vomiting, and pain), a global health status and QOL scale, and six single items (dyspnea, insomnia, appetite loss, constipation, diarrhea, and financial difficulties). Of the 30 items in QLQ-C30, 28 are scored on 4-point Likert scales, while the two items for the global QOL scale are scored on 7-point linear analog scales. The EORTC QLQ-PR25, which was designed to assess PC-specific QOL, contains 25 questions in six domains (urinary symptoms, incontinence aid, bowel symptoms, hormonal treatment-related symptoms, sexual activity, and sexual functioning) [15,16]. Domain scores of the QLQ-C30 and PR25 modules were calculated according to the established scoring manual provided by the EORTC QOL group as follows [13,15]: the raw scores of each scales were linearly transformed to a scale of 0 to 100, with 100 representing the worst symptom status or the best functional status, and scale scores were not computed when > 50% of the responses of the corresponding scale were missing values.
In addition, questionnaire items included sociodemographic information such as marital status, education level, and smoking and drinking status. Clinical data including the type of surgery, tumor stage, Gleason score, Karnofsky performance status (KPS), and initial prostate-specific antigen (PSA) value were obtained from hospital medical records.
3. Statistical analysis
Descriptive statistics were used for the baseline demographic and clinical characteristics. Mean (standard deviation) of each scale of the EOTRC QLQ-C30 and the PR25 module at each time point was calculated.
For the comparisons of each domain of HRQOL by time point and operation type, we used a generalized estimating equation (GEE) to perform the analyses of repeated measures data. For the comparison of HRQOL by time point for the entire patient population, the models were adjusted for baseline sociodemographic characteristics, clinical characteristics, and types of surgery as outlined above, and comparisons were made between 3 months vs. baseline, 12 months vs. baseline, and 12 months vs. 3 months, respectively, while case wise deletion was used for any missing data. Comparisons of the changes in HRQOL according to the type of surgery were also performed using the same GEE model for both the postoperative 3-month and 12-month time points. Interactions between operation type and time point were generally not significant, and were excluded from the final models.
Function in 5 scales of the EORTC QLQ-C30 and overall QOL were compared between the PC patients and the general population using a subset of the matched population. For matching, we used 1:1 propensity score matching, in order to reduce bias in the statistical analysis of observational data. Considering the age distribution of the general population dataset, we excluded those who were aged under 40 or over 71 from each dataset. Then, propensity scores were estimated using logistic regression based on baseline age, marital status, education level, and smoking and drinking status and matched with a Mahalanobis algorithm with a caliper of 0.01 [17]. Paired t test was used to compare the functional scales of the HRQOL between the PC patients and the general population for each time point.
As this was an observational study, sample size was not formally determined, and it was based on enrollment volume of participating centers. All analyses were conducted using Stata ver. 14.0 (StataCorp, College Station, TX) with p < 0.05 considered statistically significant. A clinically meaningful difference was defined as 10 points or more on the 0-100 scale of the EORTC QLQ scores, as previously suggested [18].
4. Ethical statement
The Institutional Review Board of the National Cancer Center of Korea approved this general population survey (IRB No. NCCNCS-12-635) and the study protocol was approved by the Institutional Review Board of the Eulji University Hospital (No. 2014-08-012).
All participants were fully informed as to the purpose of the study and provided written consent.
Results
1. Subjects and recruitment results
During the study period, a total of 258 patients were recruited. After excluding 13 patients who did not meet the inclusion criteria and 36 patients with various exclusion criteria, 209 patients constituted the PC population. The study flow is shown in S1 Fig. All patients finished the baseline survey, and 180 (86.1%) and 190 (90.9%) patients completed the questionnaires at postoperative 3 and 12 months, respectively.
2. Patient characteristics
The number of patients who underwent RRP, LRP, and RARP was 41 (19.6%), 63 (30.1%), and 105 (50.2%), respectively. Table 1 summarizes the baseline characteristics of the PC patients. Mean age of patients was 66.6 years (standard deviation [SD], 6.6). Mean PSA level was 10.4 ng/mL (SD, 11.9; range, 1.2 to 118). According to the pathologic stage, 153 (73.2%) and 56 (26.8%) patients had pathological T2 and T3 disease, respectively. The number of patients with pathological Gleason scores of 6, 7, and 8 or higher was 41 (19.6%), 130 (62.2%), and 38 (18.2%), respectively. The majority of patients (76.4%) had a normal performance status. No significant differences were observed in baseline characteristics among the three RP groups, except performance status (Table 1).
3. Overall trends in QOL of PC patients
QOL changes in the PC patients after RP are shown in Table 2. Most of the HRQOL categories assessed by the EORTC QLQ-C30 showed improvement over time. While role functioning worsened at postoperative 3 months, it recovered over time to nearly baseline status at 12 months. On the other hand, cognitive functioning significantly improved at 3 months compared to baseline, and the improvement was maintained at 12 months. At 12 months, physical, emotional, and cognitive functioning showed significant improvement compared to baseline. While global QOL at 3 months was similar compared to baseline, it significantly improved at 12 months. Similarly, some of the QLQ-C30 symptom scores improved over time. Pain, insomnia, diarrhea, and financial difficulties showed significant improvement at 12 months compared to baseline. Meanwhile, fatigue, nausea and vomiting, dyspnea, and constipation showed no significant change before and after RP.
PC-specific HRQOL, as assessed by EORTC QLQ-PR25, showed significant deterioration with the exception of bowel symptoms at postoperative 3 months compared to baseline (Table 2). Urinary symptoms and incontinence aid significantly worsened at 3 months, though they recovered at 12 months to nearly baseline status. Bowel symptoms significantly improved at 12 months compared to baseline. However, hormonal treatment-related symptoms, sexual activity, and sexual functioning were significantly worse at 3 months and remained poorer than baseline at 12 months, although they showed a tendency toward improvement after 3 months.
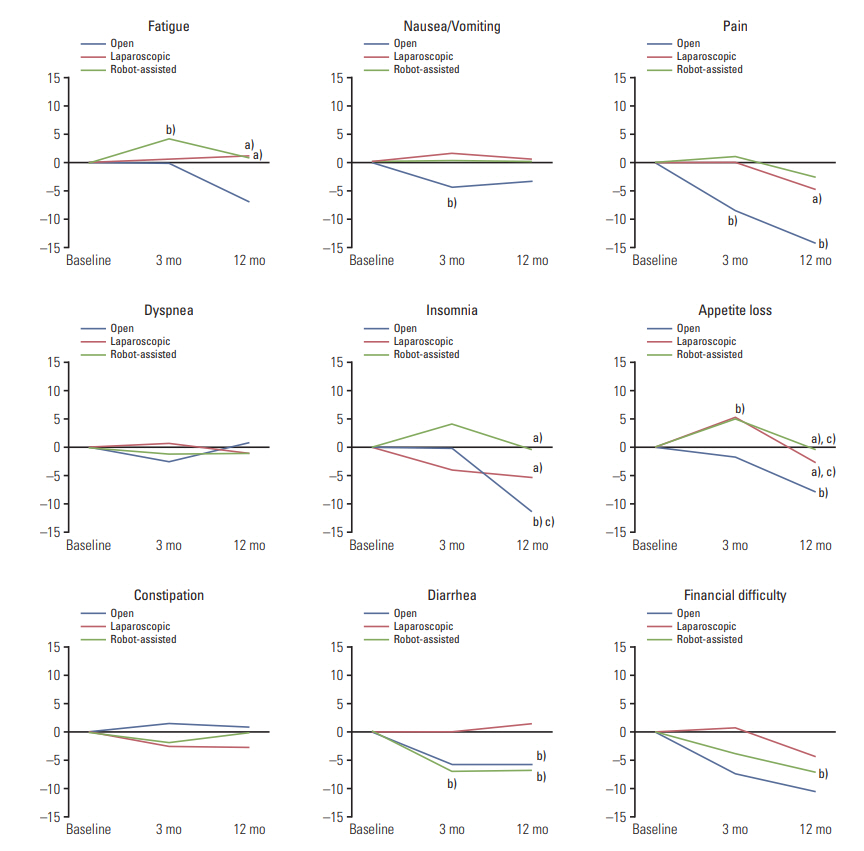
4. Changes in QOL by type of RP
While the QLQ-C30 functional scales after each type of RP (Fig. 1) generally improved over time, the recovery pattern was not significantly different according to the surgery type except in the case of emotional and social functioning. Emotional functioning at 12 months and social functioning at 3 and 12 months were significantly worse in the LRP group than in the RRP group. However, the difference was not clinically significant (score difference < 10) (Fig. 1).
Fig. 2 shows the changes in the QLQ-C30 symptom scales after each type of RP. While most symptom scales were similar at each time point among the groups, the RRP group showed greater improvement compared to the RARP or LRP groups in terms of fatigue, pain, insomnia, and appetite loss at 12 months, and the score differences for pain and insomnia were clinically significant (> 10 point).
Comparison of the QLQ-PR25 among the RP groups (Fig. 3) showed that while 3 of the RP modalities showed a similar recovery pattern, sexual activity at 3 months was significantly better in the LRP and RARP groups than in the RRP group.
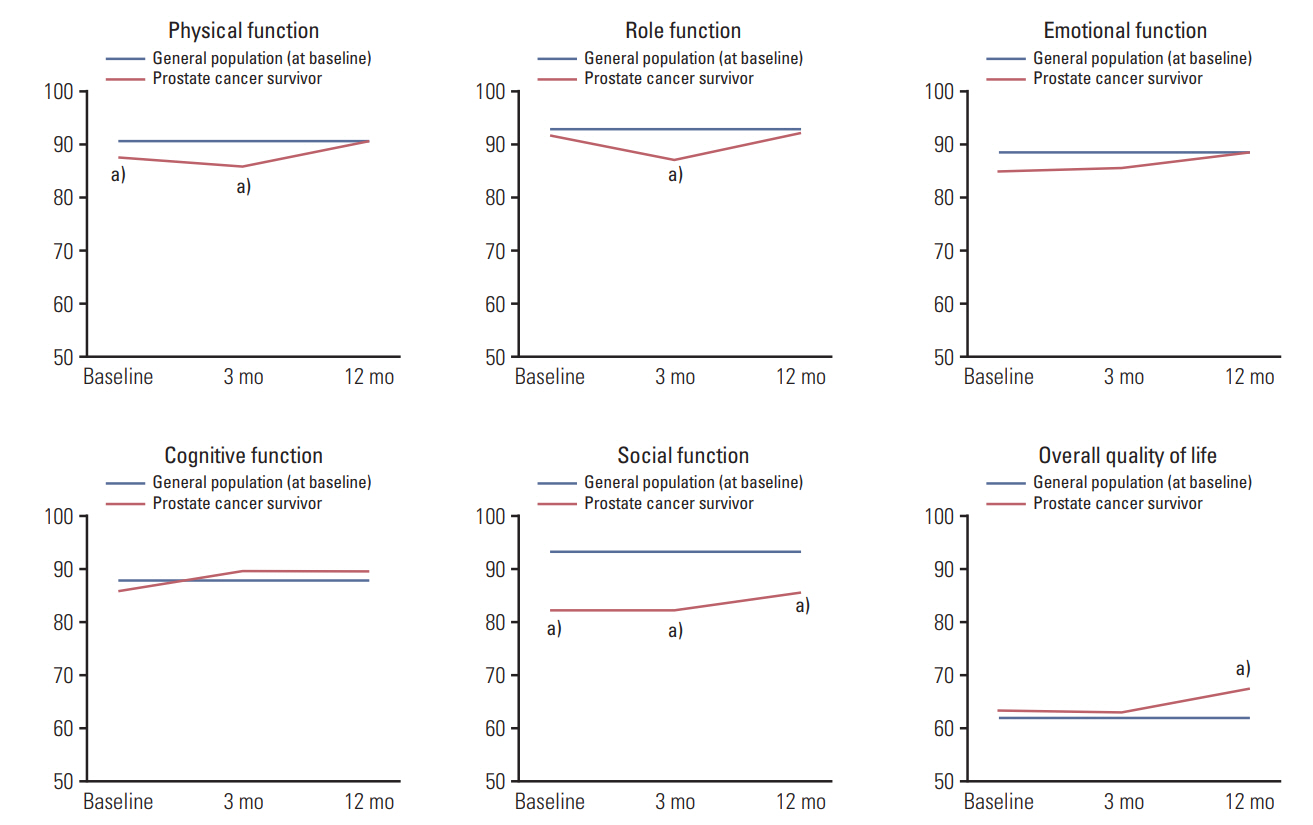
5. Comparison of QOL with matched general population
After propensity-score matching, 114 patients were selected and compared with the same number of controls from the general population. Table 3 shows the baseline characteristics of PC patients and matched general population. There were no statistical differences between the two groups regarding age, comorbidity, education level, marital status, smoking, and drinking.
Comparisons of the HRQOL changes over time between PC patients after RP and the matched population are shown in Fig. 4. At baseline, the physical and social functioning of PC patients was significantly lower than that of the general population, with no improvement at 3 months after surgery. While the physical functioning of the PC patients became similar to that of the general population at postoperative 12 months, the social functioning of the PC patients continued to be significantly lower than that of the general population at 12 months. Role, emotional, and cognitive functioning, as well as the overall QOL of the PC patients were similar to those of the general population at baseline. While the role functioning of the PC patients significantly decreased at postoperative 3 months, it recovered and became similar to that of the general population at 12 months. The emotional and cognitive functioning of the PC patients showed no change over 12 months and remained comparable to that of the general population. On the other hand, the overall QOL of the PC patients at postoperative 12 months was significantly better than that of the general population.
Discussion
To our knowledge, this is the first prospective and longitudinal cohort study to examine the changes in HRQOL after three types of RP and to compare the HRQOL of disease-free PC survivors with that of the general population. More specifically, our study is the first to compare HRQOL after RRP, LRP, and RARP using validated questionnaires.
Overall, RP did not have a negative impact on QLQ-C30 functioning scales over 1 year, except for a transient decrease in role functioning at 3 months that recovered to baseline status at 12 months. In addition, physical, emotional, and cognitive functioning and global QOL showed significant improvement over 1 year without deterioration at 3 months. Our results, showing no negative impact on the functional scales after RP, are consistent with those of a prior German study using EORTC QLQ-C30 and QLQ-PR25 [19] and a U.S. study using SF-36 and UCLA questionnaire [20]. For example, a longitudinal study by Litwin et al. [20] reported that over 90% of RP patients reached baseline HRQOL status at postoperative 1 year. Our results also show that several symptom scales, specifically pain, insomnia, diarrhea, and financial difficulties, significantly improved over time after RP. The finding that many domains of HRQOL at postoperative 1 year were significantly higher than those at baseline status may reflect that the baseline QOL of patients with untreated PC was compromised and subsequently improved over time after surgery, which is consistent with a prior study [20].
In contrast, RP was found to have a negative impact on PCspecific HRQOL. At postoperative 3 months, 5 domains of the QLQ-PR25, excluding bowel symptoms, showed significant deterioration. Urinary symptoms and incontinence aid recovered at 12 months, whereas hormonal symptoms, sexual activity, and sexual functioning did not recover to baseline status and remained poorer at 12 months. Our results are in accordance with previous studies showing that patients who underwent RP experienced lower urinary tract symptoms and sexual dysfunction, with the former recovering gradually and the latter not improving [9,10,21]. Indeed, a U.S. study reported that urinary function recovered at postoperative 12 months following RP, whereas sexual function did not improve [9]. Thus, group education [22] and erectile rehabilitation therapy (i.e., pills, injection, vacuum device) [23,24] may be considered after surgery in order to minimize postoperative sexual dysfunction in RP patients.
We found that most functioning and symptom scales were not significantly different among the RP groups with a few exceptions. For example, emotional and social functioning was lower in patients who underwent LRP than in those who underwent RRP (not clinically significant, i.e., score difference < 10), while the improvements in pain and insomnia were greater (clinically significant) in the RRP group than in the LRP and RARP groups. Meanwhile, most PC-specific HRQOL categories were similar between the RP groups; however, sexual activity at 3 months (though not at 12 months) was significantly better (also clinically significant) in the LRP and RARP groups than in the RRP group. Consistent with this finding, several recent studies have reported that LRP and RARP are superior to traditional RRP in terms of urinary incontinence and sexual dysfunction complications [7,8], although those studies have limitations in that the investigators interviewed patients [7] or used a non-validated questionnaire [8]. Since interview-assessed functional outcomes after surgery show a limited association with questionnairebased evaluations and may overestimate functional recovery [25], our results based on self-administered validated questionnaires that indicate comparable HRQOL outcomes among RP types may more accurately reflect QOL data in terms of patient perception.
Given that the baseline HRQOL of PC patients may be compromised due to untreated cancer and thus may differ from that of the general population, we also longitudinally compared the HRQOL of PC patients with that of the general population. We found that PC patients seem to experience a slight deterioration in physical, role, and social functioning from the time of surgery onward for several months. While physical and role functioning appeared to recover up to 12 months postoperatively, the social functioning of PC patients remained lower than that of the general population at 1 year, which merits clinical attention and intervention. Group education [22] and psychosocial intervention [26] may be helpful to improve the social functioning of PC survivors and have been found to increase the likelihood of remaining employed.
Interestingly, the overall QOL score of the PC patients was similar to that of the general population at baseline and postoperative 3 months, and became even slightly higher at postoperative 12 months, although this increase was not clinically significant. This finding was consistent with cross-sectional studies from Germany [27,28] in which the global QOL of PC patients was found to be comparable to that of the general population. As in previous studies [29,30], our results indicate that PC survivors have the capacity to positively adapt to the challenges of cancer diagnosis and treatment and that their experience of cancer survival may contribute to a more positive perception of QOL.
Our study has certain limitations. We acknowledge possibility of selection bias. Though we aimed to enroll all consecutive RP patients during the study period, 18.9% (49 out of 289 screened patients) were excluded due to various reasons (shown in the S1 Fig.), which might affect HRQOL. Though exclusion of some patients were to minimize impact of possible confounding factors on primary outcome (HRQOL), it is possible that patients who participated in our study are generally in better physical condition and therefore have better HRQOL than those who did not participate. In addition, our results were based on a relatively short follow-up period (1 year), with a lack of randomization to treatment. Relatively small sample size, specifically in open RP group, is another limitation. Because entire patient cohort was not large enough (n=209) and matched cohort with general population was rather small (n=114), we could show QOL comparison results between matched PC patients and general population (Fig. 4) without separate comparison between each type of RP and general population. Nevertheless, the strengths of our study include its prospective design, inclusion of a longitudinal cohort, and usage of a validated and standardized questionnaire during follow-up. Despite non-randomization of surgical methods, no significant differences in baseline characteristics among the three RP groups, except performance status (probably due to very small number of patients with Karnofsky score 80), indicate that selection bias depending on the surgical methods may be minimal. Although our patients were recruited from multiple institutions and treated by multiple surgeons, we recruited patients who were treated by experienced uro-oncologic surgeons in order to minimize the factor of surgical expertise. Finally, the comparison of the HRQOL of PC patients with that of agematched general populations is another strength.
In the present longitudinal cohort study that included both a comparison of HRQOL among the three current RP surgical modalities and a comparison of HRQOL between RP patients and the general population, the majority of the functional and symptom scales significantly improved over time after RP. In contrast, RP patients showed a transient deterioration of PC-specific HRQOL, and those with compromised PC-specific QOL experienced recovery over the course of 1 year in all scales except sexual functioning. The various surgical modalities all showed a similar recovery pattern of HRQOL. The compromised social functioning of RP patients at postoperative 1 year warrants clinical consideration and further supportive interventions. Our findings have the potential to assist patients to make truly informed decisions around surgical treatment for PC.